Last updated: September 14, 2026
Monitoring Claude Code Usage and Costs with OpenTelemetry
Claude Code can export its own telemetry through OpenTelemetry, giving you a standard way to monitor how it's being used without installing an additional instrumentation wrapper.
Once enabled, Claude Code emits metrics about sessions, token usage, costs, and activity. It can also export structured events through the OpenTelemetry logs signal and, with its beta tracing support enabled, spans that show how individual interactions progress through model requests and tool calls.
In this tutorial, you'll configure Claude Code to send its telemetry to a local OpenTelemetry Collector, then inspect the resulting metrics, logs, and traces in a local observability stack.
Prerequisites
This tutorial assumes that you already use Claude Code and have it installed and authenticated on your machine. You can use any existing project where you normally work with Claude Code.
You'll also need:
- Docker with Docker Compose support.
- An available port
4317for OpenTelemetry Protocol (OTLP) over gRPC. - Ports
8080,9090,5601, and16686open for the local observability tools.
Configuring Claude Code to emit telemetry
Claude Code has built-in OpenTelemetry support, so you don't need to install an SDK or modify the applications you use it with. Once telemetry is enabled, Claude Code can export metrics, structured events through the OpenTelemetry logs signal, and distributed traces over the OpenTelemetry Protocol (OTLP).
You can configure OpenTelemetry in two main ways:
- Setting environment variables in the shell before starting Claude Code.
- Adding the same variables to a Claude Code
settings.jsonfile.
Environment variables are convenient when you are testing telemetry or only want the configuration to apply to a particular terminal session. A settings file is better when you want monitoring enabled automatically whenever you start Claude Code.
Enabling Claude Code telemetry with environment variables
To get started, export the following variables in the terminal where you intend to start Claude Code:
123456789export \CLAUDE_CODE_ENABLE_TELEMETRY=1 \CLAUDE_CODE_ENHANCED_TELEMETRY_BETA=1 \OTEL_METRICS_EXPORTER=otlp \OTEL_LOGS_EXPORTER=otlp \OTEL_TRACES_EXPORTER=otlp \OTEL_EXPORTER_OTLP_PROTOCOL=grpc \OTEL_EXPORTER_OTLP_ENDPOINT=http://localhost:4317 \OTEL_METRIC_EXPORT_INTERVAL=10000
CLAUDE_CODE_ENABLE_TELEMETRY enables telemetry collection, while the three
OTEL_*_EXPORTER variables tell Claude Code to send metrics, logs, and traces
through OTLP. If you intend to disable a specific signal, you can use none
instead.
CLAUDE_CODE_ENHANCED_TELEMETRY_BETA is required specifically for distributed
tracing. Metrics and logs don't depend on this beta flag.
The OTEL_EXPORTER_OTLP_PROTOCOL and OTEL_EXPORTER_OTLP_ENDPOINT settings
apply to all three signals. In this tutorial, Claude Code sends OTLP over gRPC
to a local OpenTelemetry Collector listening on port 4317. Claude Code doesn't
choose an OTLP protocol automatically, so you need to configure one when using
the otlp exporter.
Metrics are exported every 60 seconds by default. The
OTEL_METRIC_EXPORT_INTERVAL setting reduces that interval to 10 seconds so
that new measurements appear more quickly while you follow the tutorial. You can
adjust this as you wish.
Capturing prompt and tool content (optional)
If you want to inspect richer Claude Code activity, you can enable the additional variables below:
1234export \OTEL_LOG_USER_PROMPTS=1 \OTEL_LOG_TOOL_DETAILS=1 \OTEL_LOG_TOOL_CONTENT=1
These three variables increase the amount of detail included in Claude Code's logs:
OTEL_LOG_USER_PROMPTS=1includes the text of user prompts in the exported logs.OTEL_LOG_TOOL_DETAILS=1records additional details about tool calls, such as tool names and parameters.OTEL_LOG_TOOL_CONTENT=1includes tool input and output content in the exported events.
They make the telemetry easier to explore, but they can also expose prompts, source code, commands, file contents, and other sensitive data so review the privacy implications before enabling them in a shared or production environment.
When you start Claude Code in the same shell, it'll pick up the environment variables and start generating telemetry for that process according to your configuration. All other Claude Code processes will be unaffected unless you add the exports to your shell profile.
Configuring telemetry in Claude Code settings
If you want telemetry enabled whenever you use Claude Code, put the same
variables under the env key in a Claude Code settings file.
Claude Code supports a few
settings scopes:
~/.claude/settings.json applies to every project you're working on, while
.claude/settings.json applies to everyone using a particular project and can
be committed to source control. There's also .claude/settings.local.json for
configuration that should only apply to you in one project.
For a configuration that follows you across all projects, edit
~/.claude/settings.json:
123456789101112131415{"env": {"CLAUDE_CODE_ENABLE_TELEMETRY": "1","CLAUDE_CODE_ENHANCED_TELEMETRY_BETA": "1","OTEL_METRICS_EXPORTER": "otlp","OTEL_LOGS_EXPORTER": "otlp","OTEL_TRACES_EXPORTER": "otlp","OTEL_EXPORTER_OTLP_PROTOCOL": "grpc","OTEL_EXPORTER_OTLP_ENDPOINT": "http://localhost:4317","OTEL_METRIC_EXPORT_INTERVAL": "10000","OTEL_LOG_USER_PROMPTS": "1","OTEL_LOG_TOOL_DETAILS": "1","OTEL_LOG_TOOL_CONTENT": "1"}}
Although Claude Code can pick up many settings changes while it is running, OpenTelemetry configuration is only read at startup so you must restart Claude Code after changing these values.
Setting up the local observability stack
With Claude Code configured to export metrics, logs, and traces over OTLP, you need somewhere to receive and inspect that telemetry.
For this tutorial, you'll use a local Docker Compose environment containing:
- An OpenTelemetry Collector to receive and route telemetry
- Prometheus to store metrics and Perses to visualize them
- Data Prepper to receive logs over OTLP and index them into OpenSearch
- OpenSearch to store logs, and OpenSearch Dashboards to browse them
- Jaeger to store and view traces
These tools were chosen because they are fully open source and independently governed. Prometheus, Perses, and Jaeger are CNCF projects, while OpenSearch is hosted by the OpenSearch Software Foundation under the Linux Foundation. You can swap any of them for a different OpenTelemetry backend if you prefer.
The complete pipeline looks like this:
1234567891011Claude Code|| OTLP/gRPCvOpenTelemetry Collector|+--> Prometheus|+--> Data Prepper --> OpenSearch|+--> Jaeger
The companion repository for this tutorial contains the complete Docker Compose setup and the required OpenTelemetry Collector, Data Prepper, OpenSearch, and Perses configuration.
Clone the repository and move into its directory:
1https://github.com/dash0-community/claude-code-monitoring && cd claude-code-monitoring
Then start the observability stack:
1docker compose up -d
Docker Compose starts all seven services and keeps their data in local Docker volumes, so your telemetry remains available across container restarts.
Confirm that everything is running:
1docker compose ps
You should see otelcol, prometheus, opensearch, opensearch-dashboards,
data-prepper, jaeger, and perses running:
12345678NAME IMAGE COMMAND SERVICE CREATED STATUS PORTSdata-prepper opensearchproject/data-prepper:2.16.0 "bin/data-prepper" data-prepper 2 minutes ago Up 2 minutes 0.0.0.0:21893->21893/tcp, [::]:21893->21893/tcpjaeger jaegertracing/jaeger:2.20.0 "/cmd/jaeger/jaeger-…" jaeger 21 hours ago Up 21 hours 0.0.0.0:16686->16686/tcp, [::]:16686->16686/tcpopensearch opensearchproject/opensearch:3.6.0 "./opensearch-docker…" opensearch 24 hours ago Up 21 hours 0.0.0.0:9200->9200/tcp, [::]:9200->9200/tcp, 0.0.0.0:9600->9600/tcp, [::]:9600->9600/tcpopensearch-dashboards opensearchproject/opensearch-dashboards:3.6.0 "./opensearch-dashbo…" opensearch-dashboards 24 hours ago Up 21 hours 0.0.0.0:5601->5601/tcp, [::]:5601->5601/tcpotelcol otel/opentelemetry-collector-contrib:0.158.0 "/otelcol-contrib --…" otelcol 21 hours ago Up 21 hours 0.0.0.0:4317->4317/tcp, [::]:4317->4317/tcpperses persesdev/perses:v0.54.0 "/bin/perses --confi…" perses 21 hours ago Up 9 hours 0.0.0.0:8080->8080/tcp, [::]:8080->8080/tcpprometheus prom/prometheus:v3.13.2 "/bin/prometheus --c…" prometheus 24 hours ago Up 21 hours 0.0.0.0:9090->9090/tcp, [::]:9090->9090/tcp
How the local telemetry pipeline works
The
contrib distribution
of the OpenTelemetry Collector is configured via the otelcol.yaml file. It
listens for OTLP/gRPC traffic
on port 4317, which matches the endpoint you configured earlier for Claude
Code telemetry (via OTEL_EXPORTER_OTLP_ENDPOINT).
12345678910111213141516171819202122232425262728293031323334353637# otelcol.yamlreceivers:otlp:protocols:grpc:endpoint: 0.0.0.0:4317exporters:debug:verbosity: detailedotlp_http/prometheus:endpoint: http://prometheus:9090/api/v1/otlptls:insecure: trueotlp_grpc/jaeger:endpoint: jaeger:4317tls:insecure: trueotlp_grpc/data_prepper:endpoint: data-prepper:21893tls:insecure: trueservice:pipelines:traces:receivers: [otlp]exporters: [debug, otlp_grpc/jaeger]logs/claude:receivers: [otlp]exporters: [debug, otlp_grpc/data_prepper]metrics/claude:receivers: [otlp]exporters: [debug, otlp_http/prometheus]
The Collector receives all three OpenTelemetry signals on this single endpoint and routes each one to the appropriate backend:
- Metrics are forwarded to Prometheus through its OTLP receiver.
- Logs are sent to Data Prepper, an OpenSearch ingestion pipeline that exposes an OTLP source.
- Traces are forwarded to Jaeger's OTLP receiver.
The Collector also writes each signal to its debug exporter so that you can confirm that Claude Code telemetry is indeed reaching the Collector before troubleshooting one of the downstream backends (you can remove it once you know everything works).
You can inspect the Collector output at any time with:
1docker compose logs -f otelcol
Your local observability environment is now ready. Start a new Claude Code session from the terminal where you configured the OpenTelemetry environment variables (or from anywhere if you used the global settings config) and use Claude Code as you normally would:
1claude
As you work, Claude Code will send metrics, logs, and traces to the Collector. In the following sections, you'll confirm that each signal is arriving and see what the resulting telemetry looks like.
Inspecting Claude Code metrics in Prometheus and Perses
Once the Collector receives Claude Code metrics, it forwards the data to
Prometheus's native OTLP endpoint at http://prometheus:9090/api/v1/otlp which
is different from the
traditional Prometheus model
where Prometheus scrapes a metrics endpoint periodically.
Prometheus is started with its OTLP receiver enabled and with
otlp-deltatocumulative, which allows it to
ingest delta OpenTelemetry metrics
and convert them to cumulative series when necessary.
Prometheus' delta-to-cumulative OTLP conversion is currently experimental, which is acceptable for this local tutorial but worth noting before copying the setup into production.
12--web.enable-otlp-receiver--enable-feature=otlp-deltatocumulative
If you prefer to export cumulative temporality metrics directly from Claude Code instead (to avoid the conversion on the Prometheus side), you can use the following environment variable:
1export OTEL_EXPORTER_OTLP_METRICS_TEMPORALITY_PREFERENCE=cumulative # defaults to `delta`
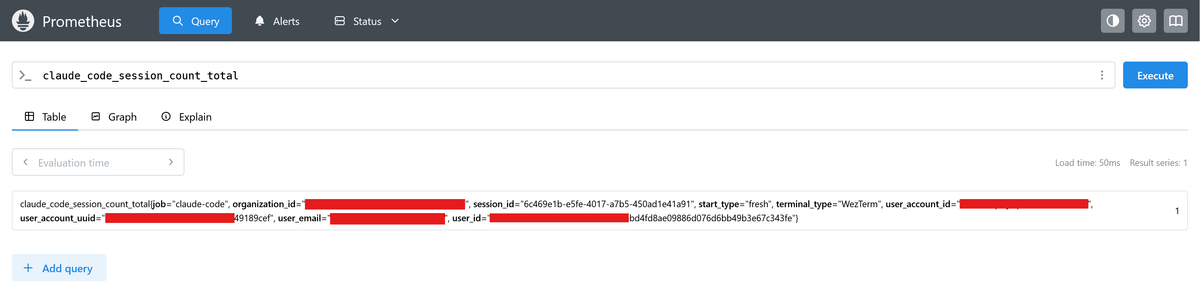
To confirm that Claude Code metrics are being sent to Prometheus, open
http://localhost:9090 and search for metrics beginning with claude_code_.
Claude Code emits OpenTelemetry metric names such as:
1claude_code.session.count
When Prometheus ingests OpenTelemetry metrics,
it normalizes those names
to follow Prometheus naming conventions so that dots are replaced with
underscores, and counters can receive a _total suffix.
As a result, the Claude Code session counter appears in Prometheus as:
1claude_code_session_count_total
You should see this and other claude_code_* series after using Claude Code for
a short period.
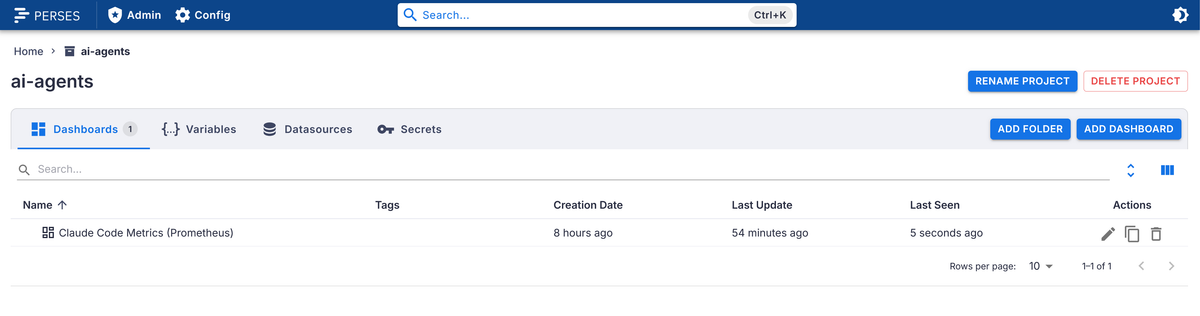
Once Claude Code has generated some activity, the provisioned Perses dashboard gives you a ready-made view of its usage without requiring you to write any PromQL.
Navigate to http://localhost:8080/projects/ai-agents, then select the Claude
Code Metrics (Prometheus) dashboard.
The dashboard shows the main signals you'd expect to monitor at a glance, including session activity, token consumption, estimated cost, active time, code changes, commits, model usage, and tool activity.
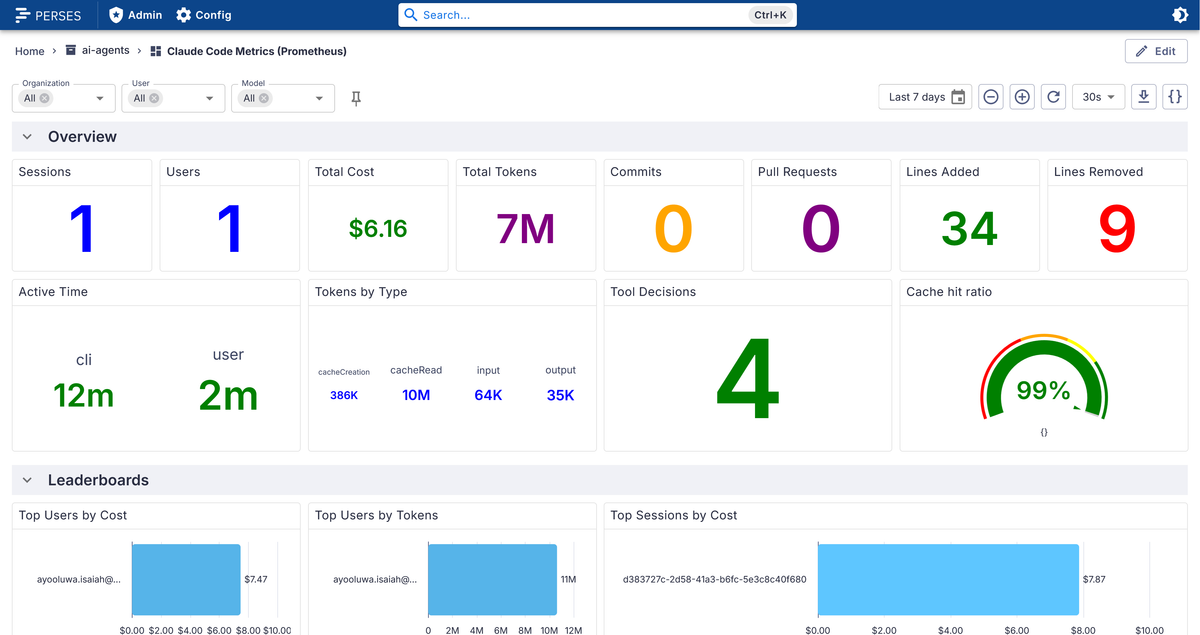
It also helps you spot broader patterns, such as which models account for the most tokens and cost, how usage changes over time, and which tools Claude Code invokes most often.
Inspecting Claude Code logs in OpenSearch
To inspect Claude Code logs, open OpenSearch Dashboards at:
1http://localhost:5601
This lands you on the Discover view, pre-configured with a saved search over
the otel-logs index and sorted by time (most recent first):
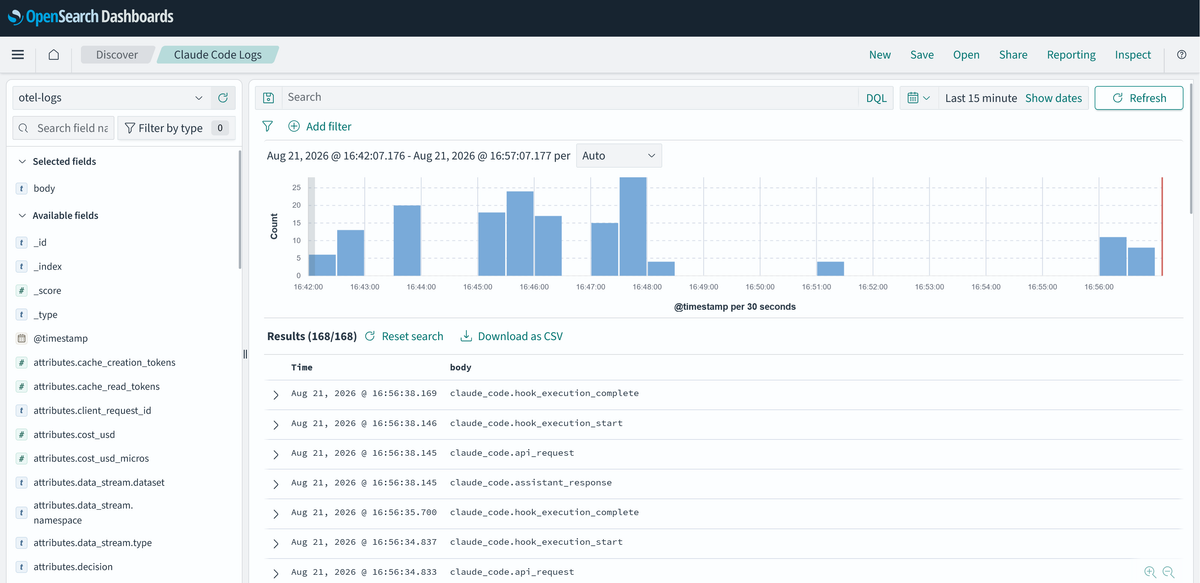
The logs make it easy to follow the activity generated by a Claude Code session. You will see a few recurring record types such as:
claude_code.user_promptrecords the prompt submitted by the user.claude_code.api_requestrecords requests Claude Code makes to the model API.claude_code.tool_decisionrecords decisions around whether and how a tool is allowed to run.claude_code.tool_resultrecords the outcome of a tool invocation.claude_code.assistant_responserecords the response produced by Claude Code.
Together, these records give you a chronological view of the entire session: what the user asked, which models and tools Claude Code called, and what it responded with.
Because the records are structured, you can expand any entry to inspect additional fields such as the session identifier, model, tool details, and other context attached to that operation.
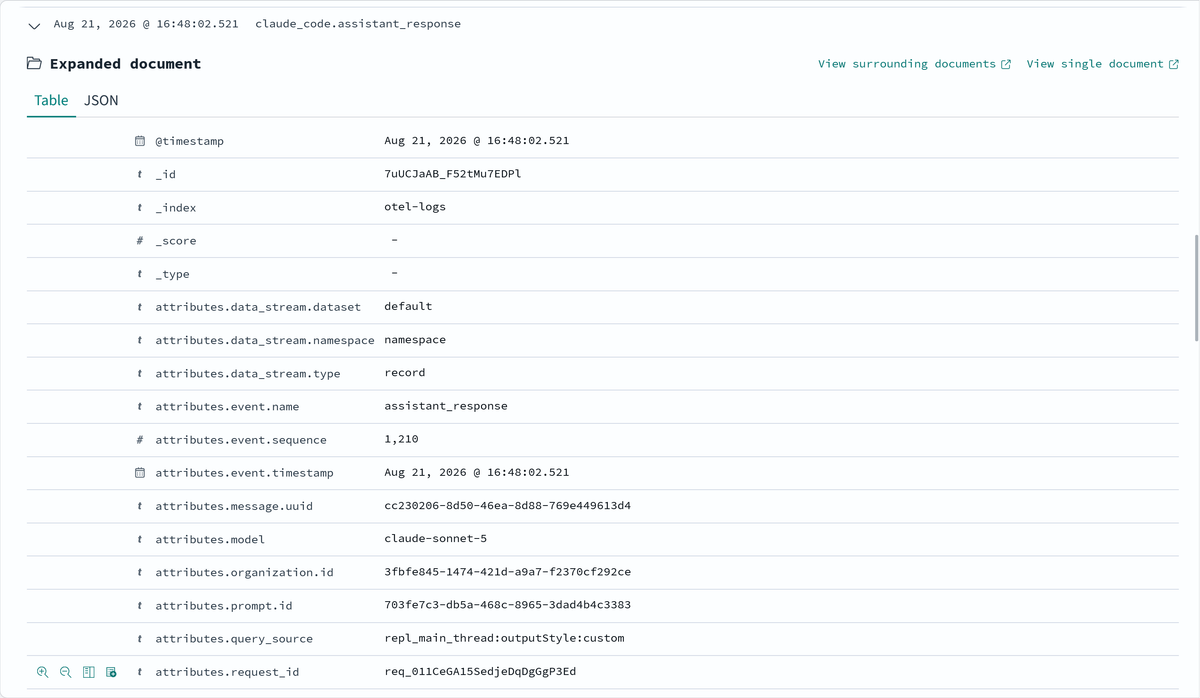
Since you enabled OTEL_LOG_USER_PROMPTS, OTEL_LOG_TOOL_DETAILS, and
OTEL_LOG_TOOL_CONTENT earlier, the records can also contain the prompt text
and additional information about tool calls and their input or output.
Inspecting Claude Code traces in Jaeger
After using Claude Code for a task, open the Jaeger UI at
http://localhost:16686. Select claude-code from the Service menu and
click Find Traces. You should see traces corresponding to your recent Claude
Code interactions.
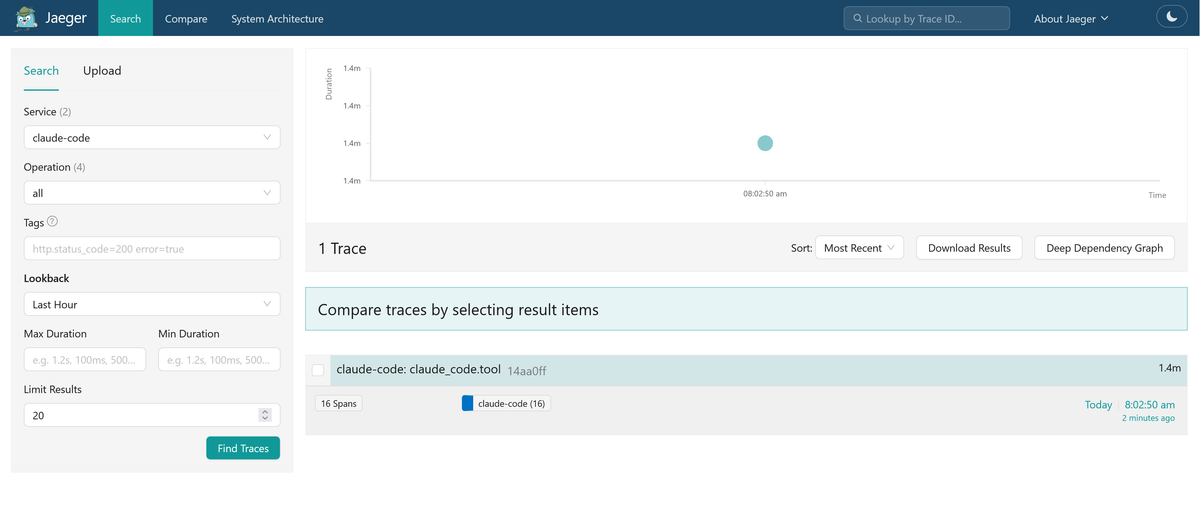
Opening a trace shows how an interaction unfolded over time. The root span represents the overall Claude Code interaction, while child spans show operations such as requests to the model and tools invoked while completing the task.
Claude Code's traces also distinguish between different stages within tool execution. A tool invocation can include child spans for permission handling and the actual execution itself, which helps separate time spent waiting for approval from time spent running the command or tool.
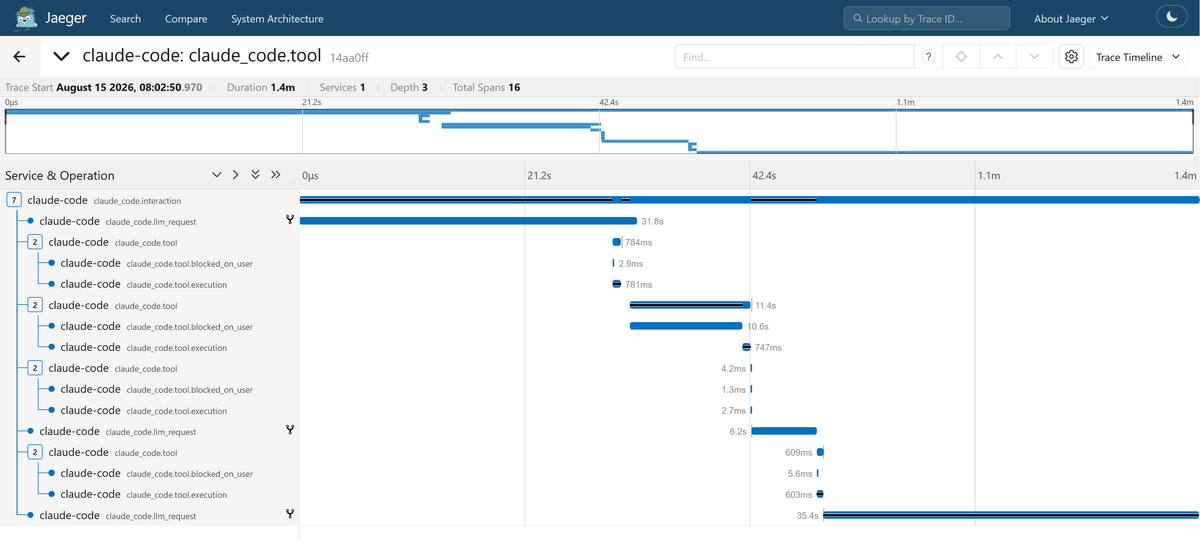
The timeline makes it easy to see the order of those operations and how long each one took. Selecting an individual span also exposes its OpenTelemetry attributes, including additional context about the corresponding model request or tool call.
Troubleshooting missing Claude Code telemetry
If any of the backends remain empty, first determine whether Claude Code is exporting telemetry at all by starting Claude Code with debug logging:
1claude --debug
Claude Code will surface the debug log from the interface, where you can look for OpenTelemetry initialization or export errors.
If Claude Code appears to be exporting successfully, check whether the telemetry
is reaching the OpenTelemetry Collector. The repository configures the
Collector's debug exporter for metrics, logs, and traces, so you can follow
its output with:
1docker compose logs -f otelcol
If the expected telemetry appears there, the problem is likely between the Collector and the corresponding backend so you must check the service logs to find out the root cause.
Also remember that OpenTelemetry configuration is read when Claude Code starts. Changing environment variables in your shell will not affect an already running Claude Code process, so restart it after modifying the telemetry configuration.
Sending Claude Code telemetry to Dash0
The local observability stack works well for personal monitoring, but each machine produces an isolated view of Claude Code activity. If you want to monitor usage across multiple machines or a team, you need a central backend that can collect and query metrics, logs, and traces from all of those environments.
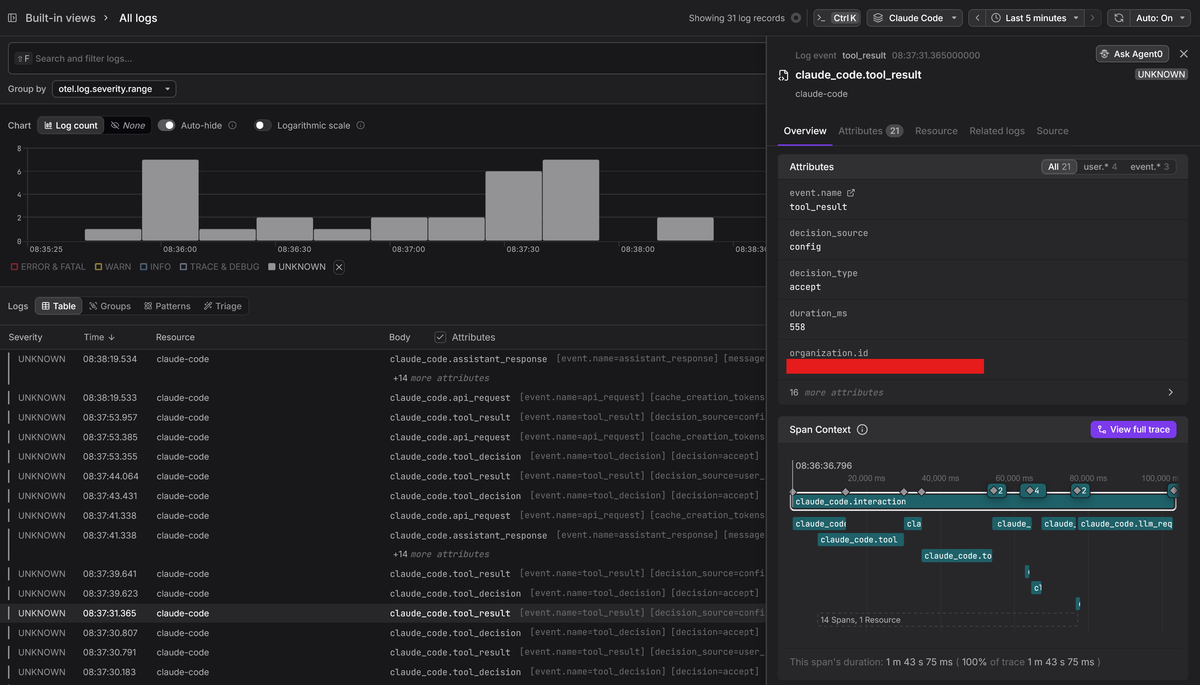
Dash0 works well here because it's OpenTelemetry-native and accepts metrics, logs, and traces directly over OTLP without any translation. You can therefore keep the same Claude Code instrumentation and Collector-based pipeline while adding Dash0 as an exporter.
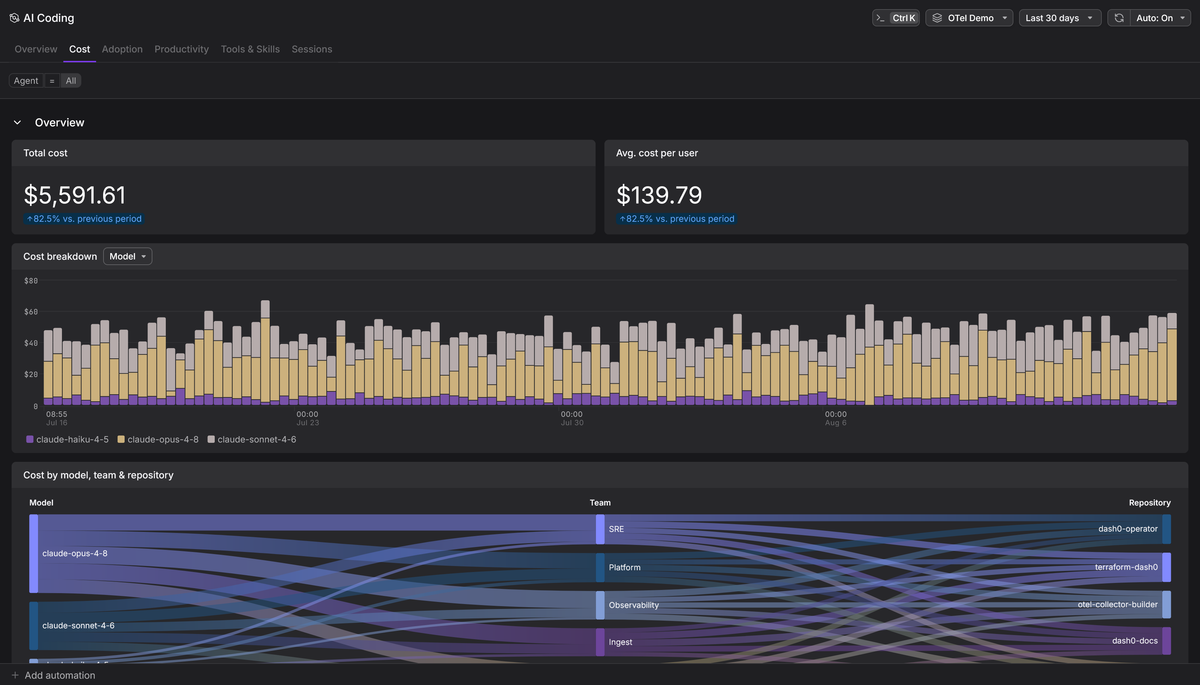
Dash0's AI Coding Insights tracks Claude Code and other AI coding tools across an engineering organization. It collects usage, token-derived cost, productivity indicators, and individual coding sessions in one place, which saves you from stitching together isolated telemetry signals yourself.
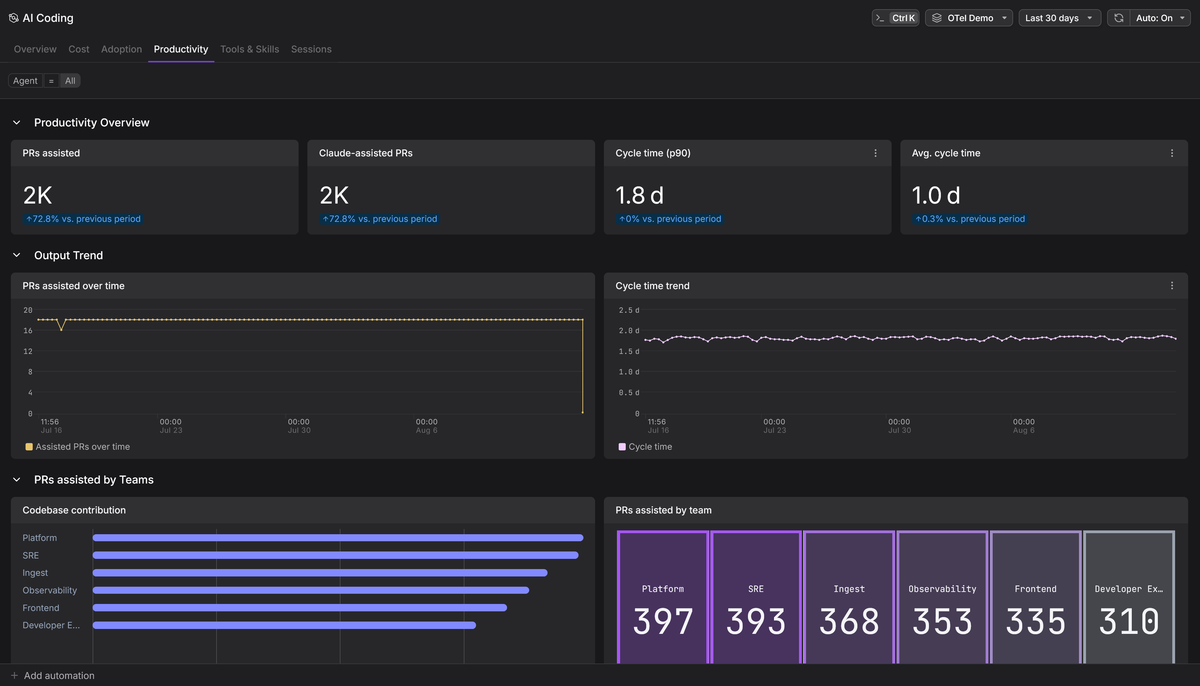
Where it gets interesting is closing the loop between AI-assisted coding activity and the delivery outcome that follows. By correlating coding-agent sessions with GitHub activity, Dash0 can connect the work Claude Code performs to commits, pull requests, and ultimately merged PRs.
That makes it possible to answer questions that raw metrics, logs, and traces alone cannot answer easily, such as whether increased AI coding activity is resulting in more completed work, and how long it takes agent-assisted changes to be merged.
The goal goes further than observing what Claude Code did. You want to follow that activity through to whether the resulting code actually shipped and what
Sending the existing OpenTelemetry data to Dash0
If you want to centralize the metrics, logs, and traces you've already configured in this tutorial, add Dash0 as another exporter in the Collector config.
You'll need to sign up for a Dash0 account, then obtain:
- Your OTLP ingestion endpoint
- An authorization token with ingestion permissions
- The dataset you want to use (or just use
default)
Store those values in your shell rather than writing credentials directly into the Collector configuration:
1234export \DASH0_ENDPOINT="https://ingress.<region>.<cloud>.dash0.com" \DASH0_AUTH_TOKEN="auth_xxxxxxxxxxxxxxxx" \DASH0_DATASET="default"
Then expose them to the Collector by adding the following environment variables
to the otelcol service in docker-compose.yml:
12345678910111213141516# docker-compose.ymlservices:otelcol:image: otel/opentelemetry-collector-contrib:0.158.0container_name: otelcolvolumes:- ./otelcol.yaml:/etc/otelcol-contrib/config.yamlrestart: unless-stoppedports:- 4317:4317environment:DASH0_ENDPOINT: ${DASH0_ENDPOINT}DASH0_AUTH_TOKEN: ${DASH0_AUTH_TOKEN}DASH0_DATASET: ${DASH0_DATASET}# [...]
Next, add an
OTLP/HTTP exporter
for Dash0 to otelcol.yaml:
1234567# otelcol.yamlexporters:otlp_http/dash0:endpoint: ${env:DASH0_ENDPOINT}headers:Authorization: Bearer ${env:DASH0_AUTH_TOKEN}Dash0-Dataset: ${env:DASH0_DATASET}
Keep the existing local exporters and add otlp_http/dash0 to all three
pipelines:
123456789101112# otelcol.yamlservice:pipelines:traces:receivers: [otlp]exporters: [debug, otlp_grpc/jaeger, otlp_http/dash0]logs/claude:receivers: [otlp]exporters: [debug, otlp_grpc/data_prepper, otlp_http/dash0]metrics/claude:receivers: [otlp]exporters: [debug, otlp_http/prometheus, otlp_http/dash0]
Restart the Collector so it picks up the new configuration:
1docker compose up -d --force-recreate otelcol
Use Claude Code again to generate fresh telemetry. You can then inspect the same metrics, logs, and traces in Dash0 while continuing to use the local stack (or remove it if no longer needed).
Adding the Dash0 plugin for AI Coding Insights
Sending Claude Code's native telemetry to Dash0 is enough when you want centralized access to the same metrics, logs, and traces you've already seen locally.
If you want to use the full AI Coding Insights experience, install the Dash0 Claude Code plugin as well. Dash0 recommends the plugin because it captures the richer agent activity required for session and tools views, including LLM interactions, tool executions, token usage, cost, and errors as OpenTelemetry traces. The emitted spans follow the OpenTelemetry GenAI semantic conventions.
You can install it directly within Claude Code:
1/plugin install dash0@claude-plugins-official
You also need to configure it through the Claude settings file as follows:
1234567891011{"pluginConfigs": {"dash0@claude-plugins-official": {"options": {"OTLP_URL": "https://ingress.<region>.aws.dash0.com","AUTH_TOKEN": "your-dash0-auth-token","DATASET": "default"}}}}
Note: If you also use Claude Desktop and want to track sessions from that
interface,
configure via the .local.md file instead.
Once configured, the plugin sends the additional OpenTelemetry data needed to explore individual coding sessions, tool usage, MCP activity, prompts, and other agent-specific context.
The final piece is the GitHub integration which allows Dash0 to correlate agent sessions with pull requests so that AI Coding Insights can measure whether agent-assisted work actually moves through the software delivery process. You can follow these instructions to set it up.
That shifts the focus from the cost of individual prompts to whether greater AI adoption is translating into more merged code.
Final thoughts
Claude Code's OpenTelemetry support makes its activity observable using the same signals and tooling you already use for applications and infrastructure. Metrics show aggregate usage and cost, logs provide a structured record of prompts and tool activity, and traces reveal how individual interactions unfold across model requests and tool execution which is where you'll spend most of your debugging time.
For personal use and side projects, a local stack is often enough to inspect those signals. But across multiple machines or a team, centralizing the telemetry makes it possible to query usage consistently and compare activity across environments.
The more interesting step is connecting that telemetry to the rest of the software delivery process. Claude Code activity is useful on its own, but it becomes much more meaningful when you can relate an agent session to the commits, pull requests, deployments, and production behavior that follow.
To try it with your own Claude Code telemetry, sign up for a free 14-day trial, and find out more about Claude Code monitoring in their documentation.