Last updated: August 17, 2026
Observing Goose on Ollama with OpenTelemetry
Coding agents are easy to run and hard to evaluate. A session either moved your work forward or burned tokens going in circles, and once you are past a handful of runs, those two look identical. You have a bill, a pile of sessions, and no way to sort one from the other.
Answering that starts with a more basic question: what does a coding agent actually report about itself? So I put one under a microscope. goose driven by open-weight models on Ollama is a good subject, because the entire loop runs on your own machine. Nothing is proxied, summarized, or hidden behind a vendor dashboard, so every span, metric, and log record is there to read.
Getting at them is genuinely easy. goose speaks OpenTelemetry natively, so it takes three environment variables and no code changes. What the telemetry contains is more interesting, let’s dive into it.
Why goose and Ollama
goose is an open source coding agent now hosted under the Agentic AI Foundation. It runs in your terminal, calls tools, edits files, and speaks MCP. Two things make it a good subject: it is provider agnostic, so pointing it at a local model is a config change rather than a fork, and it already links the OpenTelemetry SDK, so no plugin is needed to get telemetry out.
Ollama runs open-weight models on your own hardware behind an OpenAI-compatible API on localhost:11434. goose treats it like any other provider.
Running the pair locally means no API keys, no per-token bill, and nothing leaving your machine, which matters more than usual once you see what the agent puts in its telemetry. The cost is quality. A 30B model on a laptop is not a frontier model, and the gap shows up exactly where it hurts agents most, in reliable tool calling.
Setting up goose with Ollama
1. Install goose
On macOS:
1brew install block-goose-cli
Watch the formula name. The goose formula in homebrew-core is an unrelated Go database migration tool, and the two conflict because both install a goose binary.
goose --version should report 1.46.0, which is what everything below is measured against.
2. Install Ollama and pull a model
Install Ollama from ollama.com, then pull a model. The hard requirement is native tool calling. A model that cannot emit tool calls will flail no matter how good its prose is.
1ollama pull qwen3.6:35b-a3b-q4_K_M
Two that work well:
| Model | Size | Context | Notes |
|---|---|---|---|
qwen3.6:35b-a3b-q4_K_M | 23 GB | 256K | Mixture of experts, roughly 3B active parameters, so it is quick on Apple Silicon despite its size |
devstral-small-2:24b | 15 GB | 384K | Built for tool-driven codebase work, lighter on memory |
ollama list confirms what you have locally.
Keep Ollama on the host. On a Mac, Docker Desktop cannot pass the GPU through to a container, so a containerized Ollama falls back to CPU inference and gets several times slower. Every number in this post comes from Ollama running natively.
3. Connect goose to Ollama
Three environment variables, no config file editing:
123export GOOSE_PROVIDER=ollamaexport GOOSE_MODEL=qwen3.6:35b-a3b-q4_K_Mexport OLLAMA_HOST=localhost:11434
If you would rather persist it, goose configure writes the same settings to ~/.config/goose/config.yaml.
4. Check that it works
1goose run -t "Reply with exactly the word: PONG. Nothing else."
1234__( O)> ● new session · ollama qwen3.6:35b-a3b-q4_K_M\____) 20260810_1 · /tmp/demoL L goose is readyPONG
The header line confirms the provider and model. Get the model name wrong and goose says so plainly, listing what is actually available, which is a nicer failure than most.
Now give it real work:
1goose run -t "Create a Node.js Express app in app.js exposing GET /rolldice that returns a random integer from 1 to 6 as plain text. Also create a package.json with express as a dependency. Do not run npm install."
123456789101112131415161718────────────────────────────────────────▸ writepath ~/dash0/demos/dash0-examples/goose/app.jscontent: const express = require("express");const app = express();const PORT = proce...Created ../goose/package.json (12 lines)Created ../goose/app.js (12 lines)Done. Here's what I created:### `package.json`- Defines the `rolldice` app with a `"start"` script (`node app.js`)- Lists `express: ^4.21.0` as a dependency (no `npm install` run)### `app.js`- Creates an Express server on port 3000 (or `$PORT`)- Exposes **GET /rolldice** which returns a random integer from **1 to 6** as plain text
That is a local coding agent doing local work, with no account anywhere.
Why bother observing it?
Watching one session in a terminal, you barely need telemetry. You can see the agent working and read the files it produced.
That stops being true almost immediately. Agents run headless, in CI, on other people's machines, and across a team. Coding agents also move on three fronts at once: the agent itself, the harness and configuration around it, and the underlying model. Change any one and both your spend and your output shift. Without a common set of signals, you cannot tell which change did what.
Instrumenting the agent gives you the raw material for those comparisons:
- Where does the time go? In the run below, 15.5 of 28.5 seconds sat inside two inference calls. For a local agent, "why is this slow" is nearly always the model, and now you can prove it.
- What does a task cost? 8,694 tokens for two files. That is the number you compare models on.
- Which tools does it reach for, and how often do they fail? Rarely the ones you assume.
- How do two models compare on the same job? This turns "are open models good enough yet" from a debate into a measurement.
The one thing this list does not give you is whether the work was any good. Hold that thought.
Why OpenTelemetry, and how to turn it on
The case for OpenTelemetry here is that goose already speaks it. It links the OpenTelemetry Rust SDK and reads the standard OTEL_* variables at startup, initializing traces, metrics, and logs if it finds an endpoint. No plugin, no wrapper, no code changes.
123export OTEL_EXPORTER_OTLP_ENDPOINT=http://localhost:4318export OTEL_EXPORTER_OTLP_PROTOCOL=http/protobufexport OTEL_SERVICE_NAME=goose
That is the whole integration.
To see what comes out, run a collector with a debug exporter. This config also writes each signal to disk, which is how every table in this post was produced:
123456789101112131415161718192021receivers:otlp:protocols:http:endpoint: 0.0.0.0:4318exporters:debug:verbosity: detailedfile/traces:path: /out/traces.jsonlfile/metrics:path: /out/metrics.jsonlfile/logs:path: /out/logs.jsonlservice:pipelines:traces: { receivers: [otlp], exporters: [debug, file/traces] }metrics: { receivers: [otlp], exporters: [debug, file/metrics] }logs: { receivers: [otlp], exporters: [debug, file/logs] }
123456touch out/traces.jsonl out/metrics.jsonl out/logs.jsonldocker run -d --name goose-collector -p 4318:4318 \-v "$PWD/collector.yaml:/etc/otelcol-contrib/config.yaml" \-v "$PWD/out:/out" \otel/opentelemetry-collector-contrib:0.158.0
Run goose again and spans start arriving.
NB: goose has no gRPC exporter. It is compiled without the
grpc-tonicfeature, so the endpoint has to be OTLP over HTTP on 4318, not 4317. SettingOTEL_EXPORTER_OTLP_PROTOCOL=grpcproduces no spans, no metrics, no logs, and exit status 0, with nothing on the terminal to say so. Leaving the protocol unset is fine, since the spec default is alreadyhttp/protobuf.
GOOSE_TELEMETRY_ENABLEDis not the setting you want. That flag controls goose's own product analytics, which by its own description collects error types and never collects your conversations, code, or tool arguments. It has nothing to do with OTLP export.
What goose 1.46.0 emits
Here is the rolldice run, captured. 28.5 seconds, 2 tool calls, one whole trace.
The resource attributes are clean and conventional:
12345678service.name gooseservice.namespace gooseservice.version 1.46.0host.name Mac.localdomainuser.name kaspernissentelemetry.sdk.language rusttelemetry.sdk.name opentelemetrytelemetry.sdk.version 0.32.1
Traces
Six spans in a single trace, properly nested, each carrying a conventional operation name:
123456reply invoke_agent 63.5 ms└── reply_stream invoke_agent 28,273.5 ms├── stream_response_from_provider chat 14,272.4 ms├── dispatch_tool_call execute_tool 1.2 ms├── dispatch_tool_call execute_tool 0.1 ms└── stream_response_from_provider chat 1,195.8 ms
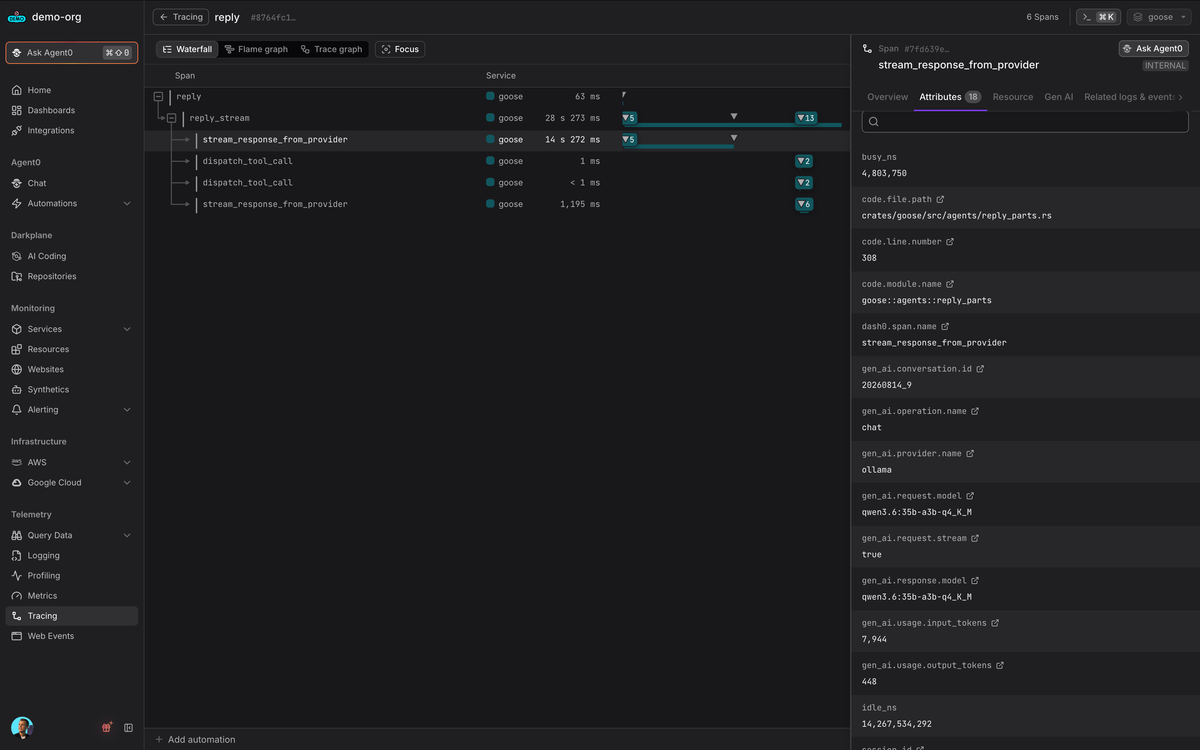 One trace, properly nested. Because the attributes are conventional, the backend renders a dedicated Gen AI view without anyone writing a query.
All three conventional operation names are there: invoke_agent on the agent spans, execute_tool on the tool calls, and chat on the two inference spans. Those inference spans also carry the model and the provider as first-class attributes, rather than buried in a log line.
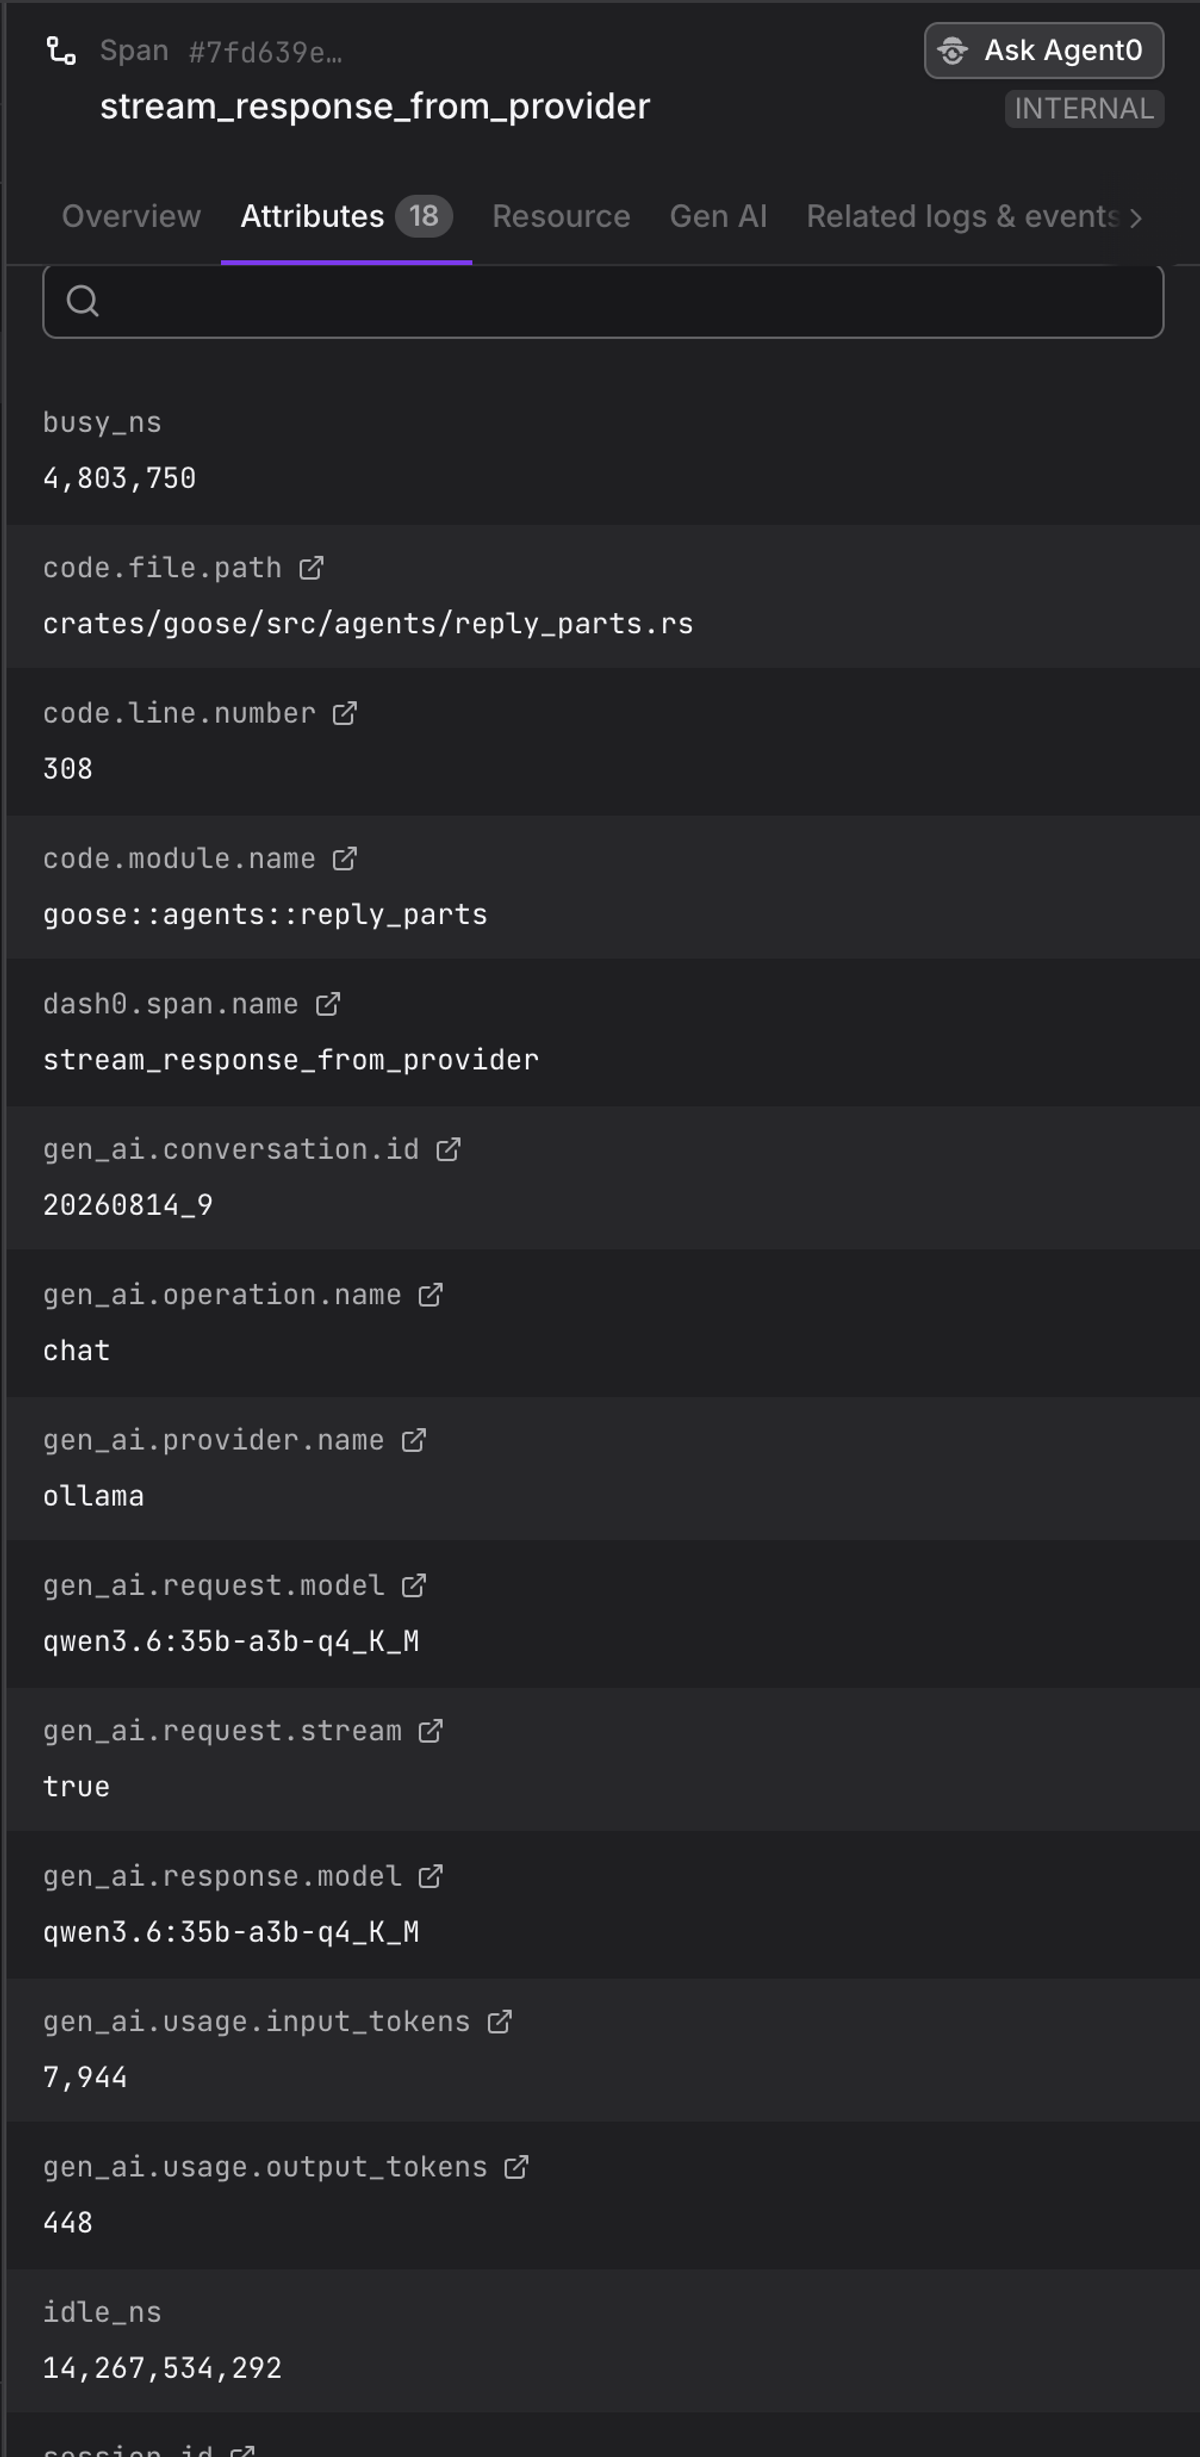 The inference call:
 stream_response_from_provider, tagged gen_ai.operation.name = chat, carrying the provider, the model, and the real per-call token split.
That matters more than tidiness. goose can run different models for different roles through GOOSE_SUBAGENT_MODEL and GOOSE_PLANNER_MODEL, and attributing cost or latency to the model that incurred it needs the model on the span.
Tokens arrive per call, and the input grows as the conversation accumulates:
12stream_response_from_provider 7,944 in / 448 outstream_response_from_provider 8,470 in / 224 out
Tool calls are described through gen_ai.tool.name, gen_ai.tool.call.id, and the session is grouped by gen_ai.conversation.id.
One trap for queries. Both reply and reply_stream are tagged invoke_agent, and both carry the same aggregated token counts, 16,414 in and 672 out. Read the stream_response_from_provider spans instead, the ones tagged chat.
Metrics
The metrics did not move. Seven instruments, every one a monotonic cumulative sum with no unit set, all still custom-named:
1234567goose.session_tokens 8694 message="Session tokens"goose.session_duration_ms 28474 message="Session duration"goose.tool_calls 2 tool_name=writegoose.tool_completions 2 tool_name=write, result=successgoose.session_starts 1 interactive=Falsegoose.session_completions 1 exit_type=normal, duration_ms=28474, total_tokens=8694, message_count=6goose.cli_commands 1 command=run
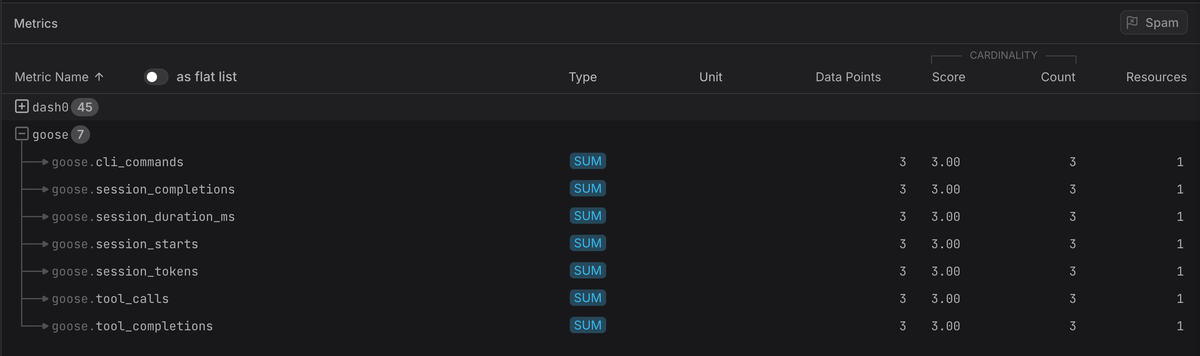 Every instrument a
 SUM, and an entirely empty Unit column.
None of the GenAI metric instruments exist. The conventions specify gen_ai.client.token.usage and gen_ai.client.operation.duration as histograms; goose has sums, so distributions cannot be recovered. There is no p95 inference latency at any price.
Three things break OpenTelemetry's own rules, independent of the GenAI conventions.
- The unit is in the name.
goose.session_duration_msshould be a duration with a unit of seconds, as the metric naming guidance spells out. messageis a description, not a dimension. Every metric carries one, holding text like"Session tokens". That belongs in the instrument description.goose.session_completionsputs measurements in attributes.duration_ms,total_tokens, andmessage_countare values, not dimensions. As attributes they have unbounded cardinality, so every session creates its own time series.
There is a fourth thing, and it will cost you money if you trust it. goose.session_tokens is not the session total. It reported 8,694 for this run. The two inference calls actually consumed 7,944 + 448 + 8,470 + 224 = 17,086 tokens. The metric matches the last call exactly, because each call resends the growing conversation, so what it really measures is final context size. Useful for context-budget work, wrong for spend.
Logs, emitted twice
Ten records, all INFO, with bodies like Tool call started and Session completed.
Look at their attributes and you find keys named monotonic_counter.goose.session_tokens and monotonic_counter.goose.tool_calls. goose produces its metrics through the Rust tracing crate's metrics-via-logs convention, and the logs pipeline exports those same events again as log records. Every counter increment is billed twice, once as a data point and once as a log record, for no added information.
None of the ten records carry a trace ID, so there is still no log-to-trace correlation.
Where it still diverges
The attribute story is nearly complete. Four things are not.
Span names are internal. The convention asks for {operation} {target}, so chat qwen3.6:35b-a3b-q4_K_M and execute_tool write. goose keeps stream_response_from_provider and dispatch_tool_call and layers the attributes on top.
Span kind is Internal everywhere, including the stream_response_from_provider spans that wrap an HTTP call to Ollama. Those are Client spans on their own terms, before any GenAI convention applies.
gen_ai.agent.name is absent, and agent-aware tooling keys off it.
The metrics are untouched, as above.
If you are still on 1.45.0, none of this applies, because none of it is there. The GenAI work merged in #10700 and #10816 and shipped in 1.46.0 on 2026-08-12. On 1.45.0 the string gen_ai does not appear in the binary at all, the trace arrives as two unrelated fragments, and the model name is recorded once, inside a log body. Upgrade rather than work around it.
Message content is opt-in, and the gate leaks
1.46.0 puts message content behind an opt-in, using the variable the conventions themselves suggest:
1export OTEL_INSTRUMENTATION_GENAI_CAPTURE_MESSAGE_CONTENT=true
It defaults to off, and there is a test in the codebase named content_capture_requires_explicit_opt_in. One detail worth knowing: it accepts only the literal string true, compared case-insensitively. 1 silently does nothing, which will catch anyone who reaches for =1 out of habit.
Turn it on and the conversation arrives properly structured, prompt and response side by side:
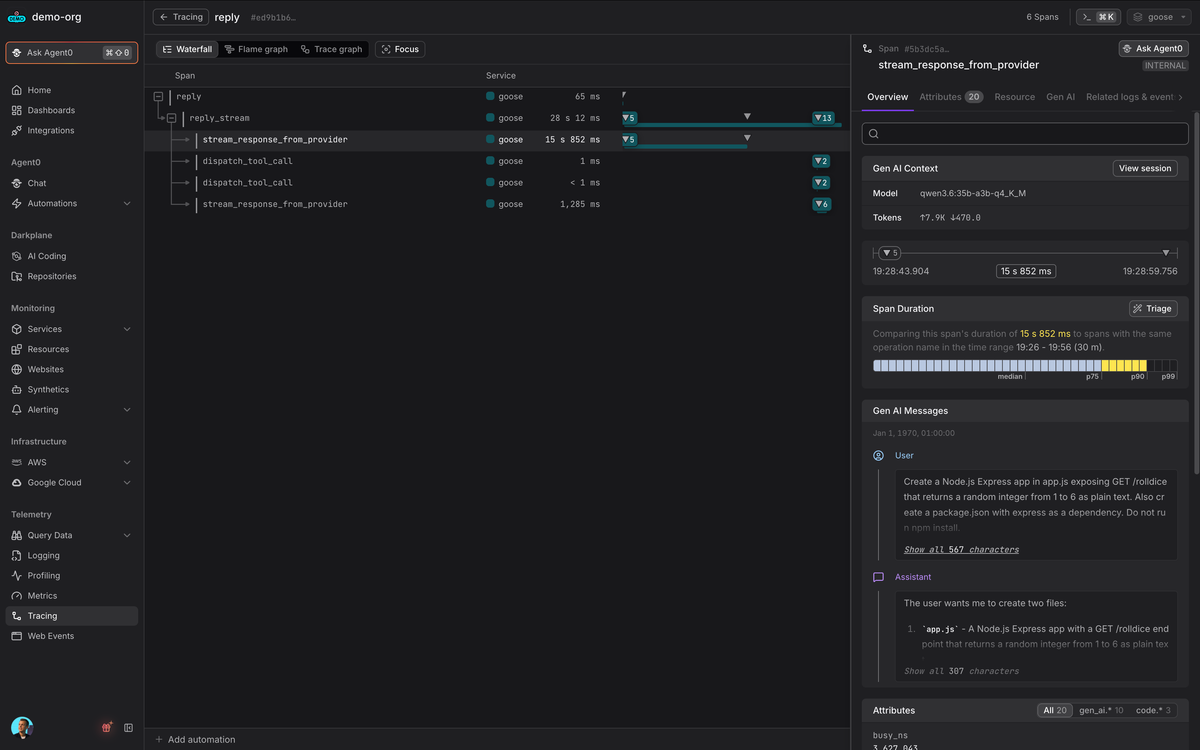 With capture enabled,
 gen_ai.input.messages and gen_ai.output.messages populate a readable conversation view.
This is the right shape. Content sits behind a flag, under the conventional attribute names, which is what redaction features and shared collector configs know to look for.
Now run the same task twice, once with the gate at its default and once enabled, and compare what is actually on the wire:
| Attribute | Capture off | Capture on |
|---|---|---|
gen_ai.input.messages | absent | present |
gen_ai.output.messages | absent | present |
gen_ai.tool.call.arguments | absent | present |
gen_ai.tool.call.result | absent | present |
output | absent | present |
user_message | present | present |
trace_input | present | present |
input | present | present |
The conventional attributes obey the flag exactly. Three legacy attributes ignore it.
With capture off, this still leaves the machine:
1234[span=reply] user_message: Create a Node.js Express app in app.js exposing GET /rolldice ...[span=reply] trace_input: Create a Node.js Express app in app.js exposing GET /rolldice ...[span=dispatch_tool_call] input: {"tool":"write","arguments":{"path":".../app.js","content":"const express = require(\"express\");\n..."}}
The full prompt, twice, and the complete contents of every file the agent writes.
This shipped. goose 1.46.0 advertises opt-in message capture, and with capture at its default the prompt and the file contents go out anyway. It looks like the legacy attributes were kept for backward compatibility without the gate being extended to cover them, which is easy to miss in review. I have reported it upstream.
Until it is fixed, strip them at the collector. Three lines:
123456processors:transform:trace_statements:- delete_key(span.attributes, "trace_input")- delete_key(span.attributes, "user_message")- delete_key(span.attributes, "input")
Sending it somewhere permanent
A file of JSONL is fine for investigation, not for keeping. The same variables that pointed at a local collector point at a hosted endpoint. Using Dash0, because that is what I had running:
1234export OTEL_EXPORTER_OTLP_ENDPOINT="https://ingress.eu-west-1.aws.dash0.com"export OTEL_EXPORTER_OTLP_PROTOCOL="http/protobuf"export OTEL_EXPORTER_OTLP_HEADERS="Authorization=Bearer%20${DASH0_AUTH_TOKEN},Dash0-Dataset=goose"export OTEL_SERVICE_NAME="goose"
The %20 is the percent-encoded space in Bearer <token>. goose decodes it correctly and appends /v1/traces, /v1/metrics, and /v1/logs itself, so leave the path off. Note this is the HTTPS ingress on 443, not the gRPC endpoint.
One trick worth knowing for comparing runs. gen_ai.request.model tells you which model served a call, but it lives on spans, not on metrics, so comparing sessions by model still means tagging them yourself. goose honors OTEL_RESOURCE_ATTRIBUTES on all three signals, so you can tag runs yourself and compare them:
1export OTEL_RESOURCE_ATTRIBUTES="demo.model=qwen3.6-35b-a3b,demo.run=1"
Every comparison in this post was produced that way.
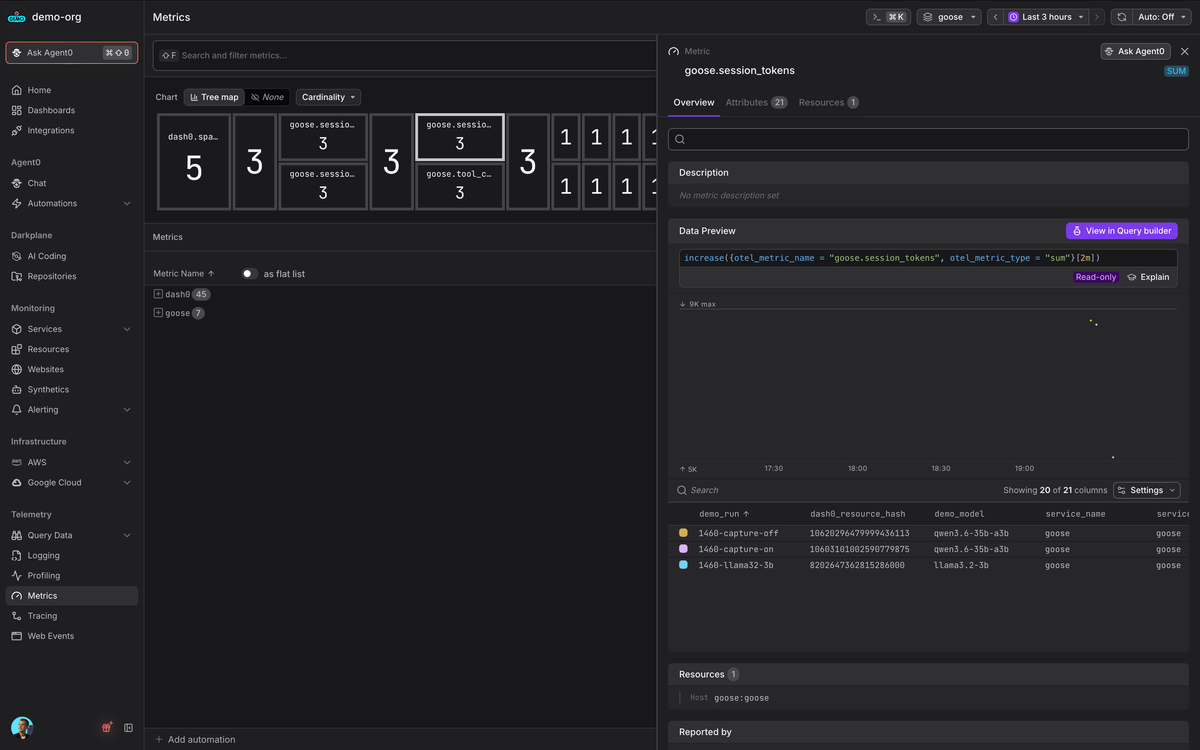
goose.session_tokens split by demo_run. Three runs, each separable: the same task with content capture off and on, and the small model that failed.
The run that failed and said it succeeded
Back to where I started.
I ran the identical task on llama3.2:3b, a much smaller model. It asked for two files and produced one, missing its app.listen() call, so the server never starts. The second write degenerated into malformed JSON and unicode garbage, and package.json was never created. Half the task silently dropped.
Here is what goose reported:
1234goose.tool_calls{tool_name="write"} 1goose.tool_completions{tool_name="write", result="success"} 1goose.session_completions{exit_type="normal"} 1process exit code 0
All five spans carry status UNSET. Not one error, anywhere. And note the trap: the tool call that did happen genuinely succeeded. The file got written. It was just wrong, and the half that failed never registered as an attempt at all.
So result=success means the tool returned without raising, not that it did anything useful. exit_type=normal means the session ended without crashing, not that the task was accomplished. I had assumed tool failure rate would be a decent proxy for whether a model is competent at agentic work. It is not.
You could object that I was sitting right there and could see one broken file. True, and irrelevant the moment nobody is watching: headless runs, CI, a team reading dashboards instead of terminals. There, these are the signals you have.
The only hints were indirect: 5,064 tokens against 8,694 for the same task, 4 messages against 6, 16.0 seconds against 28.5. The model gave up early. That is an anomaly signal, not a correctness signal, and it means nothing without a known-good baseline.
Which points at where this has to end up. Tool-level signals tell you the agent ran. Whether it delivered is a question about outcomes: did the branch merge, did the tests pass, did the change survive review. Those live outside the agent, and joining them to the session is the only way to separate a run that moved work forward from one that burned the same tokens for nothing.
Final thoughts
goose answers real questions for the price of three environment variables, and 1.46.0 brings the GenAI conventions far enough that a backend can read its traces without help. Two things it does not touch are the metrics, which stay custom-named and unit-less, and log-to-trace correlation, which still does not exist.
None of those is the one that matters most, which is telling a successful run from a confidently wrong one. That is not goose's problem to solve, and it is the one worth designing around, because an agent that fails loudly is easy and an agent that fails quietly is expensive.
So instrument the outcome, not just the agent. Start with a task you can verify independently, then check whether the telemetry agrees with reality.
Useful next steps:
- The goose documentation and repository
- The GenAI semantic conventions, now in their own repository
- The OpenTelemetry Collector docs, particularly the
debugandfileexporters - Observing vLLM with OpenTelemetry, which covers the inference layer underneath an agent
On the outcome question, this is the direction we have been building in at Dash0. AI Coding Insights reads coding-agent telemetry into cost, adoption, productivity, and quality views, and joins sessions to branch and pull-request events so cycle time sits next to spend. It supports Claude Code and Cursor today, both of which already emit the gen_ai.* attributes goose is about to.
That is the same lesson this experiment kept teaching at small scale. Tokens are easy to count. Whether they delivered anything is the part worth measuring.