Last updated: July 16, 2026
OpenTelemetry-Native Logging in Go with otelslog
Go's log/slog package
gives you structured logging out of the box, but the records it produces are
disconnected from the rest of your observability stack. A JSON line printed to the stdout
doesn't know which trace it belongs to, which span triggered it, or what
resource emitted it.
The otelslog bridge turns slog into an OpenTelemetry-native log source. It implements slog.Handler, so your existing logging calls don't change, but under the hood every record flows through the OTel Logs SDK alongside your traces and metrics, with trace context, resource attributes, and semantic severity attached automatically.
This guide walks through the full setup: initializing the OTel Logs SDK, wiring up the bridge, correlating logs with traces, replacing span events, exporting via the OpenTelemetry Protocol (OTLP), and configuring the Collector to receive everything on the other end.
Prerequisites
You'll need Go 1.21 or later (for log/slog). The early sections use console
exporters so you can follow along without any external infrastructure. Later,
when we move to OTLP, you'll want either an OpenTelemetry Collector or an
OTLP-compatible backend to receive the telemetry.
The examples in this guide use the OTLP HTTP exporter, but the gRPC variant works the same way. You can find the complete source code on GitHub.
How the otelslog bridge works
The traditional slog setup writes formatted JSON or text to an io.Writer like
os.Stderr. When you swap in the otelslog handler, the flow changes:
- Your application code calls
slog.InfoContext(ctx, ...)exactly as before. - The otelslog
Handlerconverts eachslog.Recordinto an OpenTelemetry LogRecord, mapping timestamps, severity levels, message body, and attributes. - If the
context.Contextyou passed contains an active span, the bridge reads its trace ID and span ID and attaches them to the OTel log record automatically. - The OTel Logs SDK batches the records and hands them off to whatever exporter you've configured (OTLP, stdout, etc.).
Instead of producing JSON that needs to be processed further in the Collector to make them compliant with the OpenTelemetry model, the bridge emits OTel-native log records with typed attributes, proper severity mappings, resource attributes, and trace context baked in from the start.
Setting up the OpenTelemetry Logs SDK
Before the otelslog bridge can do anything useful, you'll need a
LoggerProvider backed by an exporter. To keep things easy to test, we'll start
with the
stdoutlog exporter
so you can see OTel log records printed directly to stdout. Later sections cover
swapping this out for OTLP when you're ready to send data to a Collector or
backend.
12345678910111213141516171819202122232425262728293031// otel.gopackage mainimport ("context""fmt""go.opentelemetry.io/otel/exporters/stdout/stdoutlog"sdklog "go.opentelemetry.io/otel/sdk/log""go.opentelemetry.io/otel/sdk/resource")func newLoggerProvider(ctx context.Context, res *resource.Resource,) (*sdklog.LoggerProvider, error) {exporter, err := stdoutlog.New()if err != nil {return nil, fmt.Errorf("creating stdout log exporter: %w", err,)}provider := sdklog.NewLoggerProvider(sdklog.WithProcessor(sdklog.NewSimpleProcessor(exporter),),sdklog.WithResource(res),)return provider, nil}
We're using NewSimpleProcessor() here instead of NewBatchProcessor() so that
every log record flushes to the console immediately. In production, you'll want
to switch to NewBatchProcessor() with an OTLP exporter to buffer records and
avoid per-log-entry network round trips.
Wiring up the otelslog bridge
Once you've got the provider, register it globally so that the otelslog bridge
(and any other OTel log bridges) can find and use it.
The first thing to do is create a shared OpenTelemetry Resource that your OTel providers will use, so that all your telemetry carry identical service metadata. Then you create the log provider, register it globally, and wire slog to use the otelslog bridge as its default handler:
1234567891011121314151617181920212223242526272829303132333435363738394041424344454647484950515253545556// main.gopackage mainimport ("context""log/slog""os""go.opentelemetry.io/otel/log/global""go.opentelemetry.io/otel/sdk/resource"semconv "go.opentelemetry.io/otel/semconv/v1.40.0""go.opentelemetry.io/contrib/bridges/otelslog")func main() {ctx := context.Background()res, err := resource.New(ctx,resource.WithAttributes(semconv.ServiceName("my-service"),semconv.ServiceVersion("0.1.0"),),)if err != nil {slog.Error("creating resource",slog.String("error", err.Error()),)os.Exit(1)}provider, err := newLoggerProvider(ctx, res)if err != nil {slog.Error("creating log provider",slog.String("error", err.Error()),)os.Exit(1)}defer func() {if err := provider.Shutdown(ctx); err != nil {slog.Error("shutting down log provider",slog.String("error", err.Error()),)}}()global.SetLoggerProvider(provider)logger := otelslog.NewLogger("my-service",otelslog.WithLoggerProvider(provider),)slog.SetDefault(logger)slog.Info("app started")}
The first argument to NewLogger() is an instrumentation scope name that
identifies the source of the telemetry. Using your service name or package path
is a reasonable default.
After calling slog.SetDefault(), every logging call throughout your
application will flow through the OTel pipeline. You don't need to change any
existing logging call sites.
If you want to pass the provider explicitly, use the WithLoggerProvider()
option as shown above. If you omit it, the bridge falls back to whatever
provider was registered with global.SetLoggerProvider().
You'll also want to defer a clean shutdown so that any buffered log records get
flushed before the process exits. Since we're using NewSimpleProcessor(),
records are exported synchronously on every call, so there's nothing sitting in
a buffer to lose.
But the shutdown habit is worth building now because you'll switch to NewBatchProcessor when you move to OTLP, and at that point a missing shutdown call means the last batch of records silently disappears.
Seeing the console output
Make sure you've run go mod tidy to pull in the dependencies, then run the
program:
1go run main.go otel.go
The slog.Info("app started") call produces an OTel log record that the console
exporter prints to stdout. It won't look like the familiar JSON you'd get from
slog.NewJSONHandler(). Instead, you'll see something like this:
12345678910111213141516171819202122232425262728293031323334353637{"Timestamp": "2026-04-22T05:28:38.3772913+01:00","ObservedTimestamp": "2026-04-22T05:28:38.37729874+01:00","Severity": 9,"SeverityText": "INFO","Body": {"Type": "String","Value": "app started"},"Attributes": [],"TraceID": "00000000000000000000000000000000","SpanID": "0000000000000000","TraceFlags": "00","Resource": [{"Key": "service.name","Value": {"Type": "STRING","Value": "my-service"}},{"Key": "service.version","Value": {"Type": "STRING","Value": "0.1.0"}}],"Scope": {"Name": "my-service","Version": "","SchemaURL": "","Attributes": {}},"DroppedAttributes": 0}
When the bridge converts a slog.Record into an OTel log record, it maps the
fields as follows:
- The time field becomes the OTel record's
Timestamp. - The message becomes the record
Bodyas a string value. - The level is translated to the corresponding OTel severity scale using a static offset. If you've defined custom slog levels (which are just integers), they'll map to the nearest OTel severity by the same offset arithmetic.
- Slog attributes are converted to OTel log attributes with type-appropriate mappings: booleans stay booleans, strings stay strings, int64 and float64 pass through directly, durations become int64 nanoseconds, and grouped attributes become OTel map values.
- The source location (if present) is dropped, though you can enable it with the
otelslog.WithSource()option.
The Resource section carries the service.name and service.version you
configured on the LoggerProvider, and the Scope reflects the instrumentation
scope name you passed to otelslog.NewLogger().
This JSON is the stdoutlog exporter's debug representation of an OTel
LogRecord. When you switch to the OTLP exporter later, the log data gets
serialized into the actual OTLP wire format and sent to your Collector instance
or backend.
To learn more about why OTLP matters and how it fits into the broader observability picture, see our guide to the OpenTelemetry Protocol.
Setting up log-trace correlation
When the otelslog bridge is set up with an active tracer, your logs
automatically carry the trace ID and span ID from whatever span is active. Your
backend can then navigate from a trace waterfall directly to the logs emitted
during that span, and back again.
In the previous section, the TraceID and SpanID fields are all zeros because
there was no active span when we called slog.Info(). That's about to change.
For this to work, you need two things:
- An active span in the
context.Context. - A call to one of slog's context-accepting methods.
Adding a TracerProvider
Before you can create spans, you'll need a TracerProvider. Here's a minimal
setup using the stdouttrace exporter so you can see both the spans and the
correlated logs in your terminal:
1234567891011121314151617181920212223242526272829// otel.goimport ("go.opentelemetry.io/otel""go.opentelemetry.io/otel/exporters/stdout/stdouttrace""go.opentelemetry.io/otel/sdk/resource"sdktrace "go.opentelemetry.io/otel/sdk/trace")// ...func newTracerProvider(ctx context.Context, res *resource.Resource,) (*sdktrace.TracerProvider, error) {exporter, err := stdouttrace.New(stdouttrace.WithPrettyPrint(),)if err != nil {return nil, fmt.Errorf("creating stdout trace exporter: %w", err,)}tp := sdktrace.NewTracerProvider(sdktrace.WithSyncer(exporter),sdktrace.WithResource(res),)return tp, nil}
Wire it up in main() alongside the LoggerProvider you already have. Both
providers should share the same resource.Resource so that your logs and traces
carry identical service metadata:
123456789101112131415tp, err := newTracerProvider(ctx, res)if err != nil {slog.Error("creating tracer provider",slog.String("error", err.Error()),)os.Exit(1)}defer func() {if err := tp.Shutdown(ctx); err != nil {slog.Error("shutting down tracer provider",slog.String("error", err.Error()),)}}()otel.SetTracerProvider(tp)
At this stage, you're ready to create spans and see how the bridge automatically threads trace context into your log records.
Logging within an active span
When you create a span and pass the context to slog's Context methods, the
otelslog bridge picks up the trace and span IDs automatically:
123456789101112131415161718// main.gofunc handleOrder(ctx context.Context, orderID string) {tracer := otel.Tracer("my-service")ctx, span := tracer.Start(ctx, "handleOrder")defer span.End()// These log records will carry the span's trace ID// and span ID automatically.slog.InfoContext(ctx, "processing order",slog.String("order_id", orderID),)// ... do work ...slog.InfoContext(ctx, "order completed",slog.String("order_id", orderID),)}
When you call handleOrder() from main(), you'll see that both records in the
function now show populated trace context instead of zeros:
12345678910111213141516171819202122232425262728293031323334{"Timestamp": "2026-04-22T06:07:10.929737Z","Severity": 9,"SeverityText": "INFO","Body": {"Type": "String","Value": "processing order"},"Attributes": [{ "Key": "order_id", "Value": { "Type": "String", "Value": "1234" } }],"TraceID": "2928cdc6cd6276c169fd7bd564f4f6df","SpanID": "654f67a3ef556ba2","TraceFlags": "01","Resource": [{ "Key": "service.name", "Value": { "Type": "STRING", "Value": "my-service" } }],"Scope": { "Name": "my-service" }}{"Timestamp": "2026-04-22T06:07:10.929754Z","Severity": 9,"SeverityText": "INFO","Body": {"Type": "String","Value": "order completed"},"Attributes": [{ "Key": "order_id", "Value": { "Type": "String", "Value": "1234" } }],"TraceID": "2928cdc6cd6276c169fd7bd564f4f6df","SpanID": "654f67a3ef556ba2","TraceFlags": "01","Resource": [{ "Key": "service.name", "Value": { "Type": "STRING", "Value": "my-service" } }],"Scope": { "Name": "my-service" }}
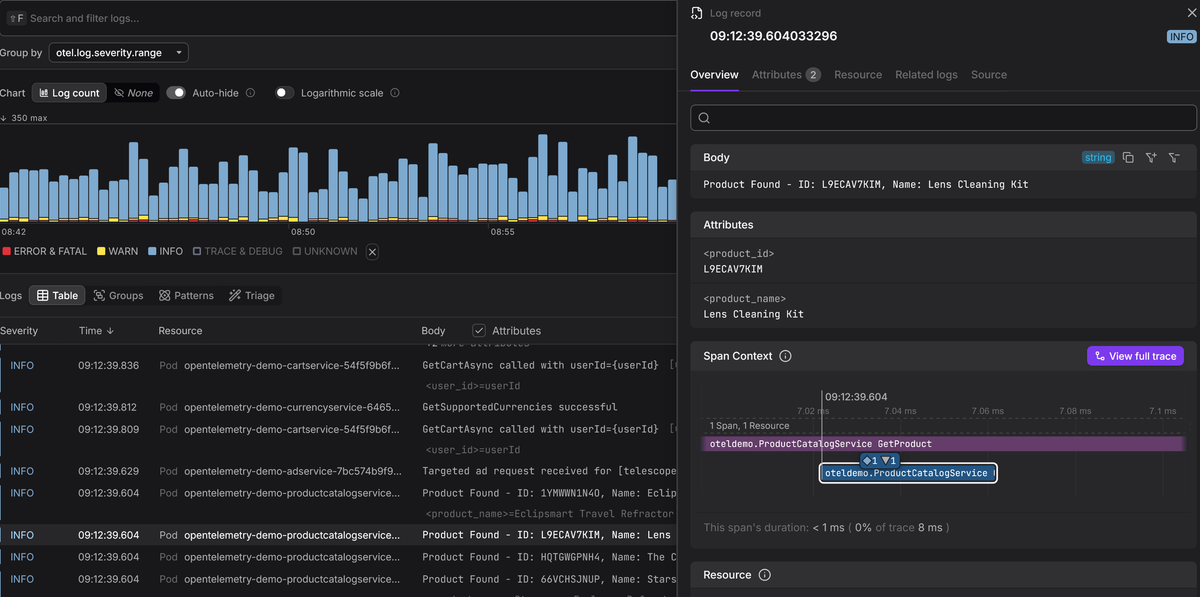
The TraceID and SpanID now match the span that was active when
slog.InfoContext() was called, and this allows your observability backend to
link this log entry to the exact span in the trace waterfall.
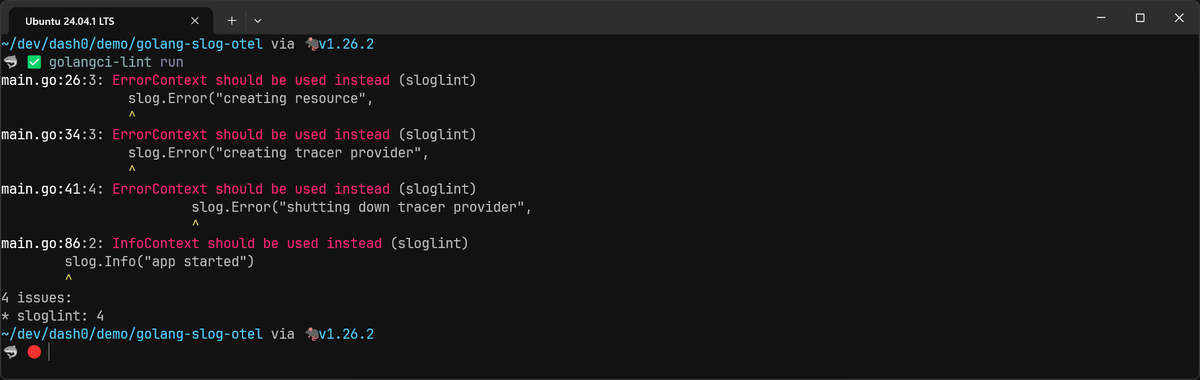
The critical detail is using context-aware methods (like InfoContext() or
ErrorContext()) instead of the plain methods. The bridge inspects the context
to extract the span, and if you call the non-context variants, it has no span to
read from and the log record ships without any trace correlation.
This is a common stumbling block. You might wire up the entire OTel pipeline
correctly and then wonder why your logs aren't correlating with traces, only to
discover that your logging calls are using slog.Info() instead of
slog.InfoContext().
To prevent this, consider enforcing the context-aware style across your codebase
with sloglint. Setting its context
option to all in your golangci-lint configuration will flag any slog call that
doesn't pass a context.Context, catching the problem in development or CI
rather than during an incident.
Replacing span events with slog
If you're familiar with OpenTelemetry's tracing API, you might have come across
span.AddEvent() as a way to attach timestamped annotations to a span. In Go,
it looks something like this:
12345span.AddEvent("cache miss",trace.WithAttributes(attribute.String("key", "user:42"),),)
This worked, but it created an awkward overlap: you had two ways to record things that happened during a span's lifetime, span events via the Tracing API and logs via the Logs API. They carried similar data, but lived in different pipelines with different semantics.
The OpenTelemetry project is
deprecating the Span Event API
to resolve this. The solution is to emit events as logs correlated with the
active span through context, which is exactly what the otelslog bridge already
does.
So if you still want named events, the correct approach is to emit a log record
with an otel.event.name attribute. Here's how that would look for the logs in
handleOrder():
123456789slog.InfoContext(ctx, "processing order",slog.String("otel.event.name", "order.processing"),slog.String("order_id", orderID),)slog.InfoContext(ctx, "order completed",slog.String("otel.event.name", "order.completed"),slog.String("order_id", orderID),)
The log message provides human-readable context while otel.event.name gives
backends a stable, queryable identifier for the event type — the same role a
span event name serves, but on an API that isn't being deprecated.
The result is the same from an observability standpoint: a timestamped record attached to the current span via its trace and span IDs. But the log-based approach is more flexible because the record flows through the Logs SDK pipeline, where it can be filtered, enriched, batched, and exported independently of the span that produced it.
If you have existing code that uses span.AddEvent(), there's no rush to
migrate. Backends will continue to support span events, and the deprecation is
gradual, not a hard cutoff. For new code, the slog + bridge approach is the
right default.
Moving to OTLP
While the stdout exporters are great for verifying that everything is wired up
correctly, you'll need to swap them out for OTLP exporters and point them at an
OpenTelemetry Collector
when deploying to production.
The change in your Go code is minimal: replace stdoutlog.New() with
otlploghttp.New(ctx) and switch from NewSimpleProcessor() to
NewBatchProcessor() so that records are buffered and flushed in bulk rather
than exported one at a time.
The same pattern applies to the tracer provider: Swap stdouttrace.New() for
otlptracehttp.New(ctx) and use WithBatcher() instead of WithSyncer():
123456789101112131415161718192021222324252627282930313233343536373839404142434445464748495051// otel.gopackage mainimport ("context""fmt""go.opentelemetry.io/otel/exporters/otlp/otlplog/otlploghttp""go.opentelemetry.io/otel/exporters/otlp/otlptrace/otlptracehttp"sdklog "go.opentelemetry.io/otel/sdk/log""go.opentelemetry.io/otel/sdk/resource"sdktrace "go.opentelemetry.io/otel/sdk/trace")func newLoggerProvider(ctx context.Context, res *resource.Resource,) (*sdklog.LoggerProvider, error) {exporter, err := otlploghttp.New(ctx)if err != nil {return nil, fmt.Errorf("creating OTLP log exporter: %w", err,)}provider := sdklog.NewLoggerProvider(sdklog.WithProcessor(sdklog.NewBatchProcessor(exporter),),sdklog.WithResource(res),)return provider, nil}func newTracerProvider(ctx context.Context, res *resource.Resource,) (*sdktrace.TracerProvider, error) {exporter, err := otlptracehttp.New(ctx)if err != nil {return nil, fmt.Errorf("creating OTLP trace exporter: %w", err,)}tp := sdktrace.NewTracerProvider(sdktrace.WithBatcher(exporter),sdktrace.WithResource(res),)return tp, nil}
By default, the OTLP HTTP exporter sends data to localhost:4318, which is the
standard port for an OpenTelemetry Collector's HTTP endpoint. If your Collector
is running elsewhere, you can override this with the
OTEL_EXPORTER_OTLP_ENDPOINT
environment variable
without touching any code.
Configuring the Collector
On the receiving end, you'll need an OpenTelemetry Collector (or a compatible backend) configured to accept OTLP data. Here's a minimal Collector configuration that receives both traces and logs over OTLP and forwards them to Dash0:
123456789101112131415161718192021222324# otelcol.yamlreceivers:otlp:protocols:http:endpoint: 0.0.0.0:4318exporters:otlp_http/dash0:endpoint: https://ingress.eu-west-1.aws.dash0.comheaders:Authorization: Bearer <dash0_bearer_token>Dash0-Dataset: <dash0_dataset>debug:verbosity: detailedservice:pipelines:traces:receivers: [otlp]exporters: [debug, otlp_http/dash0]logs:receivers: [otlp]exporters: [debug, otlp_http/dash0]
The otlp receiver listens on the default HTTP port, which matches the defaults
that the Go SDK exporters connect to. Both the traces and logs pipelines share
the same receiver and exporter but are processed independently.
When you're testing locally, set the OTEL_EXPORTER_OTLP_ENDPOINT environment
variable to http://localhost:4318 so the SDK doesn't try to negotiate TLS
against a plaintext Collector endpoint.
1OTEL_EXPORTER_OTLP_ENDPOINT="http://localhost:4318" go run main.go otel.go
The debug exporter is included here so that you can verify data is flowing through the Collector pipeline before it leaves for your backend. Remove it before deploying to production.
The result of this setup is that your logs and traces arrive at Dash0 as fully correlated OTel signals, with matching trace IDs, shared resource attributes, and semantic convention metadata intact.
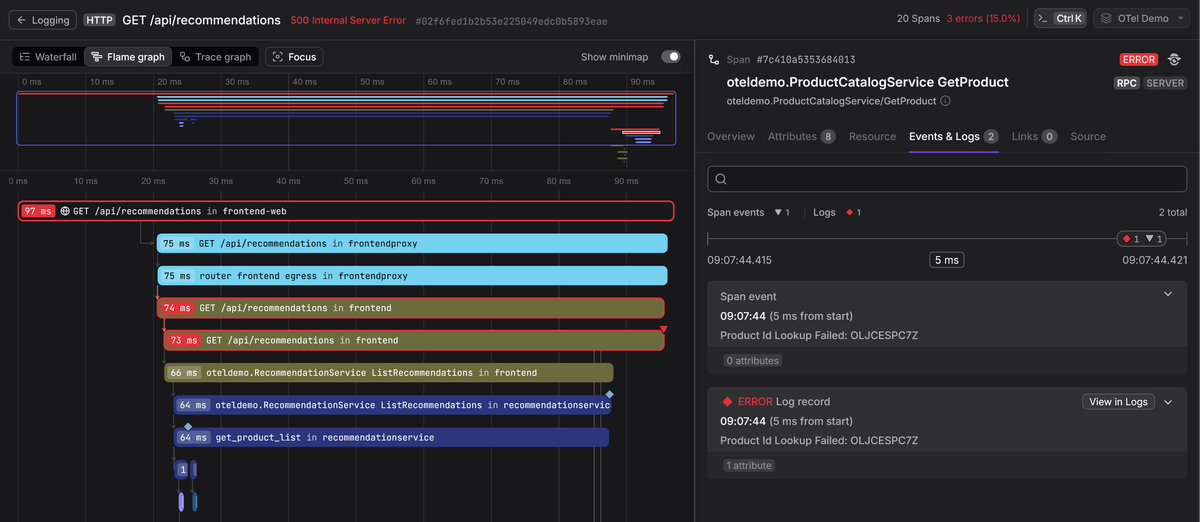
This means you can click from an interesting span in a trace waterfall directly to the log entries that were emitted during that span's execution, filter logs by any attribute on the originating trace, and set up alerts that fire based on patterns across both signals.
Using the bridge alongside a local handler
During development, you often want logs printed to the console and routed
through the OTel pipeline at the same time. Since Go 1.26, the standard library
includes slog.NewMultiHandler() for exactly this purpose, so you don't need a
third-party dependency:
12345678910111213141516otelHandler := otelslog.NewHandler("my-service",otelslog.WithLoggerProvider(provider),)jsonHandler := slog.NewJSONHandler(os.Stderr, &slog.HandlerOptions{AddSource: true,Level: slog.LevelDebug,},)logger := slog.New(slog.NewMultiHandler(otelHandler, jsonHandler),)slog.SetDefault(logger)
MultiHandler calls each handler's Enabled() method and only invokes
Handle() on the ones that are active for the given level. Each handler
receives a cloned record, so one handler can't interfere with another's
processing.
With this setup, every log call writes structured JSON to stderr for local
debugging while simultaneously sending the record through the OTel pipeline for
centralized observability. In production, you'd typically use only the OTel
handler and let your backend handle storage and querying.
Some best practices for OpenTelemetry logging in Go
With the full pipeline running, here are some practices worth adopting early to avoid common pitfalls and get the most out of your OTel logging setup.
-
Use context-accepting methods.
InfoContext(),ErrorContext(), notInfo()orError(). We covered this in the correlation section, but it's worth flagging again here because it's the single most common reason log-trace correlation silently breaks. -
Always defer
provider.Shutdown(ctx). TheBatchProcessorbuffers log records, so if your process exits without calling it, the last batch may be lost. For CLI tools or short-lived processes, consider usingNewSimpleProcessor()instead ofNewBatchProcessor(). It exports every record immediately, so there's nothing to lose on exit. -
Mind the performance profile. The bridge adds overhead compared to writing JSON directly to stdout, because each log record goes through OTel's conversion, batching, and export pipeline.
For the vast majority of services, this overhead is negligible. But if you're in a situation where logging throughput is a measured bottleneck, there's an alternative architecture worth considering: skip the
otelslogbridge entirely, write structured JSON to stdout using slog's built-inJSONHandler, and let the OpenTelemetry Collector handle the conversion to OTel log records on ingestion. This moves the conversion cost out of your application process and into the Collector.The tradeoff is that you'll need to inject the trace context fields into the JSON logs yourself. A package like slog-context can help here: it lets you attach the active span's trace ID and span ID as regular slog attributes on every log entry, so that they can be placed in the correct fields in the Collector.
-
Don't skip the resource attributes. The
resource.Resourceyou attach to theLoggerProvidershows up on every log record and is what your backend uses to identify the source service. At minimum, setservice.nameandservice.version. The Collector can enrich your records further using processors like the resource processor and k8sattributes processor, which automatically attach environment-specific metadata like namespace, pod name, and node without any changes to your application code. -
Use OTel semantic convention attribute names wherever you can. Standardized OpenTelemetry semantic convention names like
user.id,error.type, andhttp.request.methodmean your logs speak the same language as your traces and metrics. Your backend can correlate across signals automatically, dashboards and alerts become portable between services, and new team members don't have to reverse-engineer each service's naming choices. The OTel semantic conventions reference covers the full set of standardized attributes across all signal types.
Final thoughts
The otelslog bridge doesn't ask you to change how your application code logs.
The difference is how they're shaped, correlated with traces, and where the
records go.
This matters when something breaks. Instead of copying a trace ID into a separate log search, you navigate directly from the trace to the logs that ran during it. That navigation is what you want from correlated observability, and you get it without any extra instrumentation.
If you're looking for an observability platform that treats logs, traces, and metrics as connected signals and is built around OpenTelemetry's data model from the ground up, give Dash0 a try with a free 14-day trial.
