Last updated: June 16, 2026
Collecting Docker Container Logs with OpenTelemetry
When something breaks in your Docker containers docker logs gets you pretty far towards a fix. But its limitations show when you have more hosts than you can SSH into, containers that have already exited, and no way to search across services without stitching output together manually.
Shipping logs off each host through an OpenTelemetry pipeline solves
this, but the setup isn't obvious. The filelog receiver looks like the
right tool until you run into filesystem permissions, and alternative approaches often sound more complicated than they are.
This guide walks you through the best way to ingest Docker logs in practice, and gets you to a working pipeline end-to-end.
How Docker captures and stores logs
By default,
Docker captures everything
a container writes to stdout and stderr and hands it to a logging
driver. The default driver, json-file, writes those streams to a file on the
host:
1/var/lib/docker/containers/<container-id>/<container-id>-json.log
That file contains one JSON object per log line, with the message text, the
stream (stdout or stderr), and a timestamp.
12345{"log": "Starting cloud controller for cluster desktop","stream": "stderr","time": "2026-04-18T14:28:28.812549652Z"}
The problem is that these files are tied to the container's lifecycle, so when you delete a container, Docker removes its log file along with it. That's by design in ephemeral environments, but it means you can't rely on local files as your only source of truth.
A better approach is to run the OpenTelemetry Collector on each host and have Docker push logs directly to it as containers write them, which skips file access entirely. The Collector then forwards those logs to a centralized backend where you can search and correlate across your entire fleet. The rest of this guide covers how to set that up.
Why scraping Docker log files is often the wrong choice
When people first wire Docker logs into OpenTelemetry, the intuitive approach is
to point the
filelog receiver
at the /var/lib/docker/containers/ directory and let it do the parsing. That
can work, but it often comes with friction.
The JSON envelope Docker wraps around each log line is not quite the same as the
raw message your application emitted. The filelog receiver needs an operator
pipeline to unwrap the outer JSON, pull out the log field, parse the inner
JSON if your app logs in JSON, and reassemble a proper OTel log record.
You also need to ensure the Collector has access to the Docker socket or the container log directory on every host. In environments where that's locked down, or where you're running a managed container service that doesn't expose the host filesystem, file scraping isn't an option at all.
An easier approach: the Fluentd logging driver
Docker has a fluentd logging driver that sends logs directly to a
Fluentd-compatible endpoint the moment a container writes them, rather than
relying on file scraping to collect them after the fact.
The OpenTelemetry Collector's
fluentforward receiver
speaks the same protocol, so you can skip Fluentd itself entirely and receive
those events straight in the collector.
The flow looks like this:
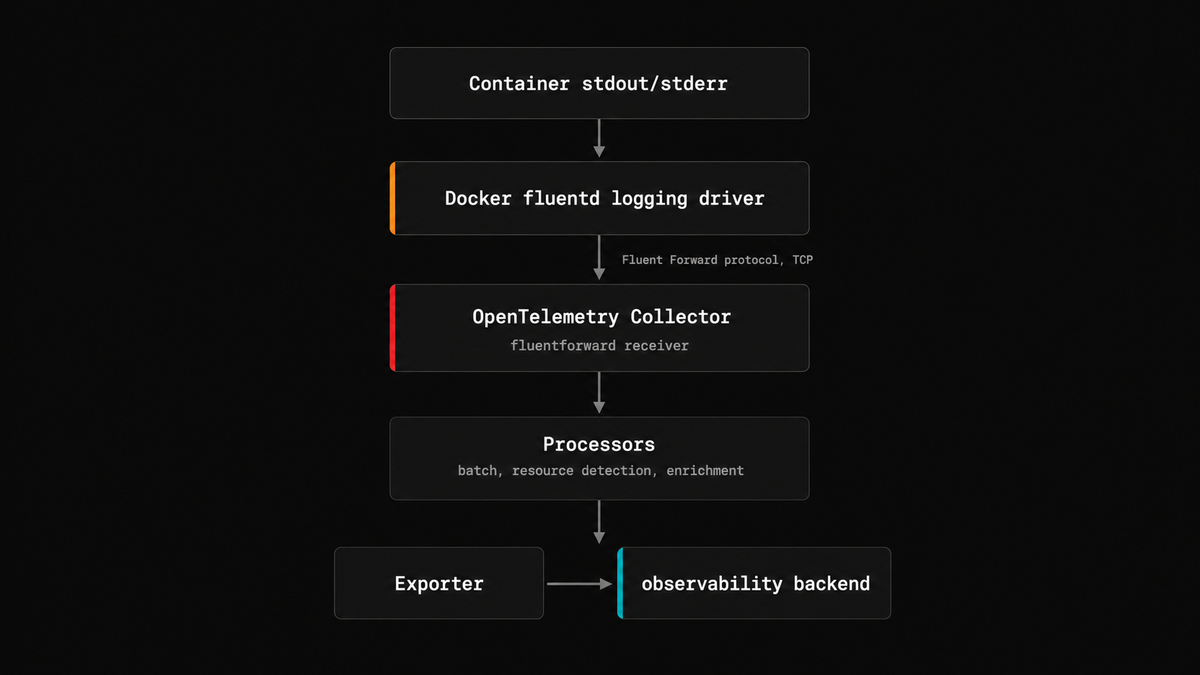
Logs travel over a socket the moment they're emitted, so there's no file scraping and no need to set up an operator pipeline to unwrap Docker's JSON envelope.
Configuring the Docker logging driver
First, tell Docker to use the
fluentd logging driver.
You can do this globally in /etc/docker/daemon.json to cover all containers on
the host:
123456789{"log-driver": "fluentd","log-opts": {"fluentd-address": "localhost:24224","fluentd-async": "true","fluentd-sub-second-precision": "true","tag": "docker.{{.Name}}"}}
The fluentd-async option is important here. Without it, Docker blocks the
container's log writes while it waits for the collector to acknowledge each
message, and if the collector is unreachable, the container stops immediately.
With async mode, Docker buffers messages locally and retries delivery in the
background, though if the collector never comes up at all it will buffer up to
fluentd-buffer-limit events (1,048,576 by default) and then drop silently.
Without fluentd-sub-second-precision, timestamps are truncated to whole
seconds, which makes log ordering and correlation unreliable on any service that
emits more than a handful of lines per second.
After editing daemon.json, restart the Docker daemon. Only newly created
containers will pick up the change, so you'll need to recreate any existing
ones:
1sudo systemctl restart docker
With Docker now forwarding container logs to port 24224, you need a Collector instance listening at that endpoint to receive them.
Per-service configuration in Docker Compose
If you can't modify the Docker daemon configuration directly, or if some services need different behavior, you can configure the driver per service in your Compose file instead:
123456789101112131415161718# docker-compose.ymlservices:api:image: my-api:latestlogging:driver: fluentdoptions:fluentd-address: localhost:24224fluentd-async: "true"fluentd-sub-second-precision: "true"tag: docker.{{.Name}}otel-collector:image: otel/opentelemetry-collector-contrib:latestvolumes:- ./otelcol.yaml:/etc/otelcol-contrib/config.yamlports:- 24224:24224
When using Docker Compose, you must use localhost not the service name
(otel-collector) to resolve the Fluentd address since the Docker daemon
resolves this address on the host, where Compose service names don't exist in
DNS.
To reduce repetition across services, use a YAML anchor:
123456789101112131415161718192021222324# docker-compose.ymlx-logging: &default-loggingdriver: fluentdoptions:fluentd-address: localhost:24224fluentd-async: "true"fluentd-sub-second-precision: "true"tag: docker.{{.Name}}services:api:image: my-api:latestlogging: *default-loggingworker:image: my-worker:latestlogging: *default-loggingotel-collector:image: otel/opentelemetry-collector-contrib:latestvolumes:- ./otelcol.yaml:/etc/otelcol-contrib/config.yamlports:- 24224:24224
Keeping async delivery reliable
Async mode solves the back-pressure problem, but it introduces another one: if the in-memory buffer fills up faster than the collector can drain it, Docker starts dropping log messages. The default buffer holds 1,048,576 events, which is generous enough for most services, but you can raise it if you're seeing drops:
1234567{"log-driver": "fluentd","log-opts": {"fluentd-async": "true","fluentd-buffer-limit": "2097152"}}
By default, Docker retries delivery indefinitely when the collector is
unreachable. You can also tune how long it waits between retries with
fluentd-retry-wait, which defaults to one second:
123456{"log-opts": {"fluentd-async": "true","fluentd-retry-wait": "2s"}}
If you're running the collector on the same host, which is the common pattern, it should rarely be slow enough to cause buffer pressure in the first place.
Setting up the OpenTelemetry Collector
You'll need the otel/opentelemetry-collector-contrib image because the
fluent_forward receiver isn't part of the core distribution.
1docker pull otel/opentelemetry-collector-contrib:0.154.0
Here's a minimal configuration that sets up the fluent_forward receiver for
ingesting Docker logs:
123456789101112131415161718192021# otelcol.yamlreceivers:fluent_forward:endpoint: 0.0.0.0:24224processors:resourcedetection/system:detectors: [system]system:hostname_sources: [os]exporters:debug:verbosity: detailedservice:pipelines:logs:receivers: [fluent_forward]processors: [resourcedetection/system]exporters: [debug]
The resourcedetection/system processor adds the hostname automatically, which
is useful for correlating logs across multiple hosts.
Add the collector as a service in your Compose file:
12345678# docker-compose.ymlservices:otel-collector:image: otel/opentelemetry-collector-contrib:0.154.0volumes:- ./otelcol.yaml:/etc/otelcol-contrib/config.yamlports:- 24224:24224
Once you restart your services, you can check the Collector logs to confirm that your Docker container logs are coming through:
1docker compose logs otel-collector -f --no-log-prefix
You should see log records arriving from your containers, with the Body
containing the raw log line and attributes like container_name,
container_id, and source attached by the fluent_forward receiver:
123456789101112131415161718192021222026-06-08T07:43:51.763Z info ResourceLog #0Resource SchemaURL: https://opentelemetry.io/schemas/1.40.0Resource attributes:-> host.name: Str(4e940d4722ea)-> os.type: Str(linux)ScopeLogs #0ScopeLogs SchemaURL:InstrumentationScopeLogRecord #0ObservedTimestamp: 1970-01-01 00:00:00 +0000 UTCTimestamp: 2026-06-08 07:43:51 +0000 UTCSeverityText:SeverityNumber: Unspecified(0)Body: Str({"timestamp": "2026-06-08T07:43:51+00:00","level": "info","pid": "29","client.address": "172.22.0.1","client.port": "34230","url.path": "/index.html","url.query": "","network.protocol.name": "HTTP/1.1","server.address": "localhost","server.port": "80","user_agent.original": "curl/8.5.0","http.request.method": "GET","http.request.header.referer": "","http.response.status_code": 200,"http.response.body.size": 615,"http.server.request.duration": 0.000,"trace_id": "cdc134217e5afb428b188b4271c3305f","span_id": "930898f94fe03e5b","parent_sampled": 0})Attributes:-> fluent.tag: Str(docker.nginx-server)-> source: Str(stdout)-> container_id: Str(18d07bfa79470448896c0f2fcbd0aa076dd0082fc8642f1c6339e6174c4b5bc6)-> container_name: Str(/nginx-server)Trace ID:Span ID:Flags: 0
From this point onward, you can start shaping the pipeline to make these logs more compliant with the OpenTelemetry logs data model.
For example,container_name and container_id are sitting in log attributes,
but they describe the source of the logs rather than the content of any
individual record, so they belong in resource attributes instead. The
resource processor
or
transform processor
can promote them there.
The Body is also a raw JSON string containing fields that belong elsewhere in
the OTel data model: the severity level, the timestamp, trace context, and
attributes like http.response.status_code and http.request.method. Parsing
that JSON with the transform processor and promoting each field to its proper
place is what makes them queryable rather than buried in a string.
Once you've confirmed logs are flowing and the records are fully OTel-compliant, you can swap the debug exporter for an exporter that actually transmits the logs to your observability backend.
Sending logs to Dash0
Dash0 is an OTel-native observability platform. It stores and queries your telemetry in the OTel format directly rather than translating it into a proprietary schema on ingestion
The pipeline you've built here connects to it without any extra configuration.
You only need to replace the debug exporter with the
OTLP HTTP (or
gRPC) exporter as follows:
12345678910111213# otelcol.yamlexporters:otlphttp/dash0:endpoint: <your_dash0_endpoint>headers:Authorization: Bearer <your_auth_token>service:pipelines:logs:receivers: [fluent_forward]processors: [resourcedetection/system]exporters: [otlphttp/dash0]
Once you've signed up for a free account, you can find your endpoint and auth token in the Dash0 dashboard under Organization settings.
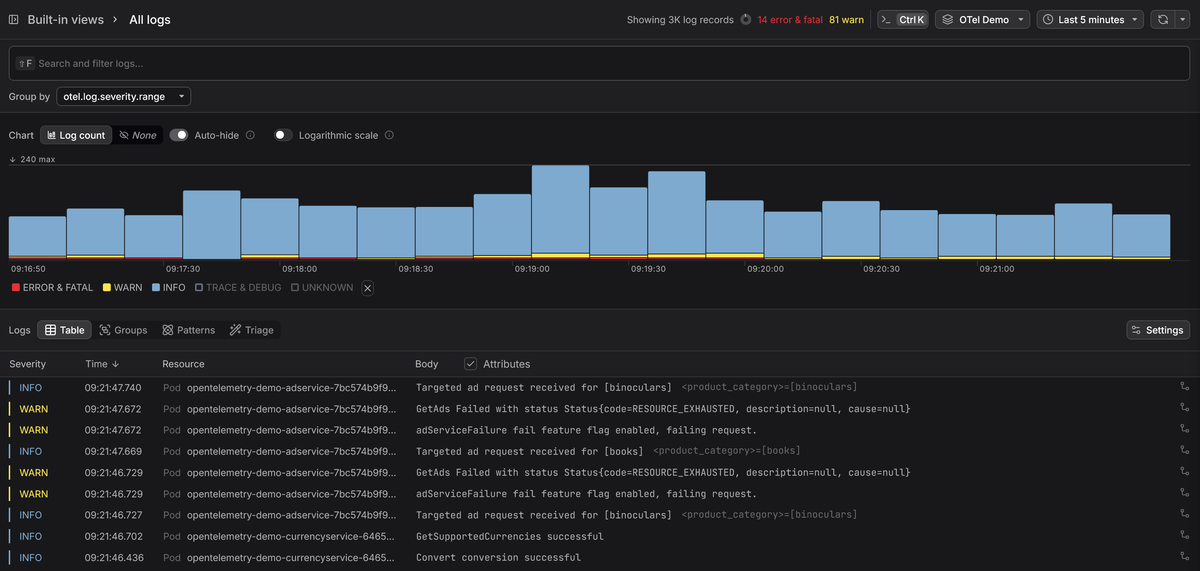
Once the Collector restarts, your Docker logs will appear in the log explorer alongside any traces and metrics you're already sending, so you can correlate a slow request with the log lines it produced without jumping between tools.
Final thoughts
The pipeline you've built here is deliberately minimal. A single receiver, a couple of processors, one exporter. That's enough to get logs off the host and into a backend, but there's room to grow: parsing the JSON body, promoting fields into proper OTel attributes, filtering out noise before it hits storage, or routing logs from different services to different datasets.
The OpenTelemetry Collector guide is a good next step if you want to understand how to build more sophisticated pipelines, and the Fluent Forward receiver guide covers the receiver in more depth.
