Last updated: June 29, 2026
Docker Compose Logs: A Complete Guide
Working with multi-container applications often means taming a flood of data from different services. Docker Compose orchestrates the containers, but to diagnose issues and correlate complex interactions, you need a command of the logs.
Compose solves the fragmentation problem by unifying container output into a single interface. It allows you to filter for specific services, review past activity, or stream live logs as your application executes.
This guide walks you through everything you need to know about Docker Compose logs—from essential everyday commands to practical filtering and formatting techniques. We'll also take a peek under the hood at how Compose retrieves data and how to build a robust observability workflow for production.
Let's get started!
Quick start: docker compose logs command reference
If you only need a fast reference for the most common log operations, here are the commands you'll reach for most often when working with Docker Compose:
| Action | Command |
|---|---|
| View all logs from every service | docker compose logs |
| View logs for a specific service | docker compose logs <service> |
| Stream logs in real time | docker compose logs --follow |
| Tail the last N lines | docker compose logs --tail <number> |
| Tail and follow at the same time | docker compose logs --tail <number> --follow |
| Show logs since a specific time or duration | docker compose logs --since <value> |
| Show logs until a specific time or duration | docker compose logs --until <value> |
| Remove service name prefixes | docker compose logs --no-log-prefix |
| Add timestamps if missing | docker compose logs --timestamps |
These commands provide a solid starting point for day-to-day debugging, whether you are tracking down an error, observing how services interact, or trying to confirm that a deployment is behaving correctly.
How Docker Compose gathers service logs
Docker Compose builds on
Docker's logging system,
which captures anything a container writes to stdout or stderr. Each
container funnels these streams into the logging driver configured on the host
(usually json-file), where they are stored and made available to
docker compose logs.
Compose does not create its own logging mechanism; it simply aggregates the logs
that each container already produces. When you run the logs command, Compose
reads the log output for every container within the stack and prints it in a
unified stream, tagging each line with the corresponding service name.
You can begin by typing the following at the root of your Docker Compose project:
1docker compose logs
This prints the entire accumulated log history for every service in the stack. The output is interleaved chronologically, and each line is prefixed with the service name so you can distinguish their origins:
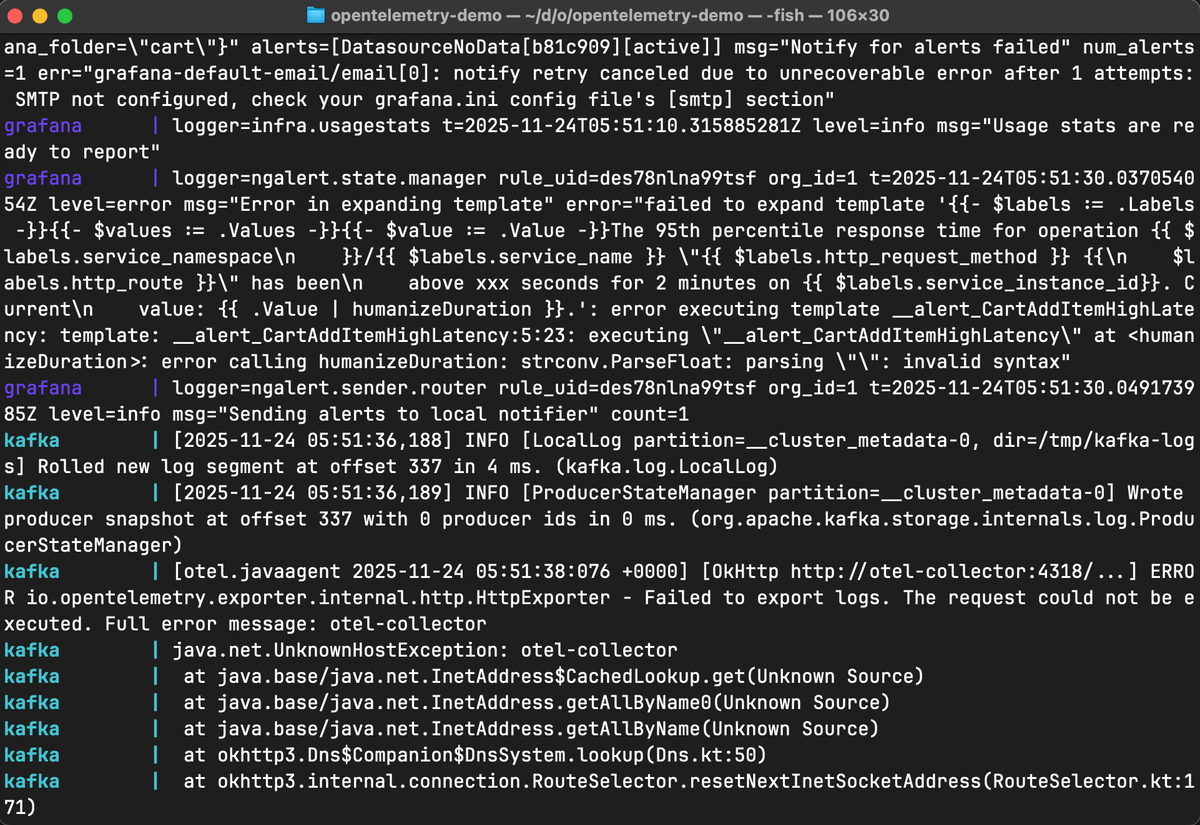
Compose automatically merges them as a single logical service, which helps when diagnosing behaviors that depend on multiple replicas.
If you encounter the error below, it means you are running the command outside a
directory containing docker-compose.yml or compose.yml.
1no configuration file provided: not found
Ensure to navigate to the directory containing such file, before re-running the
logs command.
Viewing logs for specific services
In real-world debugging, you rarely want to comb through all logs from every container at the same time. With Docker Compose, you can narrow the view by specifying one or more services:
1docker compose logs <services>
Such as:
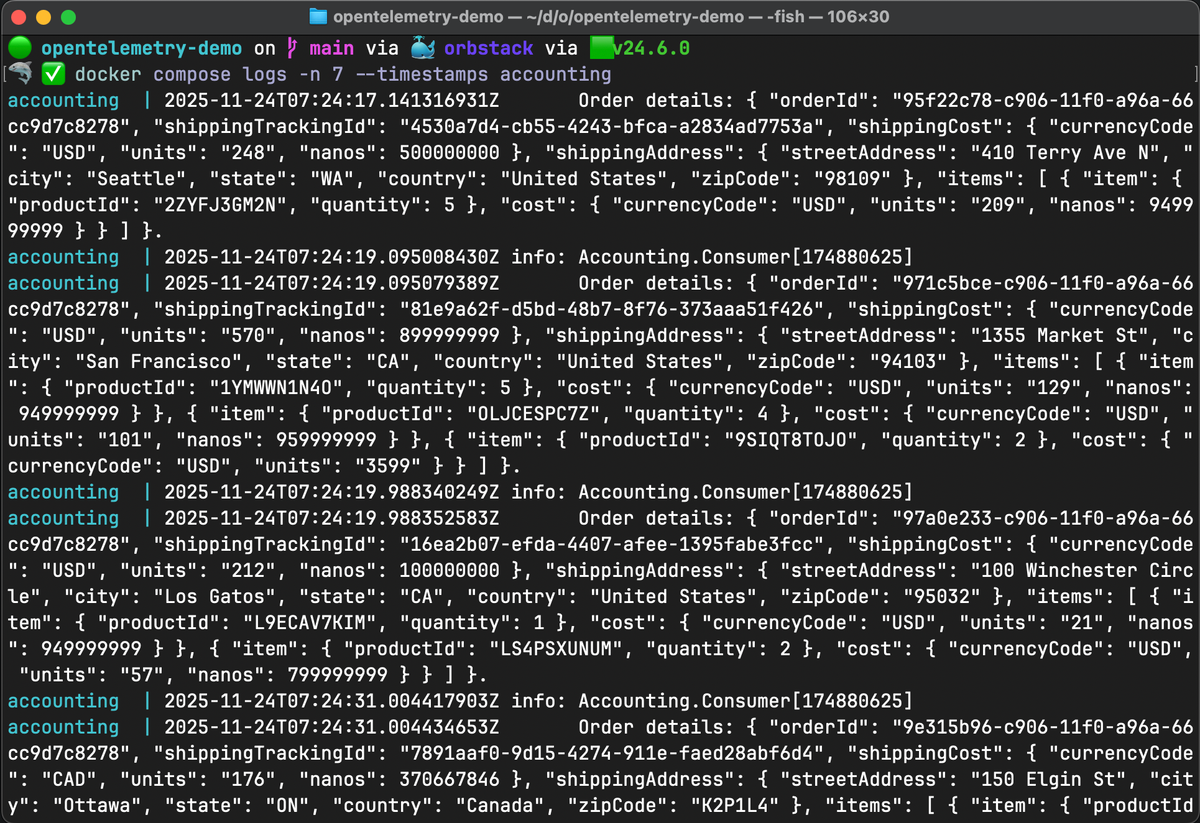
1docker compose logs otelcol accounting
Compose collects logs for each service, including all its replicas, and prints them in a color-coded stream.
If your Compose setup includes scaled services such as:
1docker compose up --scale kafka=3
You'll see number suffixes like kafka-1, kafka-2, and kafka-3 in the
logs output. These suffixes let you narrow your investigation to the container
that is actually misbehaving without losing the convenience of viewing all logs
through a single command.
To view logs from a specific replica, use the --index flag:
1docker compose logs --index 1 <service>
Following and tailing Docker Compose logs
Troubleshooting active issues usually requires seeing what's happening right
now. You can stream new logs as they arrive using the -f or --follow flag:
If you're troubleshooting an issue happening right now, you'll usually want to
stream new logs. This means including the -f/--follow flag as follows:
1docker compose logs --follow <services>
However, by default, this command dumps the entire log history of the service before it begins streaming. For long-running containers, this can flood your terminal with thousands of irrelevant lines.
The most effective pattern is combining --follow with -n/--tail. This
restricts the initial output to a manageable amount of context followed
immediately by the live stream:
1docker compose logs <services> --tail 10 --follow
This command prints only the last 10 lines to establish context and then streams
new entries in real-time. When you are done monitoring, simply press Ctrl+C to
exit.
Filtering Docker Compose logs by time
Compose accepts both human-friendly relative durations and absolute timestamps,
allowing you to isolate logs produced within a specific window. These filters
function identically to standard docker logs command.
You can control the time range using two flags:
--since: Shows logs generated after a specific time or duration.--until: Shows logs generated before a specific time or duration.
Here are a few practical examples:
1. Show logs from the last 10 minutes
If you omit the service name, Compose filters logs for the entire stack:
1docker compose logs --since 10m <services>
2. Limit log output to a specific time window
To inspect a specific event in the past, use absolute timestamps (ISO 8601 format):
1docker compose logs --since "2025-11-24T08:00:00" --until "2025-11-24T08:15:00" <services>
3. Show logs from the last hour but only for one service
You can combine time filters with specific service names to zoom in on a culprit, such as checking the database logs from the last hour:
1docker compose logs --since 1h <services>
Using these filters significantly reduces noise when you are trying to correlate actions between services or pinpoint the exact moment a failure began.
Searching Docker Compose logs with grep
Docker Compose does not have a built-in regular expression filter. However,
since it writes directly to standard output, you can pipe the logs to standard
shell utilities like grep.
This is particularly useful for finding specific error codes or filtering out "noisy" logs across your entire stack. To find a specific string across all services:
1docker compose logs | grep "Connection refused"
If your logs are cluttered with health checks or heartbeat messages, you can usegrep -v to invert the match and hide them:
1docker compose logs -f | grep -v "GET /health"
When using --follow with grep, you might notice a delay because grep buffers output. To fix this, force it to use line buffering:
1docker compose logs -f | grep --line-buffered "ERROR"
Because Compose logs are interleaved, a single error line might not tell the
whole story. Use the -C (context) flag to see the lines immediately before and after the match:
1docker compose logs | grep -C 5 "Exception"
Formatting and improving the output
By default, Docker Compose prepends the service name and color-codes each line to differentiate streams. While helpful for human readability, this metadata interferes when you need to copy logs into a parser, share them in a bug report, or pipe them into external tools.
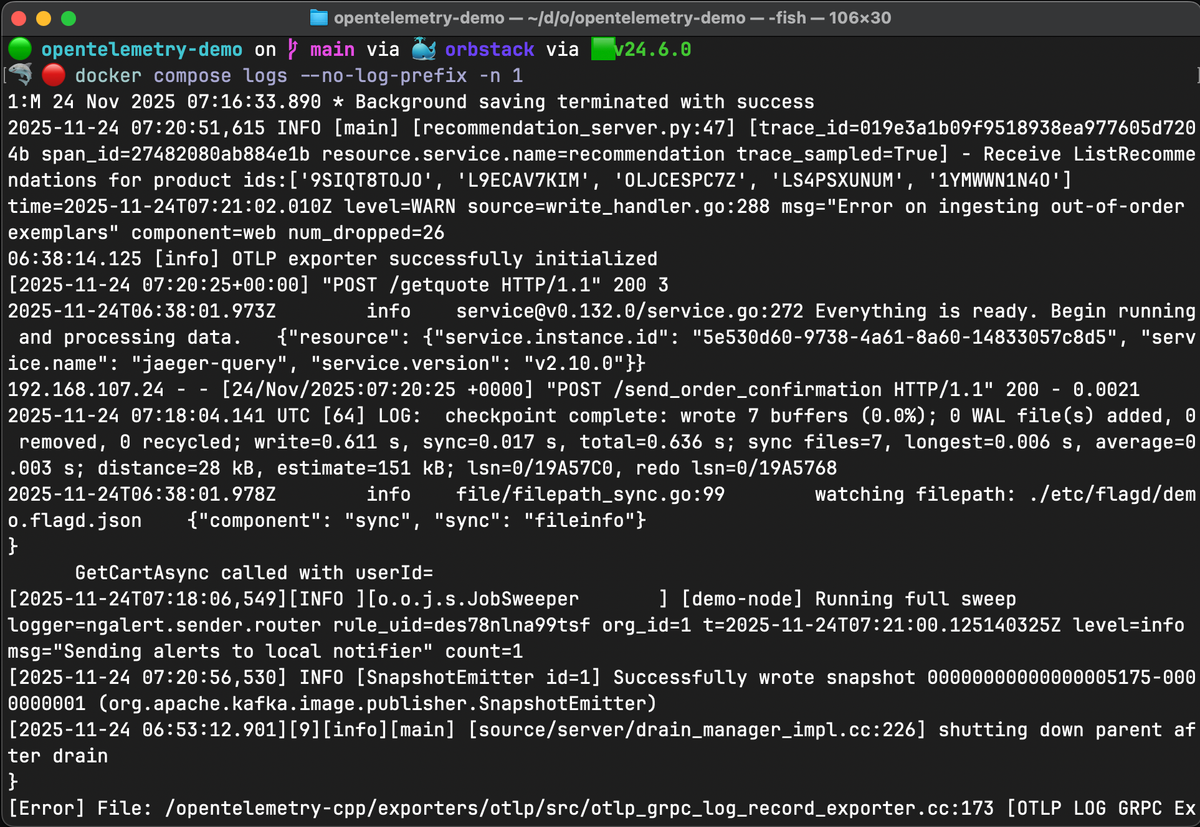
To strip the service prefix and get raw output, use the --no-log-prefix flag:
1docker compose logs --no-log-prefix
For consistent behavior when piping log output to other tools, you may also want to disable colors:
1docker compose logs --no-color
If your service logs do not natively include time data, you can force Docker to display the timestamp recording when the log was captured:
1docker compose logs --timestamps
Handling multiline logs
A common challenge with Docker Compose is how it handles multiline output (such as Java stack traces or pretty-printed JSON). Because Docker treats every newline as a distinct log event, a single error trace from one service might get interleaved with logs from another service, making the output unreadable.
To avoid fragmentation, the best practice is to emit single-line logs (ideally JSON) from your application:
1{ "level": "info", "message": "Server started", "timestamp": "2024-12-27T15:30:15Z" }
By outputting JSON on a single line, you'll ensure that docker compose logs
treats the entire event as one atomic unit, keeping your streams clean and
parsable.
Watching logs with Dozzle
While the terminal is efficient, tracking a request as it hops between five different microservices can be difficult when the logs are interleaved in a single stream. A GUI log viewer can help you visualize these streams side-by-side.
Dozzle is a lightweight, real-time log viewer that
requires no configuration. You can add it directly to your docker-compose.yml file as a utility service:
12345678910# docker-compose.ymlservices:dozzle:image: amir20/dozzle:latestcontainer_name: dozzlevolumes:# Dozzle needs access to the Docker socket to read logs- /var/run/docker.sock:/var/run/docker.sockports:- 8888:8080
Once running, navigate to http://localhost:8888:

Dozzle automatically discovers all running containers and allows you to pin multiple logs to a split-screen view. This makes it significantly easier to correlate events across services without cluttering your terminal.
If you don't want to modify your Compose file, you can also run it ad-hoc:
12345docker run -d \--name dozzle \-p 8888:8080 \-v /var/run/docker.sock:/var/run/docker.sock \amir20/dozzle:latest
Configuring Docker logging drivers and log rotation
By default, Docker uses the json-file driver without any limits. This means
that for a long-running service, the log file will grow indefinitely until it
consumes all available disk space.
While you can
configure defaults globally
in the Docker daemon, Docker Compose allows you to define precise logging
behaviors on a per-service basis through the logging key.
The most critical configuration for production is log rotation. You can restrict the size and number of log files Docker keeps for a specific service.
Here is how to configure the default driver to rotate logs once they reach 10MB, keeping only the last 3 files:
123456789# docker-compose.ymlservices:api:image: my-api:latestlogging:driver: "json-file"options:max-size: "10m"max-file: "3"
For high-volume applications,
the local driver is
often a better choice than json-file. It uses a binary format for better
performance, and enables compression and log rotation by default (100MB limit):
123456# docker-compose.ymlservices:database:image: postgres:18logging:driver: "local"
Using YAML Anchors for DRY logging configuration
If you have a microservices architecture with many services, copying the same logging configuration into every block is sure to be a maintenance nightmare.
You can use YAML anchors (&) and aliases (*) to define the logging strategy once and apply it everywhere as follows:
1234567891011121314151617# docker-compose.yml# Define the logging configuration oncex-logging: &default-loggingdriver: "json-file"options:max-size: "10m"max-file: "3"tag: "{{.Name}}"services:api:image: my-api:latestlogging: *default-logging # Apply the configurationworker:image: my-worker:latestlogging: *default-logging # Apply the same configuration
In this example, the x-logging block (an extension field) defines the anchor
&default-logging. Each service then references it using *default-logging. If
you decide to change the logging driver or its options later, you'll only need
to update it in one place.
Centralizing Docker Compose logs with OpenTelemetry
Using docker compose logs is great for local debugging, but it's not a
production strategy. Logs disappear when containers are recreated,
they're hard to search across services, and they don't carry enough
context on their own.
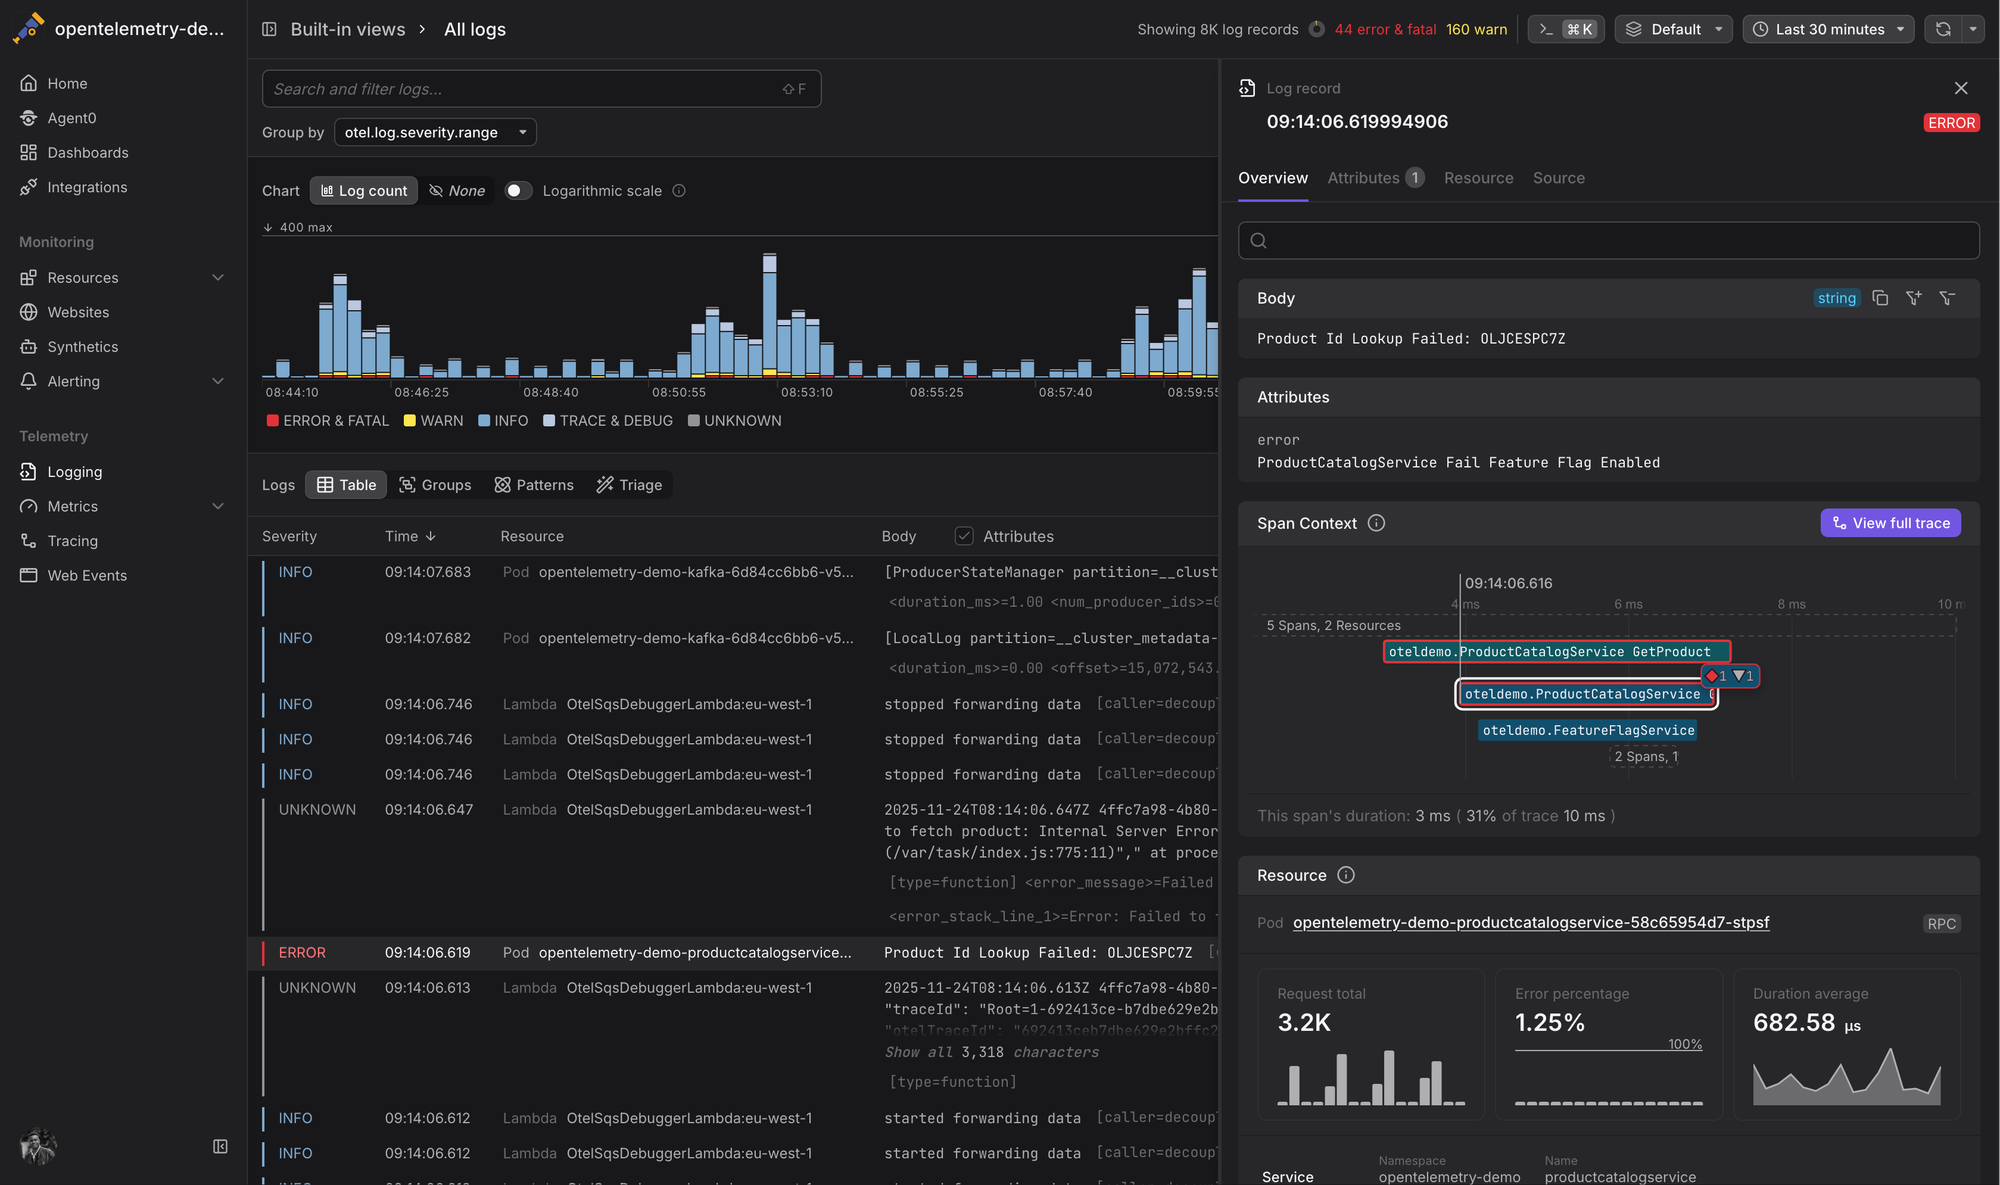
Shipping your Compose logs to an observability backend keeps them
retained, searchable, and correlated with your metrics and traces. Our
dedicated guide on
collecting Docker container logs with OpenTelemetry
covers the full setup: how to run the
OpenTelemetry Collector
as a service in your stack, configure the fluentd logging driver on
your application containers, and wire up the
Fluent Forward receiver
to get logs flowing into a backend like Dash0.
Final thoughts
You have now journeyed from the basic docker compose logs command to
understanding the critical importance of logging drivers, rotation strategies,
and centralized observability.
By mastering these tools, you're no longer just guessing when things go wrong in your microservices stack. You have the visibility required to build, debug, and run resilient, production-ready applications.
Remember that logs are your application's voice. Structure them well using JSON, manage their lifecycle, and centralize them with OpenTelemetry to ensure you can always hear what they are saying.
Thanks for reading!
