Last updated: June 18, 2026
OpenTelemetry Auto-instrumentation in Java
Observability can feel like both a necessity and a burden for Java developers and platform engineers alike. This often stems from the complexity of implementation and the overhead of maintaining instrumentation code. However, understanding what your service is doing – not just when something breaks, but in the day-to-day churn of user traffic, API calls, and database queries – is crucial for operational excellence. Achieving this understanding necessitates careful consideration of how to instrument your application.
That’s where OpenTelemetry comes in. It offers a consistent, vendor-neutral way to collect traces, metrics, logs, and (increasingly) profiles, ensuring that your observability data isn't tied to a specific vendor's tools or ecosystem. And Java, with its mature ecosystem and introspectable runtime, turns out to be a perfect match - once you know how to approach it.
In this post, we’ll take a deep dive into instrumentation for Java applications. We’ll explore the three ways to instrument - manual, auto, and no-touch - and we’ll discuss what to expect from each. We’ll also look at how to enrich telemetry with business context, and we’ll tie everything back to a working example you can try for yourself. If you’re looking for the big picture and the fine print, this post is for you.
Instrumentation in Java: Why It’s Different
Let’s start with something simple: Java is old. It’s been around for nearly three decades. It’s run everything from payment processors to Minecraft servers. Along the way, it’s accumulated layers: frameworks, containers, proxies, abstractions - all of which complicate the job of understanding what your app is actually doing.
However, this history also gives us a unique advantage: the Java runtime (JVM) is highly introspectable. This introspection allows us to attach agents to it, intercept method calls, and even rewrite bytecode on the fly. These capabilities are fundamental, as they enable powerful auto-instrumentation without modifying application source code, a feat not easily achieved in all language runtimes.
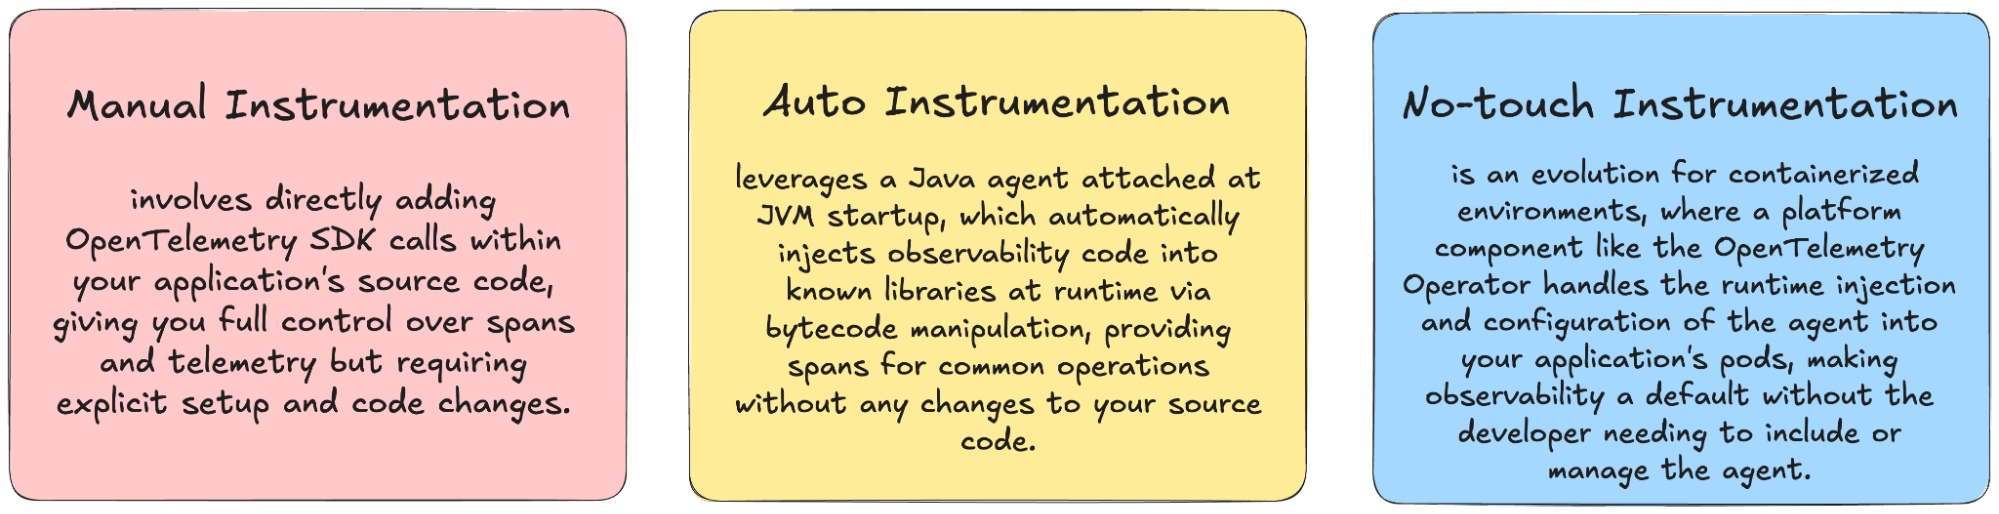
This deep introspection is key to how OpenTelemetry offers three distinct options for adding observability to Java:
These aren’t competing approaches. They’re complementary. And understanding their trade-offs is the key to choosing the right path for your team, your services, and your observability goals.
Manual Instrumentation: Full Control, Full Responsibility
Manual instrumentation gives you complete control over what telemetry is collected, how spans are structured, and where metrics are emitted. It also means you configure the OpenTelemetry SDK yourself. That’s right - you bootstrap everything. From initializing a tracer provider, to setting up exporters, to wiring in resource attributes and propagators.
Here’s what it typically involves:
12345OpenTelemetry openTelemetry = OpenTelemetrySdk.builder().setTracerProvider(SdkTracerProvider.builder().build()).build();Tracer tracer = openTelemetry.getTracer("my-instrumented-service");
However, you can also do most of the above using the OpenTelemetry SDK configuration file format, which greatly remove the need of changing your application's code if you want to change how the OpenTelemetry SDK is configured.
You’re now responsible for:
- Creating spans using that tracer
- Marking start and end times
- Propagating context across threads or services
- Adding attributes and events to make the trace meaningful
In return, you get full visibility into every interaction that matters - but you also carry the risk of misconfiguration. Manual instrumentation isn’t just about dropping a few spans into your code; it’s about owning the whole telemetry lifecycle. That includes what you collect, how you collect it, and how and where you send it. And most changes to how you want to collect and dispatch telemetry, will require you to change your application and redeploy it.
So when does this make sense?
- When you’re writing middleware or SDKs and need tight control over the exact telemetry emitted and its structure, ensuring consistent observability for downstream users.
- When your application uses custom libraries or proprietary protocols that aren’t covered by OpenTelemetry’s auto-instrumentation, requiring bespoke span creation.
- When you want to avoid the potential performance trade-offs or overhead of a generic agent by precisely instrumenting only critical paths.
In most day-to-day service development, though, it’s overkill. Especially when a powerful alternative exists.
Auto-Instrumentation: The Practical Default
For most applications - especially those using Spring Boot, Jakarta EE, JDBC, or common HTTP libraries - auto-instrumentation offers the best starting point. All you do is attach a prebuilt Java agent to your JVM process. This agent uses Java’s java.instrument API to hook into known libraries and frameworks. It injects spans and propagates context without you writing a single line of observability code. Your app stays clean. You gain visibility. And it all happens at runtime.
To use it, you simply modify your startup command:
1234java -javaagent:opentelemetry-javaagent.jar \-Dotel.service.name=todo-service \-Dotel.exporter.otlp.endpoint=http://otel-collector:4317 \-jar my-app.jar
In the demo repo (java-instrumentation) this is exactly how we’ve configured the todo-service and validation-service. The Dockerfiles include the agent, and a few environment variables handle the configuration. That’s all it takes to see traces flow.
You get automatic spans for:
- Incoming HTTP requests
- JDBC queries
- gRPC calls
- Kafka message handling
- Common servlet containers
This is great for teams that:
- Want fast, standardized observability across services
- Use off-the-shelf frameworks like Spring or Micronaut
- Are new to OpenTelemetry and want a low-friction entry point
What you don’t get is business context. The agent operates at a technical level, instrumenting common libraries and frameworks; it has no inherent understanding of your application's domain logic, meaning it cannot identify which users are VIPs, which requests are sensitive, or which operations are customer-facing without explicit guidance. That’s where you come in.
Hybrid Enrichment: Making Traces Mean Something
The spans created by the Java agent are useful - but they’re also generic. They tell you what happened, but not why it mattered. This is where a combination of manual- and auto-instrumentation shines. The idea is simple: the agent creates the spans, and your application adds meaning. You don’t have to configure a tracer. You don’t have to manage span lifecycle. You just enrich the current span with relevant metadata:
123Span.current().setAttribute("validation.containsProfanity", containsProfanity);Span.current().setAttribute("validation.todoLength", todo.getName().length());
These lines come straight from our validation-service. After checking whether the submitted todo item contains profanity, we record the result as a span attribute. We also add the length of the todo.
The result? Now, when you view traces in your backend, you can filter by:
- How many todos were rejected due to profanity
- How often long todos take longer to validate
- Whether certain users submit more invalid content
Alternatively, to seamlessly add spans to your code, OpenTelemetry's Java agent provides instrumentation annotations such as @WithSpan:
1234@WithSpan(kind = SpanKind.CLIENT, inheritContext = false, value = "my span name")public void myMethod() {// ... custom code here ...}
This annotation allows you to automatically wrap a method's execution in a new span, providing a clean way to instrument custom logic beyond what the out-of-the-box agent provides.
These enrichments unlock huge value, as it directly links low-level technical operations to high-level business outcomes. This allows for faster debugging of business-impacting issues, deeper insights into user behavior, and improved understanding of application performance from a user's perspective. It also plays well with custom dashboards and correlation tools. Suddenly, your observability system speaks the language of your business.
The Operator: A Platform-Aware Approach
The OpenTelemetry Operator brings the same declarative mindset that made Kubernetes powerful to the world of observability. Instead of manually injecting agents or wiring environment variables through CI pipelines, you define your instrumentation setup as a Kubernetes resource - and the Operator takes care of the rest.
The key abstraction here is the Instrumentation resource. It describes which auto-instrumentation agent to use, which environment variables to apply, and how to inject the agent into your pods. You can define it once, then roll it out consistently across namespaces or clusters.
Here’s a simplified example:
123456789101112131415apiVersion: opentelemetry.io/v1alpha1kind: Instrumentationmetadata:name: instrumentationnamespace: opentelemetryspec:exporter:endpoint: http://otel-collector:4317propagators:- tracecontext- baggagesampler:type: always_onresource:addK8sUIDAttributes: true
Once applied, any pod annotated with instrumentation.opentelemetry.io/inject-java: "true" will have the agent injected automatically - no Dockerfile changes, no wrapper scripts, no runtime surprises. It’s the same Java agent under the hood. However, with the Operator, platform engineers assume a crucial dual role: they control the consistent rollout and configuration of the agent across the environment, while application developers are freed from the burden of managing instrumentation directly.
This approach isn’t just a technical shortcut; it profoundly changes how organizations think about observability. Instrumentation becomes an inherent part of your platform’s contract, shifting from an afterthought or a best-effort task for individual development teams to a centrally managed, enforced, versioned, and monitored cluster resource. This consistency ensures reliable telemetry generation, seamless trace context propagation across services, and signals reaching your backend with shared metadata intact, all without developers needing to modify application code or manage agent configurations.
In the demo repository, we’ve not only showcased the basics of configuring the agent via Dockerfile and environment flags for auto-instrumentation using Docker Compose (where the agent is fetched during the Docker build process), but we've also provided a full no-touch example utilizing the OpenTelemetry Operator and Instrumentation resources for Kubernetes deployments. This demonstrates different yet complementary approaches to achieving observability. The core application code doesn’t change; only the operational footprint improves. The ability to evolve like this - from manually attached agents to full platform-led rollout - is a core strength of OpenTelemetry, and our demo clearly illustrates this progression.
For a more opinionated approach that provides additional benefits, platform engineers can also investigate the dash0-operator. It's recommended to investigate both to decide which best fits your organization's needs.
When Things Go Wrong: Common Pitfalls
While instrumentation in Java is remarkably flexible, it's not without its challenges. Several common issues can arise, especially when operating at scale, that teams should be aware of.
One significant consideration is startup time. The Java agent performs significant work during application launch, particularly when scanning classes and wiring bytecode. This process can unfortunately delay readiness probes - which, in fast-scaling environments, might lead to unnecessary restarts or throttling. To mitigate this, teams should consider tuning their readiness probe delays or leveraging JVM warm-up techniques.
Another challenge lies in preventing configuration drift. If different services configure the OpenTelemetry agent inconsistently, or even omit it entirely, the inevitable result will be gaps in your traces. While using the OpenTelemetry Operator significantly helps here, even without it, striving for standardized configurations through shared Helm charts or startup scripts is crucial to enforce consistency across your environment.
Furthermore, teams often encounter the problem of span noise. Auto-instrumentation, by default, captures a wide array of spans, including HTTP calls, database queries, and Kafka consumer operations. Without some form of filtering or sampling, your observability backend can quickly become overwhelmed with low-value telemetry. This is precisely where the OpenTelemetry Collector becomes indispensable: it provides a central point to process, reduce, and enrich signals before they are exported to your chosen backend.
Finally, correlation challenges can emerge, particularly when applications utilize custom asynchronous frameworks or unique concurrency models. While the OpenTelemetry agent excels at propagating context across known libraries, in these more bespoke scenarios, traces may become fragmented, making it difficult to follow the complete flow of a request. In such cases, selective manual instrumentation, particularly around thread boundaries or custom async operations, can be vital to close these gaps and ensure end-to-end trace integrity.
Bringing It Together: The Right Approach for You
There’s no universal answer to the question “How should I instrument my Java app?” The best approach ultimately depends on your team, your platform, and your specific observability goals. However, a recommended hierarchy can guide your choices:
Prioritize the Operator if you can. No-touch instrumentation via the OpenTelemetry Operator is what truly makes observability a default, not an afterthought. By treating instrumentation like a platform configuration rather than application code, you enable unparalleled speed, consistency, and scale across your services. It's the most seamless way to ensure all your applications are observable from day one.
Consider adding hybrid enrichment if it makes sense for your business context. Even with the Operator or auto-instrumentation, you can easily add meaningful attributes to existing spans using the OpenTelemetry API. This lightweight enrichment, achieved by including just the OpenTelemetry API packages in your application, allows your observability data to speak the language of your business without deep SDK integration.
Only use manual instrumentation if you are truly sure what you are doing and why. While manual instrumentation gives precision and is ideal for custom structures or deep integration within libraries, it's verbose and can introduce fragility if used as the default across all services. Reserve it for very specific, well-understood scenarios where other methods fall short.
In practice, many teams end up with a mix of these approaches, guided by this hierarchy. Services deployed with the Operator will gain default observability, with hybrid enrichment selectively applied for key business attributes. Other applications might rely on direct auto-instrumentation. A few critical flows might still use targeted manual instrumentation for precise control. OpenTelemetry is designed to support and evolve with this adaptable strategy.
Your Playground: The Example Repo
If you want to see all of this in action, our example repo is a good place to start. It features a simple todo app with three services:
- A
frontendthat triggers HTTP requests and renders tasks - A
todo-servicethat stores tasks in MySQL and emits spans via the agent - A
validation-servicethat checks for profanity and enriches spans with custom logic
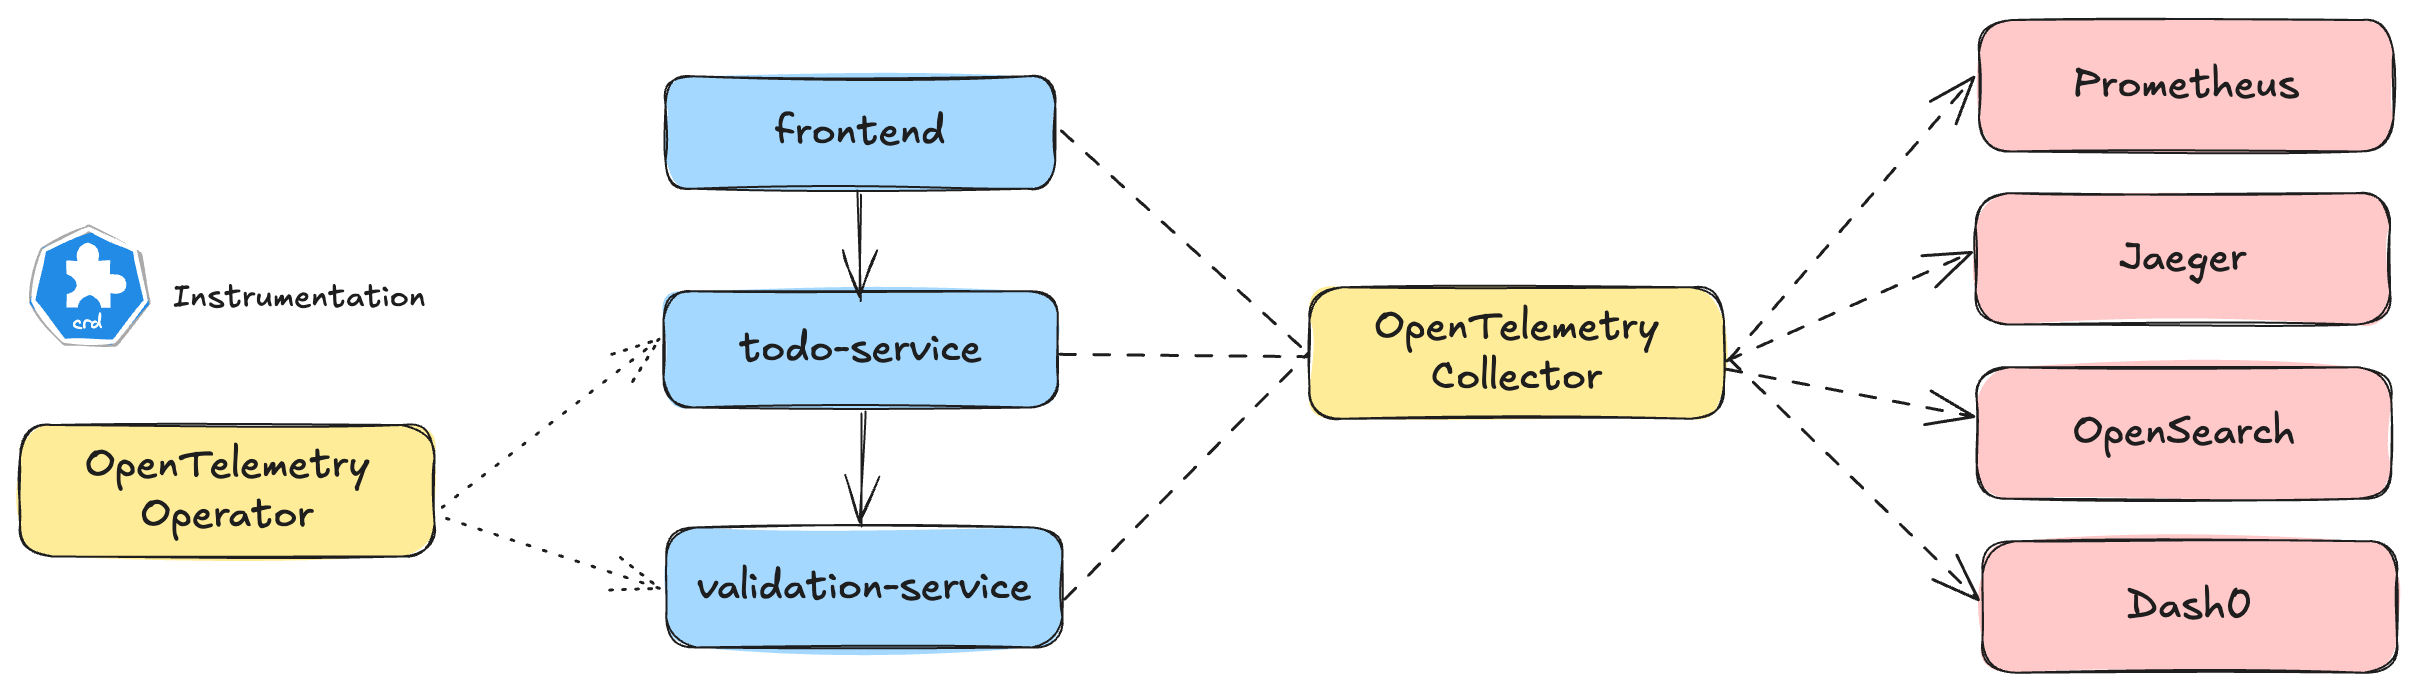
The OpenTelemetry Collector collects all telemetry and exports it to Jaeger, OpenSearch, Prometheus, and Dash0. Everything is wired, observable, and ready for experimentation. This isn’t a toy app. It’s the minimal real-world scaffolding for learning OpenTelemetry in Java - and adapting those patterns to your own system.

Framework Compatibility Note: Spring Boot, Quarkus, and Agent Pitfalls
Before you roll out the OpenTelemetry Java Agent across every service, keep one thing in mind: some frameworks already provide OpenTelemetry instrumentation natively - and don’t always play well with the agent.
If you're using frameworks like Spring Boot, Quarkus, or Micronaut, double-check how they integrate with OpenTelemetry. Here's a quick rundown:
Spring Boot
Spring Boot offers an official OpenTelemetry Starter that wires tracing into your application via the Actuator and Micrometer.
- It works well as a standalone setup, and is officially supported by the OpenTelemetry community.
- If you’re using the Spring Boot Starter, you can combine it with the Java agent - but you’ll want to validate which instrumentations overlap, and disable conflicting ones if needed.
For more information check out OpenTelemetry Spring Boot Starter and Spring Observability Reference.
Quarkus
Quarkus, on the other hand, takes a different stance:
“The use of the OpenTelemetry Agent is not needed nor recommended.” - OpenTelemetry for Quarkus
That’s because the Quarkus OpenTelemetry Extension adds instrumentation directly into the build - and the agent won’t work in native mode at all. If you're using Quarkus:
- Use the Quarkus OTel extension, not the Java agent.
- Disable auto-instrumentation in the OpenTelemetry Operator for those workloads, either by skipping injection or using annotations like:
1instrumentation.opentelemetry.io/inject-java: "false"
Micronaut
Micronaut supports OpenTelemetry via its own tracing module. While it's not as deeply integrated as Quarkus, it’s still wise to check for overlaps if you’re using both the agent and the Micronaut OTel extension.
The key takeaway? If your framework already instruments your app, don’t double up. It leads to duplicated spans, broken traces, or worse - spans that simply don’t appear.
Final Thoughts
Making Java observable is no longer about reinventing the wheel. OpenTelemetry provides a robust and flexible framework that transforms observability from a potential burden into a strategic advantage. Whether you seek granular control, rapid insights, or unwavering operational consistency, OpenTelemetry offers a model that works for diverse organizational needs. Ultimately, the true value lies not in the sheer volume of telemetry emitted, but in its ability to empower your team to clearly see what’s happening, efficiently diagnose and fix issues, and continuously improve what truly matters to your business.
The recommended path is clear: start with the powerful, low-friction auto-instrumentation agent. Incrementally add business context where it provides the most value. And as your services and organization scale, leverage platform-level automation, such as the OpenTelemetry Operator or the dash0-operator, to handle the heavy lifting of agent injection and configuration. This progressive adoption ensures that observability becomes an inherent, seamless part of how you build and operate applications, rather than merely a debugging tool.
