Last updated: June 29, 2026
OTLP gRPC Exporter: A Practical Guide
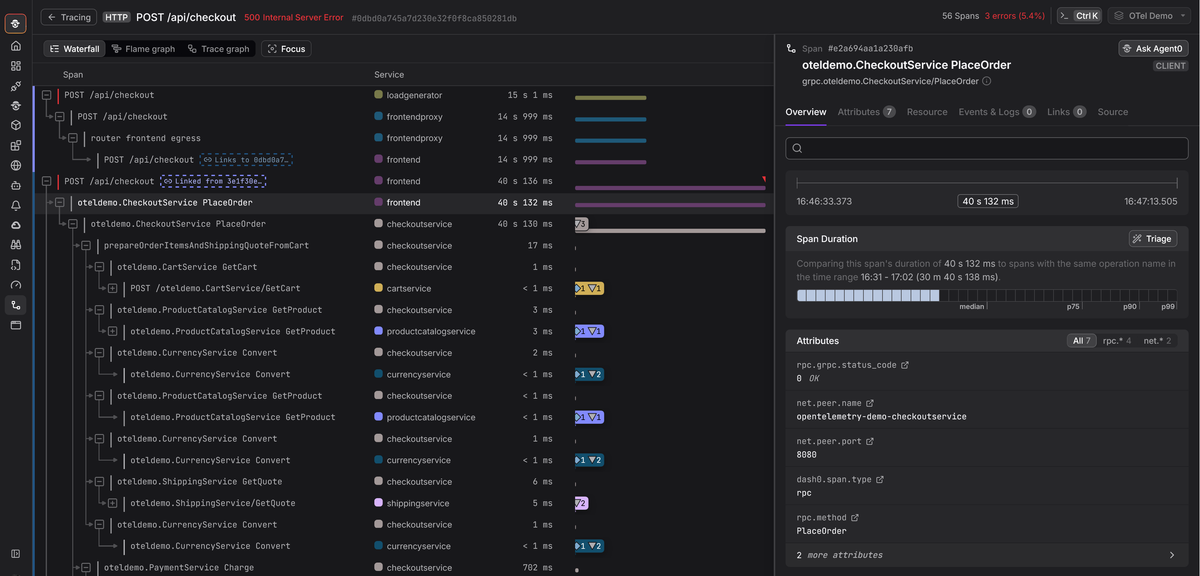
The OTLP gRPC exporter is how most OpenTelemetry Collectors ship data, whether that's to another Collector, a managed backend, or something like Jaeger running in your cluster. It speaks the native OTLP protocol over gRPC, which makes it the fastest and most broadly supported option for getting telemetry out of the Collector.
The defaults get you running quickly, but production deployments need more thought. This guide walks through the exporter's connection settings, authentication, TLS, compression, and load balancing.
Quick start: sending traces to Jaeger
The OTLP exporter has two fundamental requirements: knowing where to send data
(endpoint) and how to secure the connection (tls).
To see it in action, let's create a pipeline through Docker Compose. This setup
uses
telemetrygen
to generate trace data, sends it to an OpenTelemetry Collector through the
OTLP receiver, and
then forwards it to a Jaeger instance using the otlp_grpc exporter.
Here's the Collector configuration you'll need:
123456789101112131415161718# otelcol.yamlreceivers:otlp:protocols:grpc:endpoint: 0.0.0.0:4317exporters:otlp_grpc/jaeger:endpoint: jaeger:4317tls:insecure: trueservice:pipelines:traces:receivers: [otlp]exporters: [otlp_grpc/jaeger]
Notice the /jaeger suffix on the otlp_grpc exporter. It's a
naming convention
in the Collector that lets you create multiple instances of the same component
type after the component identifier.
The name is arbitrary and only needs to be unique within its component class. It doesn't change behavior, but it makes configs easier to read and is especially useful when you're exporting to more than one destination.
Next, create a docker-compose.yml file in the same directory that defines the
three necessary services:
123456789101112131415161718192021222324# docker-compose.ymlservices:otelcol:image: otel/opentelemetry-collector-contrib:0.153.1container_name: otelcolvolumes:- ./otelcol.yaml:/etc/otelcol-contrib/config.yamlrestart: unless-stoppeddepends_on:- jaegerjaeger:image: jaegertracing/jaeger:2.18.0container_name: jaegerports:- 16686:16686telemetrygen:image: ghcr.io/open-telemetry/opentelemetry-collector-contrib/telemetrygen:v0.152.0container_name: telemetrygenrestart: unless-stoppedcommand: ["traces", "--rate", "10", "--duration", "1h", "--otlp-endpoint", "otelcol:4317", "--otlp-insecure"]depends_on:- otelcol
In this setup, telemetrygen sends traces to the Collector on port 4317, which
receives them over OTLP
and forwards them to Jaeger using the otlp_grpc exporter.
With both files in place, start the services with:
1docker compose up -d
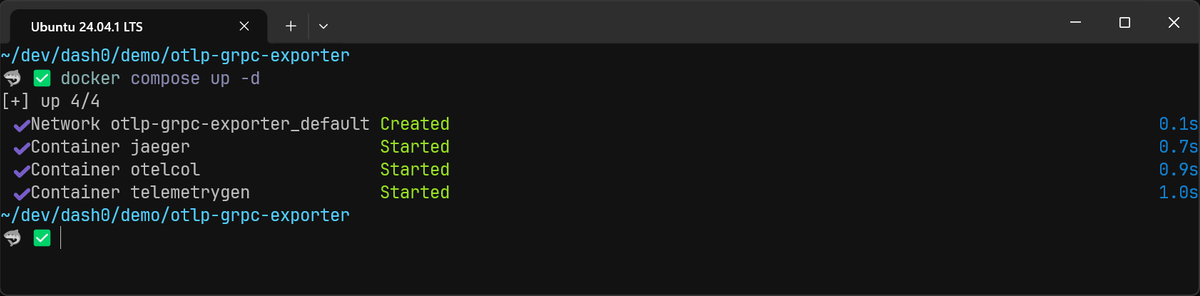
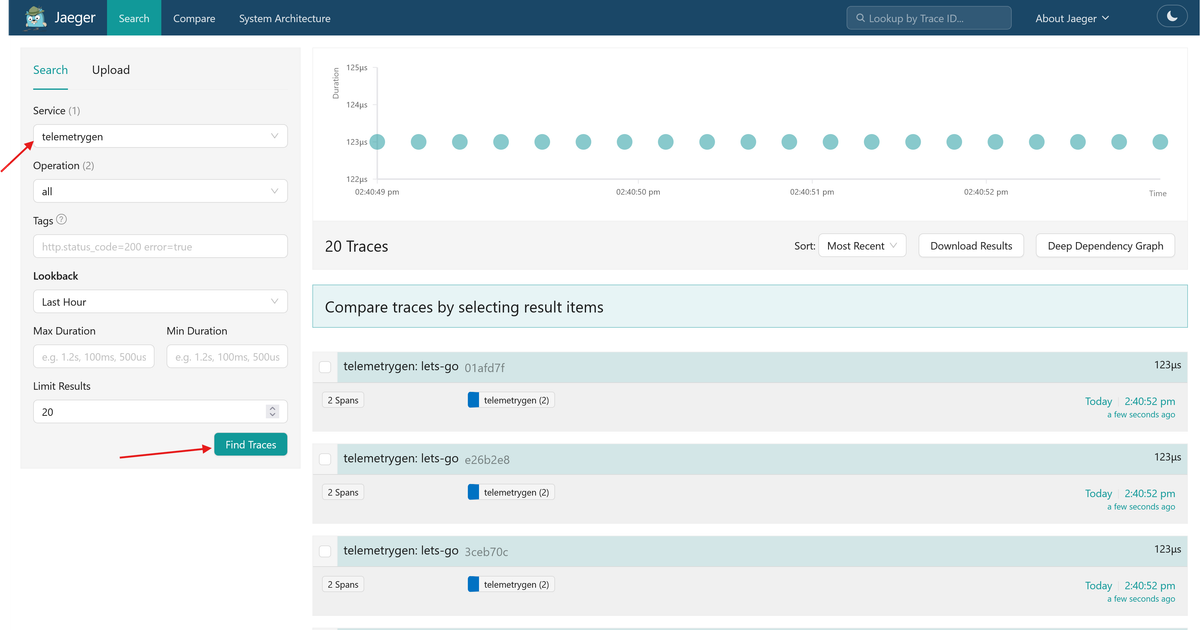
Once you've confirmed that all three services are up and running, verify the
pipeline by navigating to http://localhost:16686 in your browser. Then select
the telemetrygen service from the search panel to see the incoming traces:
Understanding the core exporter settings
The otlp_grpc exporter comes with quite a few knobs you can turn, but in most
setups you'll only need to worry about a handful of core settings.
Choosing an endpoint
This is the host:port of the gRPC server you want to send your telemetry data
to. DNS names are supported alongside IP addresses, and they become especially
useful when you need client-side load balancing across multiple backends (more
on that in the
load balancing section).
1234# otelcol.yamlexporters:otlp_grpc:endpoint: my-backend.example.com:4317
See the gRPC naming documentation for the full list of valid URI formats.
Authenticating with headers
If the receiving endpoint requires an API key or other credentials, you can attach custom gRPC metadata headers. These are sent with every export request:
12345678# otelcol.yamlexporters:otlp_grpc:endpoint: ingress.eu-west-1.aws.dash0.com:4317headers:# The header key is case-insensitiveAuthorization: "Bearer <your-secret-api-key>"Dash0-Dataset: "<dash0-demo>"
Static headers work well when your credentials are fixed strings that you can inject from environment variables or a secrets manager. For anything more dynamic, like OAuth2 tokens that need periodic refresh or cloud-provider credentials that rotate automatically, the Collector's authentication extensions are a better fit.
Extensions like
oauth2client
and
bearertokenauth
handle token lifecycle for you and plug directly into the exporter through the
auth field.
Picking a compression algorithm
OTLP data is quite verbose, so the exporter compresses payloads before sending
them. The default is gzip, which is a solid starting point for most
deployments, but zstd often compresses better at similar or faster speeds, so
it's worth switching to if your backend supports it.
If you prefer to trade compression ratio for lower CPU usage, which can help if
the Collector is CPU-bound and you have bandwidth to spare, then you can try the
snappy algorithm. You can also set compression: none to disable compression
entirely.
12345# otelcol.yamlexporters:otlp_grpc:endpoint: my-backend.example.com:4317compression: zstd
Securing the connection with TLS
Even though telemetry data shouldn't include sensitive information, it still reveals how your systems behave, which endpoints exist, how services communicate, and where errors occur. TLS keeps that information encrypted in transit and prevents tampering.
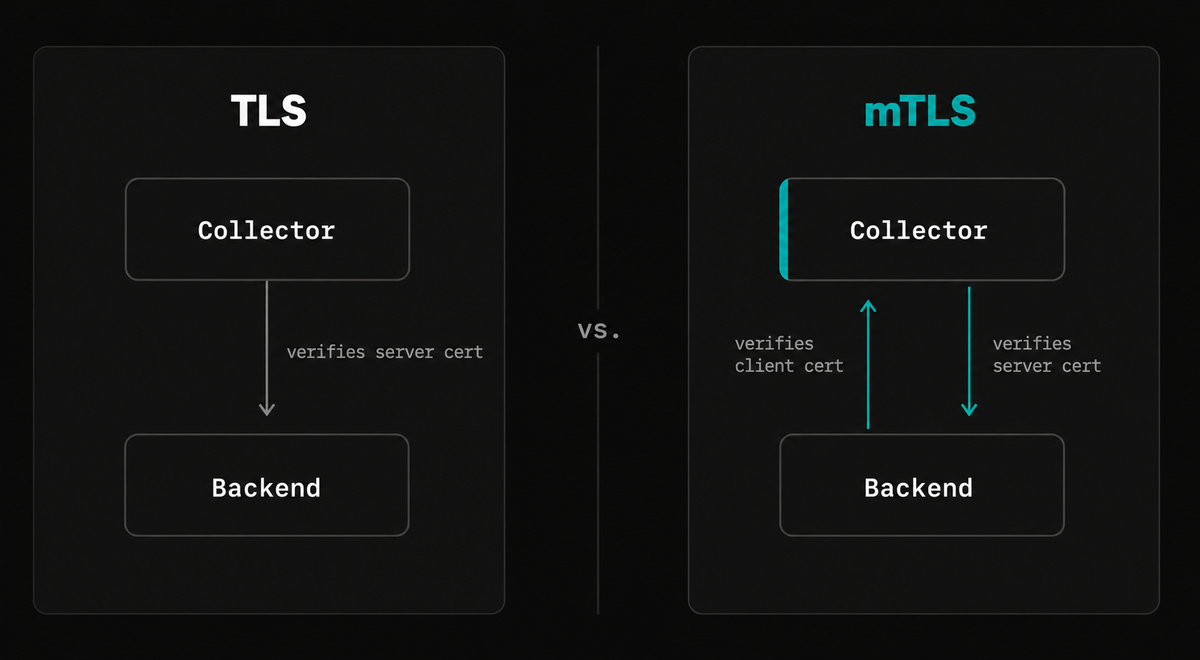
The exporter enables TLS by default, so if you're sending data to a public endpoint with a certificate from a trusted Certificate Authority (CA), there's nothing extra to configure:
1234exporters:otlp_grpc:endpoint: secure-endpoint.com:4317# tls is implicitly enabled by default
For Collector-to-Collector traffic inside your own infrastructure, you'll likely want mutual TLS (mTLS), where both sides verify each other's identity. The exporter needs a client certificate and private key, plus the CA certificate that signed the server's certificate:
123456789exporters:otlp_grpc:endpoint: internal-gateway.my-corp:4317tls:# CA certificate to verify the server's identityca_file: /etc/ssl/certs/ca.pem# Client certificate for the server to verify our identitycert_file: /etc/ssl/certs/client.pemkey_file: /etc/ssl/private/client.key
The receiving Collector also needs to be configured to trust the CA that signed the client certificate. Our OTLP receiver guide covers that setup.
For the full list of TLS options (custom cipher suites, minimum TLS version, reload intervals), see the Collector's TLS configuration reference.
Queuing, batching, and retries
The OTLP gRPC exporter's resilience features (sending queue, retry logic, exporter-level batching, and timeouts) come from the Collector's shared exporter helper framework.
Every exporter that sends data over a network uses the same configuration blocks, so we cover them in a dedicated guide rather than repeating them here.
Setting up client-side load balancing
When your endpoint DNS name resolves to multiple IP addresses, the
balancer_name setting controls how the exporter distributes connections across
them.
The current default is round_robin, which connects to all resolved addresses
and distributes gRPC calls evenly. The legacy default, pick_first, connects to
a single address with no load balancing
(see the change).
For round_robin to work, the endpoint needs to resolve to multiple addresses.
In Kubernetes, that means a headless service. In other environments, a DNS
record with multiple A or AAAA records does the same thing.
1234exporters:otlp_grpc:endpoint: dns:///my-collectors-headless.default.svc.cluster.local:4317balancer_name: round_robin
This spreads load across a fleet of Collectors without needing an external load balancer.
Tuning gRPC settings
The exporter exposes additional gRPC options like keepalive (for detecting
dead connections through firewalls or load balancers) and write_buffer_size.
These are protocol-level settings rather than exporter-specific ones. If you
need to tune them, see the exporter's
full configuration reference.
Final thoughts
The OTLP gRPC exporter doesn't need much configuration to start shipping data, but the gap between "working" and "working in production" is mostly in the details covered here: TLS, compression, authentication, and load balancing across a fleet of backends. For the resilience side (queuing, retries, batching), see the companion exporter helper guide.
To see your pipeline in action with a production backend, you can point the exporter at Dash0 and have traces, metrics, and logs queryable in under a minute.