Last updated: September 23, 2026
Sending OpenTelemetry Metrics to Prometheus (OTLP Ingestion)
OpenTelemetry can produce metrics, and Prometheus can store them. Since Prometheus accepts the OpenTelemetry Protocol (OTLP) directly, using the two together looks straightforward.
The catch is that Prometheus doesn't store OpenTelemetry metrics unchanged; it translates them into its own representation. This changes how some of that data is named, stored, queried, and interpreted once it reaches Prometheus.
This article follows OpenTelemetry metrics through that translation so you can see what Prometheus stores, which defaults matter, and where the two models don't line up cleanly.
For the reverse direction, where an OpenTelemetry Collector scrapes Prometheus endpoints and converts the metrics to OTLP, see Collecting Prometheus metrics with the OpenTelemetry Collector.
Where the translation happens
The ingestion path determines where OpenTelemetry metrics become Prometheus metrics.
If the Collector exports through Prometheus Remote Write or exposes a Prometheus endpoint for scraping, the Collector performs that conversion first. By the time the data reaches Prometheus, it has already been adapted to the Prometheus model.
With direct OTLP ingestion, Prometheus performs the translation:
123456789101112OpenTelemetry SDK or Collector|OTLP exporter|vPrometheus OTLP receiver|OTel -> Prometheustranslation|vTSDB
That translation is what the rest of this article examines. It affects metric names, resource attributes, temporality, histograms, exemplars, and some of the operational behavior associated with Prometheus's scrape model.
Prometheus controls much of this behavior through its otlp configuration and a
small number of feature flags. Understanding those defaults is the difference
between seeing a metric arrive exactly where you expect and wondering why its
name, labels, or values changed along the way.
Getting OTLP into Prometheus
Prometheus can receive OTLP metrics directly over HTTP, but its OTLP receiver is disabled by default so you must enable it when starting Prometheus:
1prometheus --web.enable-otlp-receiver
Note that enabling the OTLP receiver adds a write endpoint, so don't expose it to untrusted networks without authentication and TLS.
Prometheus accepts OTLP metrics at /api/v1/otlp/v1/metrics. Since this differs
from the standard OTLP/HTTP metrics path of /v1/metrics, you'll typically want
to configure the OTEL_EXPORTER_OTLP_METRICS_ENDPOINT environment variable
explicitly:
12export \OTEL_EXPORTER_OTLP_METRICS_ENDPOINT=http://localhost:9090/api/v1/otlp/v1/metrics
Be careful not to set this variable to the base path /api/v1/otlp. Unlike
OTEL_EXPORTER_OTLP_ENDPOINT (used for all signals), the metrics-specific
variable is used as-is and doesn't append /v1/metrics automatically.
If you're using the Collector, you can either set endpoint to the base URL and
let the otlp_http exporter append /v1/metrics:
1234# otelcol.yamlexporters:otlp_http/prometheus:endpoint: http://prometheus:9090/api/v1/otlp
Or set metrics_endpoint to the complete Prometheus ingestion URL:
1234# otelcol.yamlexporters:otlp_http/prometheus:metrics_endpoint: http://prometheus:9090/api/v1/otlp/v1/metrics
As with the SDK, don't put the full /v1/metrics path in endpoint, since the
exporter will append it again.
Prometheus's OTLP receiver supports HTTP, not OTLP/gRPC, so configure the SDK to use OTLP/HTTP with Protocol Buffers for metrics:
1export OTEL_EXPORTER_OTLP_METRICS_PROTOCOL=http/protobuf
The default metric export interval can make a working setup seem broken while you're testing it. OpenTelemetry SDKs commonly export metrics every 60 seconds, so you may want to shorten the interval to 15 seconds:
1export OTEL_METRIC_EXPORT_INTERVAL=15000
It's also necessary to set service.name and a unique service.instance.id for
each service instance as these attributes are used to build the job,
instance, and target_info relationships we'll look at later.
12export OTEL_SERVICE_NAME="checkout"export OTEL_RESOURCE_ATTRIBUTES="service.instance.id=$(uuidgen)"
Prometheus recommends enabling out-of-order ingestion for OTLP pipelines because batching, retries, and multiple Collector replicas can reorder samples which them to arrive out of timestamp order.
Configure an acceptance window in prometheus.yml. The appropriate duration
depends on how much delay your pipeline can introduce:
1234# prometheus.ymlstorage:tsdb:out_of_order_time_window: 30m
Allowing out-of-order ingestion adds TSDB overhead and can increase memory, write-ahead-log, and query costs as the window grows, so tune it against the delay you actually observe.
If metrics aren't arriving, start at the sender before checking Prometheus. For
the Collector,
inspect exporter failures
and queue pressure with metrics such as
otelcol_exporter_send_failed_metric_points and otelcol_exporter_queue_size.
Also check the HTTP response from Prometheus, since a 400 response may include
the translation error directly in the body.
If the request reached Prometheus, its own /metrics endpoint can then help
narrow down ingestion and translation problems through the following metrics:
123prometheus_api_otlp_appended_samples_without_metadata_totalprometheus_api_otlp_out_of_order_exemplars_totalprometheus_api_otlp_translation_warnings_total
prometheus_api_otlp_translation_warnings_total is particularly useful when
OpenTelemetry metric names or attributes can't be translated cleanly into the
Prometheus data model. We'll look at those translation rules next.
How Prometheus translates OTLP metrics
Once Prometheus receives an OTLP request, it converts the OpenTelemetry data into the representation Prometheus stores and queries.
By default, that conversion includes several changes:
- Metric and attribute names are normalized to Prometheus naming conventions.
- Metric units and types can add suffixes such as
_seconds,_bytes, and_total. - Metric attributes become Prometheus labels.
- Resource attributes like
service.name,service.namespace, andservice.instance.idare mapped to the familiarjobandinstancelabels. - Other resource attributes are attached to a generated
target_infometric rather than copied onto every metric series unless you explicitly promote them. - Explicit-bucket histograms become Prometheus classic histograms, producing
_bucket,_count, and_sumseries. - OpenTelemetry exponential histograms are converted to Prometheus native histograms.
- Delta metrics aren't stored as delta values by default. Prometheus requires additional handling to convert or ingest them.
The first place you'll usually notice that translation is the metric name, so let's look at that first.
How Prometheus rewrites OTLP metric names
By default, Prometheus doesn't preserve OpenTelemetry metric and attribute names
exactly as they arrive. Its default UnderscoreEscapingWithSuffixes translation
strategy normalizes names and adds Prometheus-style suffixes based on the
metric's unit and type.
For metric names, characters outside [a-zA-Z0-9_:] are replaced with
underscores, and label names are normalized similarly, using [a-zA-Z0-9_].
Prometheus also translates supported UCUM units into words and appends them to
the metric name.
For example, an OTel counter named system.network.io with unit By is stored
as:
1system_network_io_bytes_total
An explicit-bucket histogram named http.server.request.duration with unit s
is exposed as the familiar Prometheus histogram series:
123http_server_request_duration_seconds_buckethttp_server_request_duration_seconds_counthttp_server_request_duration_seconds_sum
This applies regardless of translation strategy, because that decomposition is how the Prometheus data model represents a histogram rather than a suffix any strategy appends.
Unit translation can also change names in ways that aren't obvious from the OTel instrument itself. Common mappings include:
12345s -> secondsms -> millisecondsBy -> bytesBy/s -> bytes_per_second% -> percent
Annotations in braces, such as {request}, are dropped when constructing the
unit suffix. Prometheus also avoids adding a unit suffix when the metric name
already ends with that unit.
Dimensionless metrics need special attention. Unit 1 doesn't add a unit suffix
by itself, but a gauge with that unit receives _ratio. For example:
1process.cpu.utilization
becomes:
1process_cpu_utilization_ratio
You can change this behavior with the translation_strategy setting in the
otlp configuration:
123# prometheus.ymlotlp:translation_strategy: UnderscoreEscapingWithSuffixes
Prometheus currently supports four strategies:
-
UnderscoreEscapingWithSuffixes(default) escapes names and adds unit and type suffixes (system.network.iobecomessystem_network_io_bytes_total). -
NoUTF8EscapingWithSuffixeskeeps UTF-8 names but still adds unit and type suffixes (system.network.iobecomessystem.network.io_bytes_total) -
UnderscoreEscapingWithoutSuffixesescapes names without adding unit or type suffixes (system.network.iobecomessystem_network_io). -
NoTranslationpreserves the original metric name without adding unit or type suffixes.
Changing the strategy later creates differently named series for newly ingested data, so dashboards, alerts, and recording rules may need to query both names during the transition.
Choosing NoUTF8EscapingWithSuffixes or NoTranslation changes how you write
PromQL. While a traditional Prometheus-compatible name can be queried directly:
1http_server_request_duration_seconds_bucket
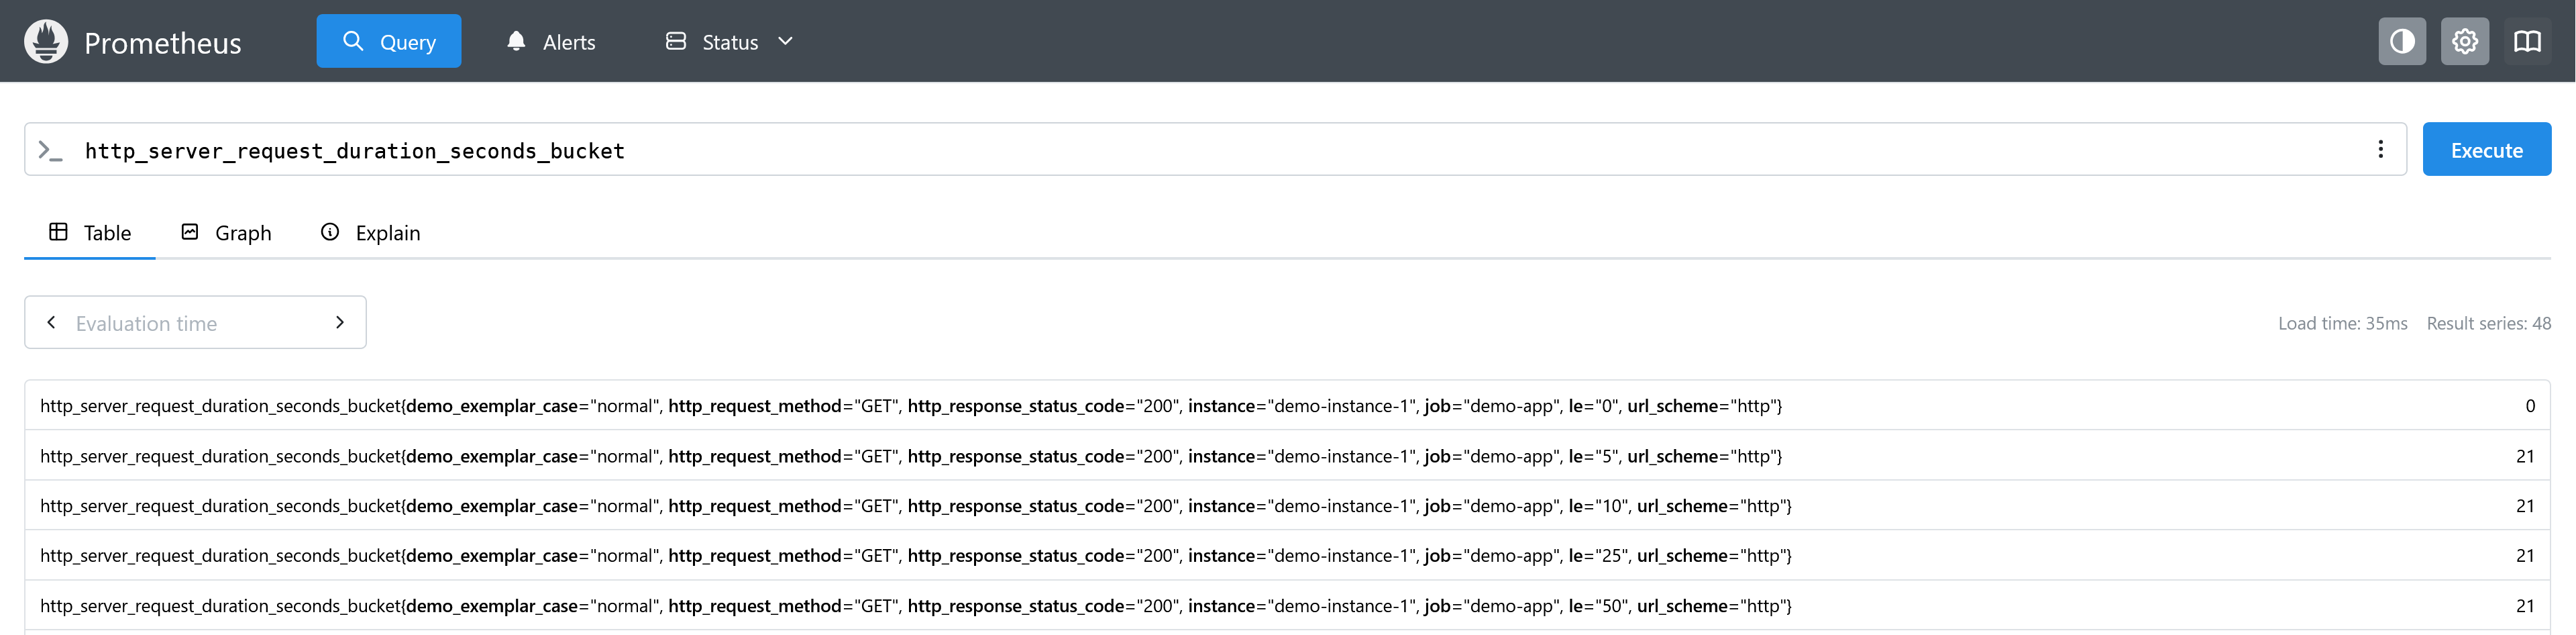
A metric name containing dots must use the quoted selector syntax:
1{"http.server.request.duration_bucket"}
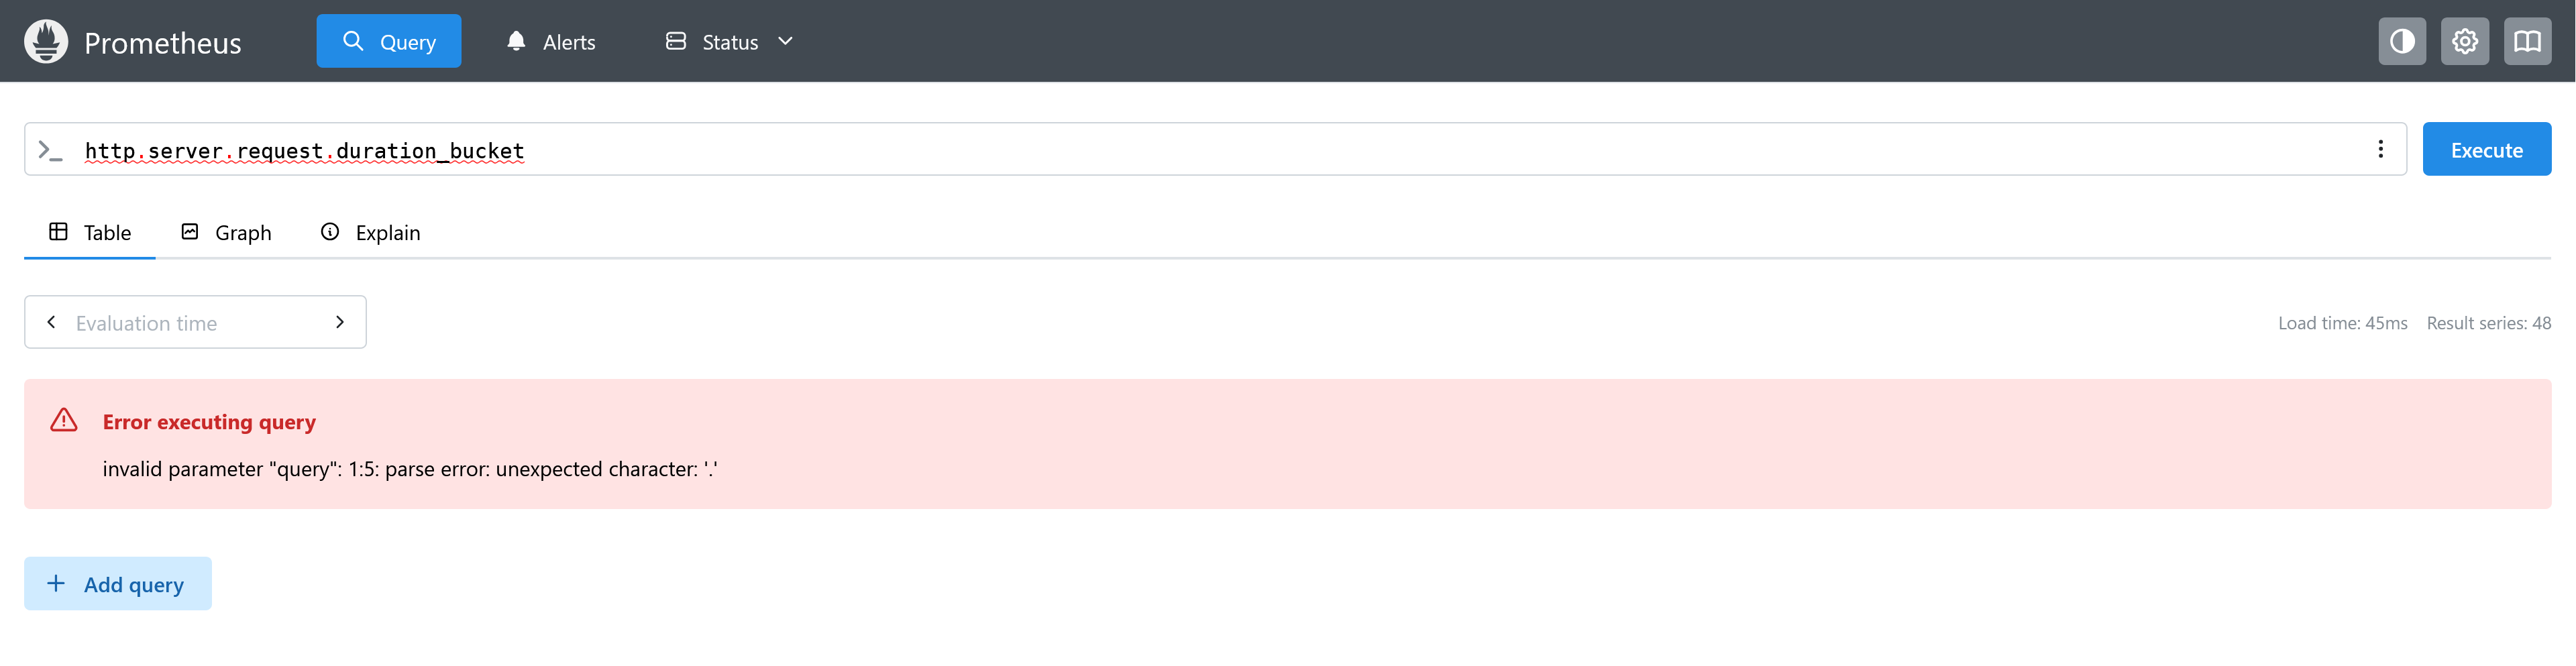
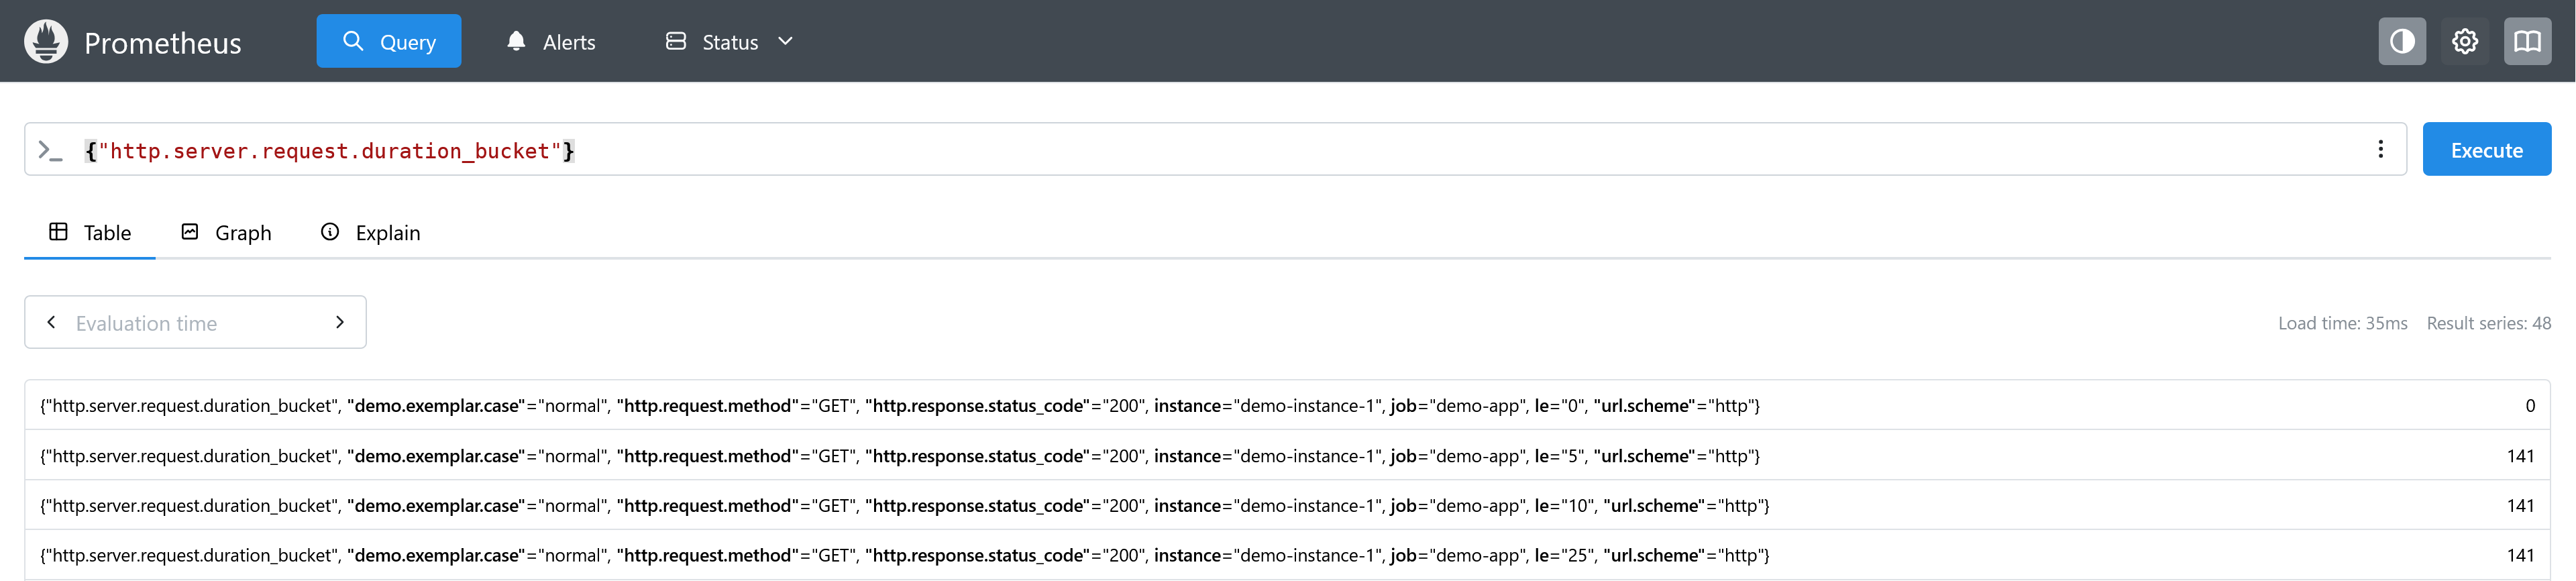
The same applies to label names that contain characters outside the traditional Prometheus label syntax:
1{"http.server.request.duration_seconds_count", "k8s.pod.name"="checkout-7d9f"}
That syntax also carries into alerting rules, recording rules, dashboards, and other PromQL stored in YAML.
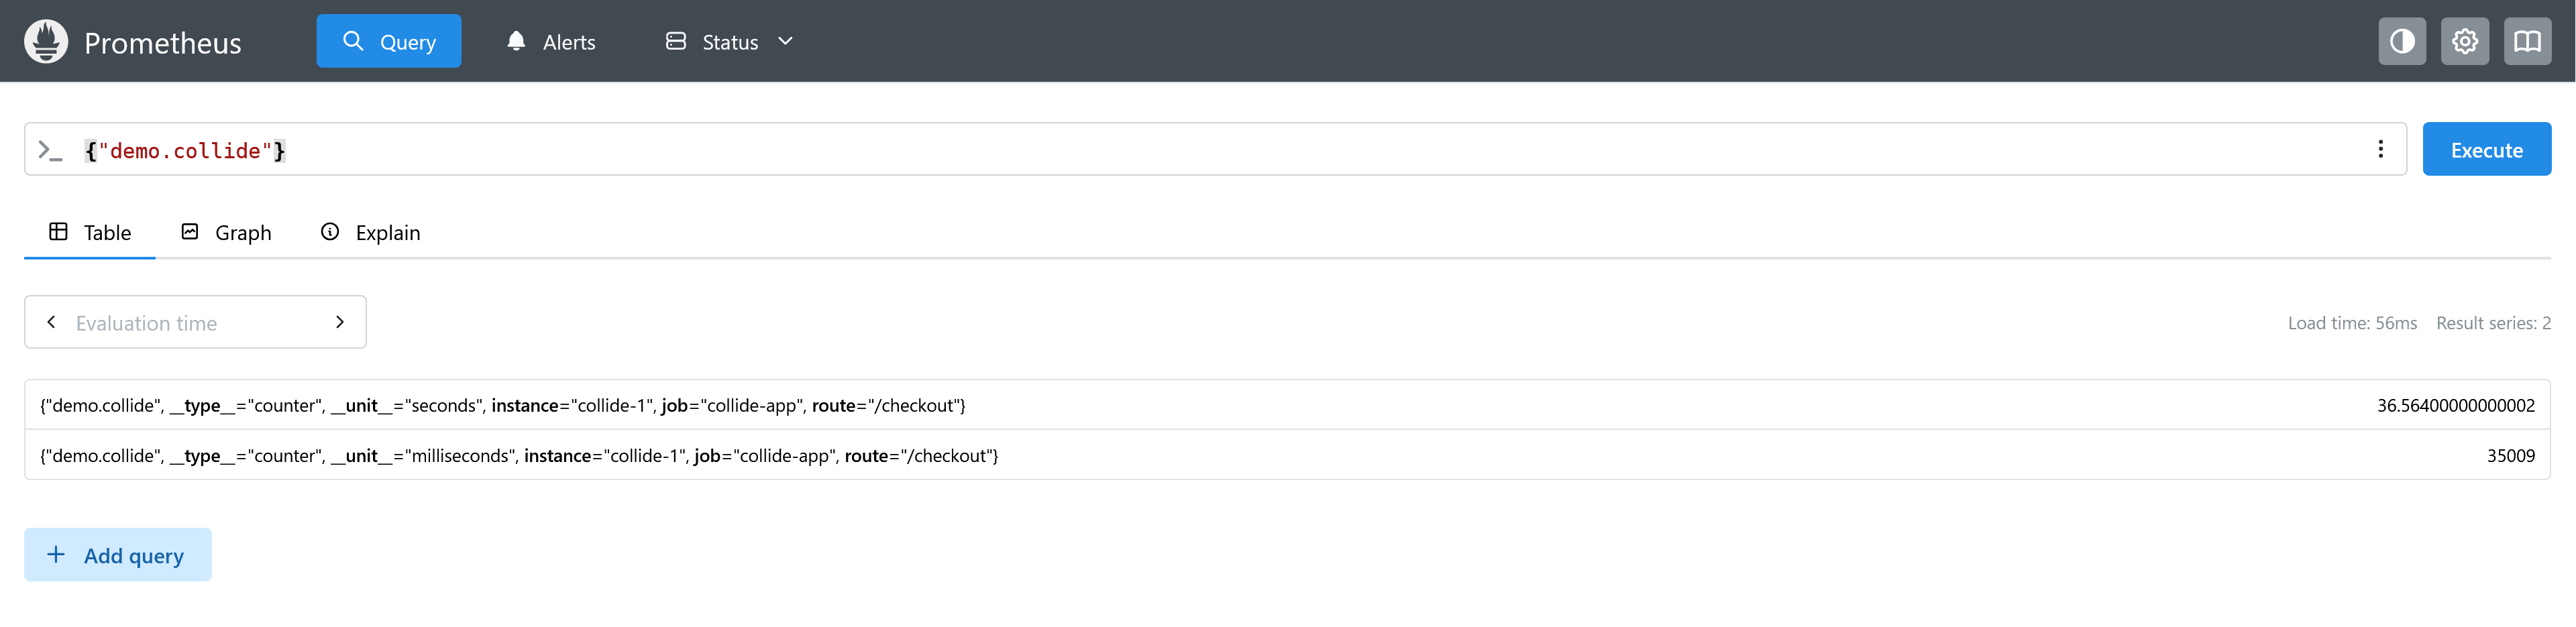
Note that removing unit and type suffixes with NoTranslation can cause
distinct OTel instruments to collapse onto the same Prometheus series name. For
example, two metrics named foo.bar with different units can become
indistinguishable once stored under the same name.
The experimental type-and-unit-labels feature exists for this case. When
enabled, it adds reserved __type__ and __unit__ labels from metric metadata
so Prometheus can distinguish otherwise colliding series.
1prometheus --enable-feature=type-and-unit-labels
When two attributes become one label
Two OpenTelemetry attribute keys can map to the same Prometheus label name during translation. When that happens, the values are concatenated with a semicolon, ordered lexicographically by the original attribute keys.
For example, these two attributes:
12foo.bar="a"foo_bar="b"
both translate to foo_bar under the default naming strategy, producing:
1demo_collision_requests_total{foo_bar="a;b"}
Prometheus records these collisions through its OTLP translation warnings counter:
123prometheus_api_otlp_translation_warnings_total{category="label_name_collision"}
If you're troubleshooting a suspected collision, query
prometheus_api_otlp_translation_warnings_total and filter by
label_name_collision.
You can avoid this label-name normalization collision by using NoTranslation.
Since that strategy preserves the original label names, foo.bar and foo_bar
remain distinct.
How Prometheus handles OpenTelemetry resource attributes
Prometheus doesn't attach most OpenTelemetry resource attributes directly to your metric series by default.
Three service attributes get special treatment.
service.namebecomes thejoblabel,service.instance.idbecomesinstance,- When
service.namespaceis present, Prometheus prefixes it tojob.
123service.namespace="shop"service.name="checkout"service.instance.id="checkout-7d9f"
becomes:
12job="shop/checkout"instance="checkout-7d9f"
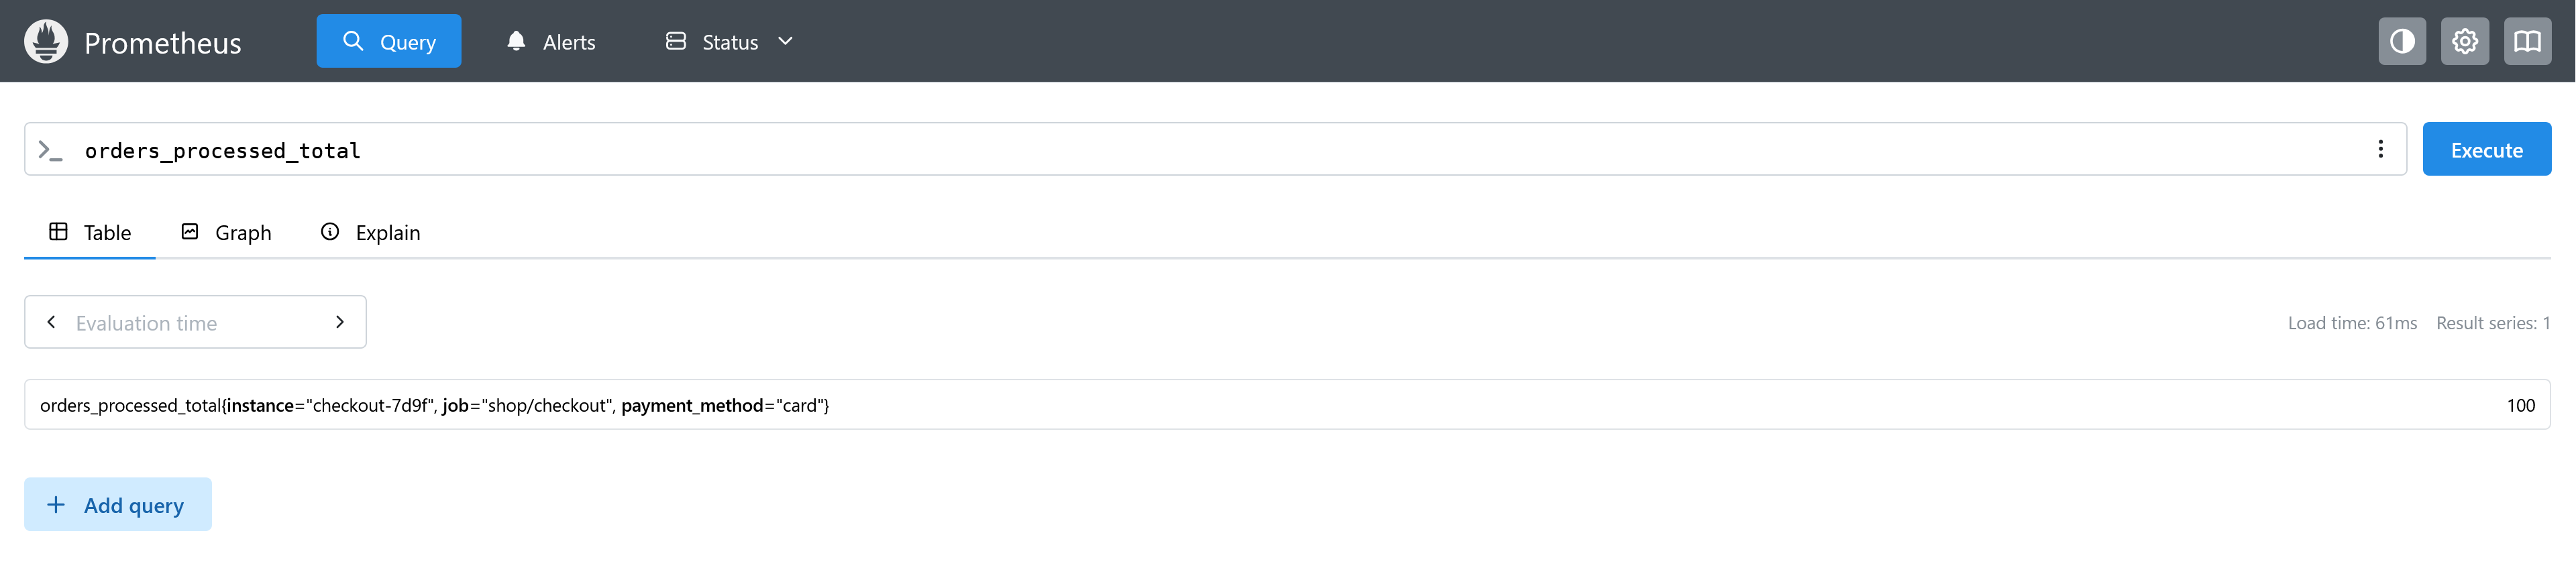
The remaining resource attributes, such as k8s.pod.name,
deployment.environment.name, cloud.region, and service.version, are
written as labels on a separate target_info series instead of being copied
onto every metric series.
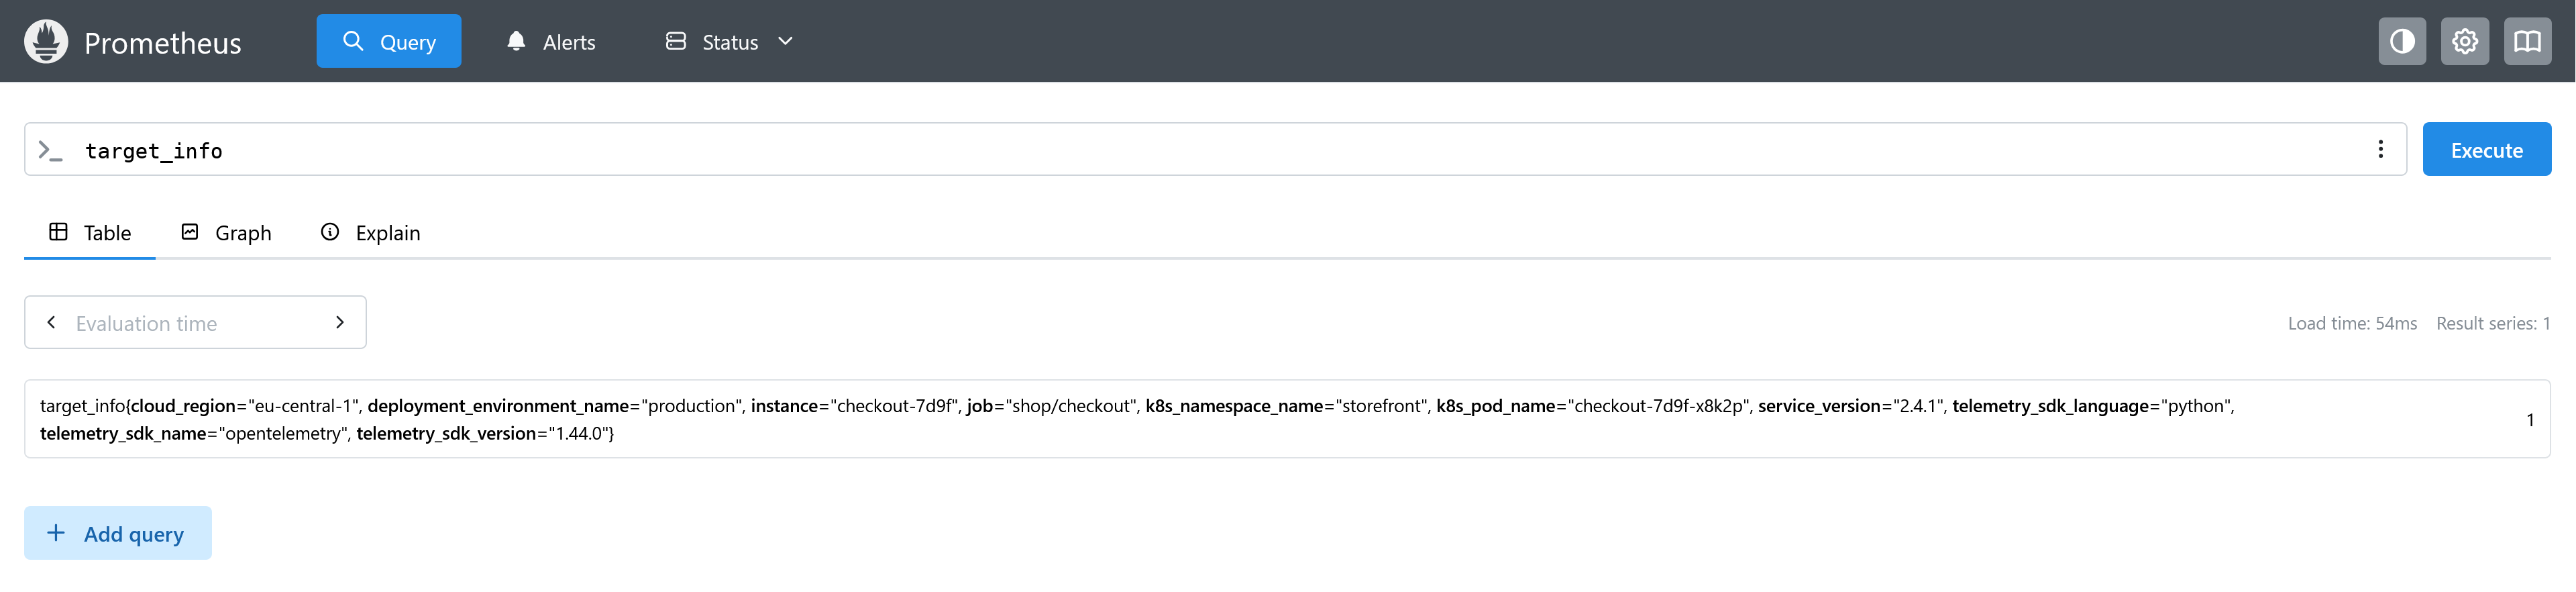
However, Prometheus only generates target_info when the resource contains
service.name, service.instance.id, or both. If neither attribute exists,
there's no corresponding target_info series.
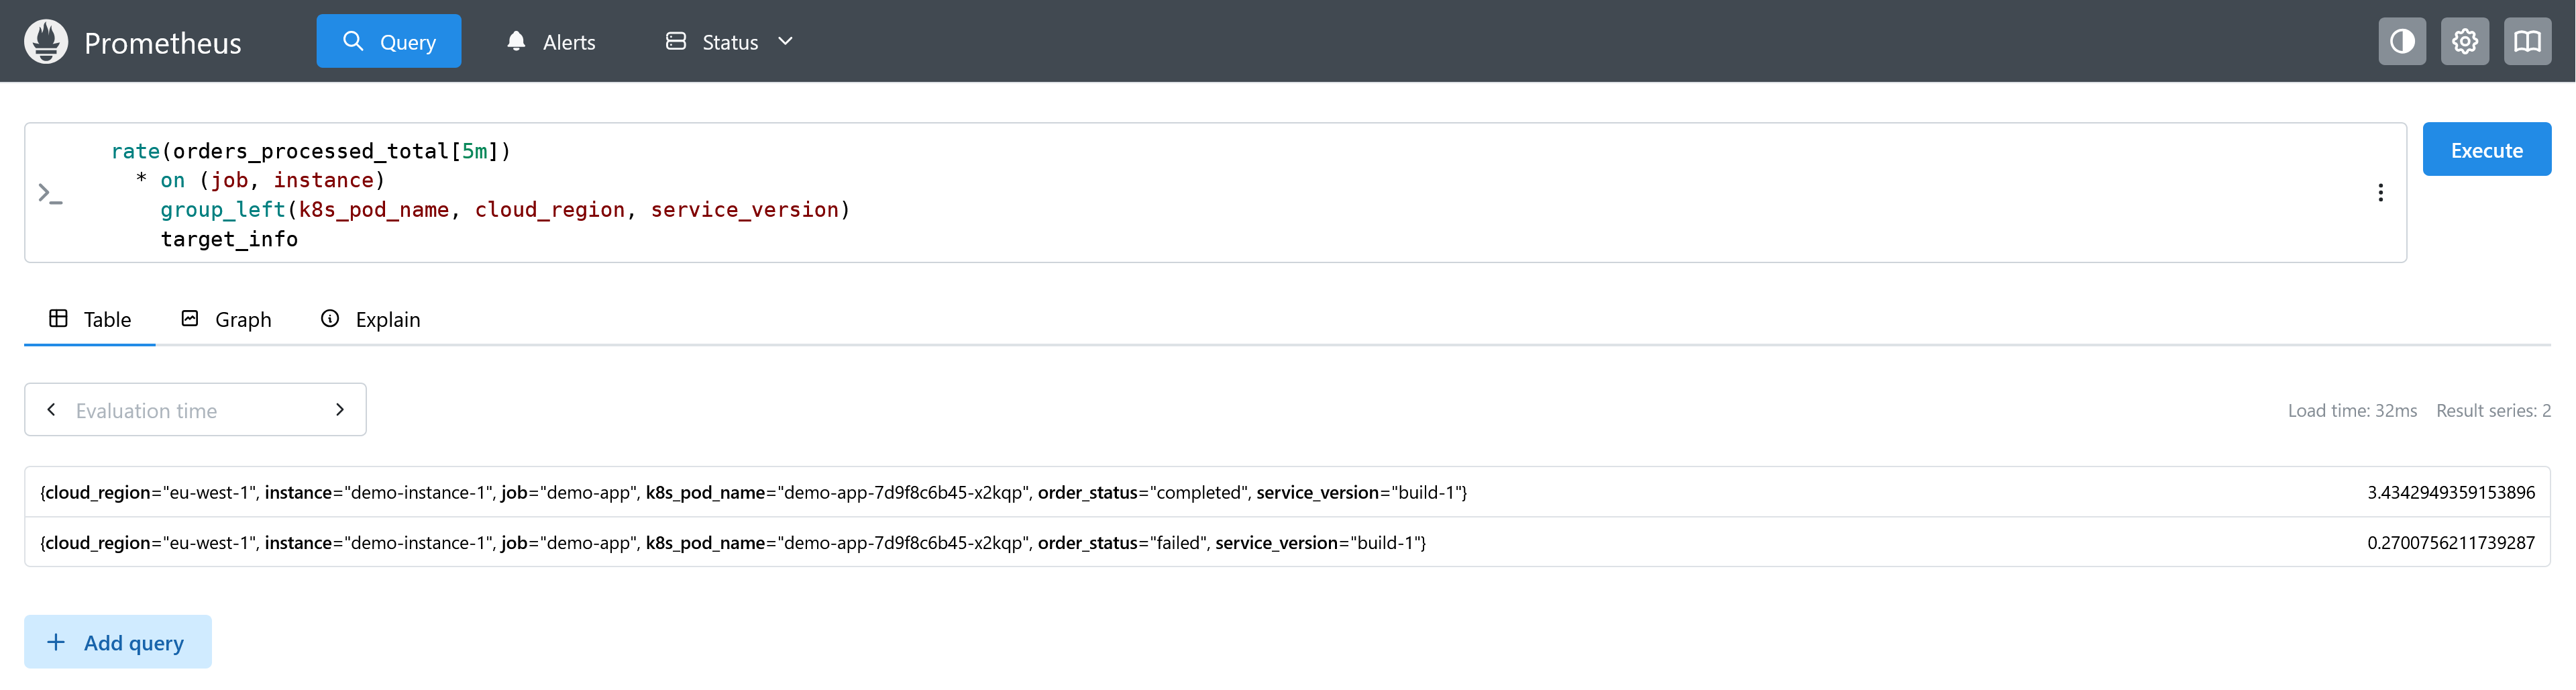
When you want to recover resource attributes that weren't promoted directly, you can join it to a real metric as follows:
1234rate(orders_processed_total[5m])* on (job, instance)group_left(k8s_pod_name, cloud_region, service_version)target_info
Because target_info has the value 1, the multiplication leaves the original
metric value unchanged while adding the selected labels to the result.
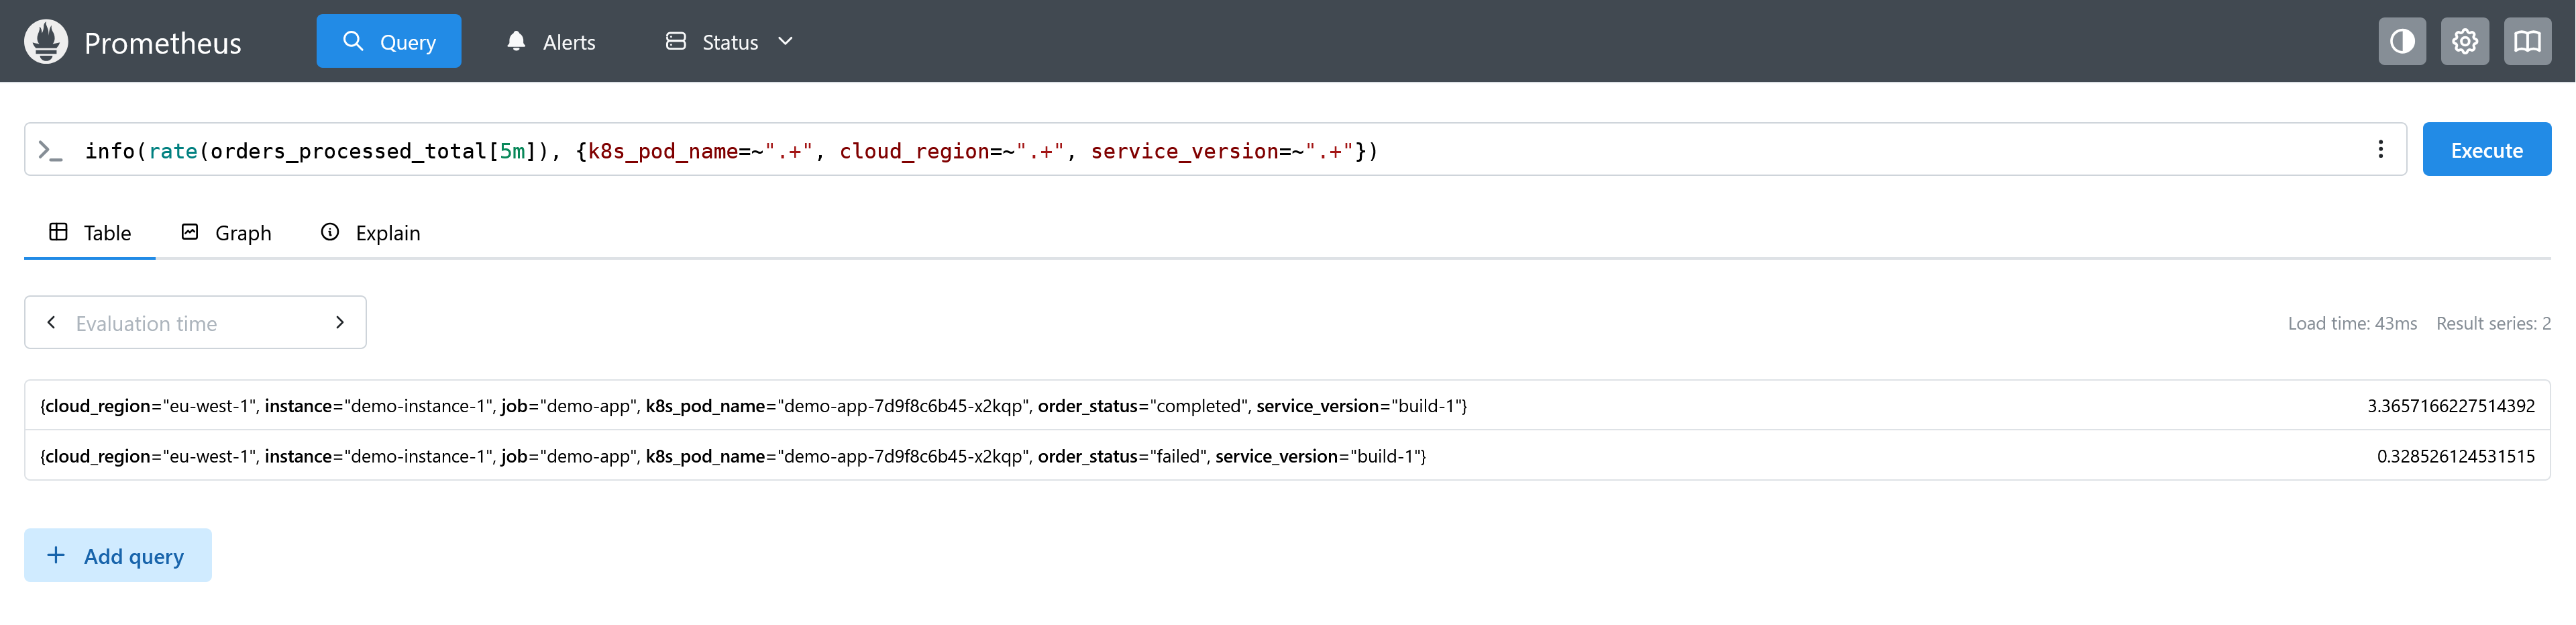
Prometheus also provides the experimental info() function as a more concise
way to do the same thing (currently requires
--enable-feature=promql-experimental-functions):
1info(rate(orders_processed_total[5m]), {k8s_pod_name=~".+", cloud_region=~".+", service_version=~".+"})
Its main advantage is that it handles metadata churn more gracefully. A raw join
can fail temporarily when multiple target_info series exist for the same job
and instance, such as after service.version changes during a deployment.
You'll see a similar error to the one below in that case:
1234found duplicate series for the match group{instance="checkout-7d9f", job="shop/checkout"} on the right hand-side of theoperation: [...service_version="2.5.0"..., ...service_version="2.4.1"...];many-to-many matching not allowed: matching labels must be unique on one side
info() resolves this error by preferring the newest info series. It currently
defaults to target_info and always assumes job and instance are the
identifying labels.
Promoting resource attributes instead of joining
If you don't want to join against target_info at query time, Prometheus can
promote selected resource attributes to labels on every metric series.
For example:
12345678910# prometheus.ymlotlp:promote_resource_attributes:- service.instance.id- service.name- service.namespace- k8s.cluster.name- k8s.namespace.name- k8s.pod.name- deployment.environment.name
Prometheus provides several settings for controlling this behavior:
promote_resource_attributespromotes an explicit list of attributes.promote_all_resource_attributespromotes every resource attribute.ignore_resource_attributesexcludes specific attributes whenpromote_all_resource_attributesis enabled.keep_identifying_resource_attributeskeepsservice.name,service.namespace, andservice.instance.idontarget_infoas well as mapping them to thejobandinstancelabels.
Promoting attributes makes them easier to query because they're available directly on each series, but it can also increase cardinality and time series churn.
High-cardinality attributes, such as pod or container identifiers, can create
many concurrent series. Frequently changing attributes, such as
service.version or a build identifier, can create churn by continually
replacing old series with new ones.
Prometheus publishes a recommended set of resource attributes to promote, covering common service, cloud, container, deployment, and Kubernetes dimensions:
12345678910111213141516171819202122# prometheus.ymlotlp:promote_resource_attributes:- service.instance.id- service.name- service.namespace- service.version- cloud.availability_zone- cloud.region- container.name- deployment.environment- deployment.environment.name- k8s.cluster.name- k8s.container.name- k8s.cronjob.name- k8s.daemonset.name- k8s.deployment.name- k8s.job.name- k8s.namespace.name- k8s.pod.name- k8s.replicaset.name- k8s.statefulset.name
Treat this list as a starting point rather than a default to copy blindly. Promote the attributes you actually need for filtering, grouping, and alerting, and consider how many values they can take and how often those values change.
Instrumentation scope metadata
Instrumentation scope metadata is also opt-in on the OTLP ingest path. You can enable it with:
123# prometheus.ymlotlp:promote_scope_metadata: true
When enabled, Prometheus adds otel_scope_name, otel_scope_version,
otel_scope_schema_url, and any otel_scope_* attributes as labels.
This setting is disabled by default. That's worth knowing because the OpenTelemetry specification requires pull-based exporters to include scope metadata by default, so the labels you see can differ depending on how the same telemetry reaches Prometheus.
How Prometheus handles delta temporality
OpenTelemetry supports both cumulative and delta temporality, so a producer configured to export deltas needs special handling before Prometheus can store those metrics since it expects cumulative metrics only.
Without delta support enabled, Prometheus rejects delta sums and histograms with an error such as:
1invalid temporality and type combination for metric "system.network.io"
The rejection applies to the OTLP request, so a delta metric can cause other metrics batched in the same request to fail as well.
In most cases, the simplest fix is to export cumulative metrics from the OpenTelemetry SDK:
1export OTEL_EXPORTER_OTLP_METRICS_TEMPORALITY_PREFERENCE=cumulative
Cumulative temporality is already the OpenTelemetry default for the instrument types Prometheus expects, so delta output usually means the producer was configured that way deliberately.
If you're already sending metrics through an OpenTelemetry Collector, you can also convert delta metrics before they reach Prometheus with the deltatocumulative processor.
It accumulates delta values in memory and emits cumulative metrics downstream, keeping the conversion in your telemetry pipeline instead of depending on Prometheus-specific ingestion behavior.
But the same statefulness caveat still applies. If the Collector restarts, its accumulation state is lost, so the resulting cumulative series may appear to reset.
If you can't change the producer or perform the conversion in the Collector, Prometheus provides two experimental ways to handle delta metrics itself.
1. Converting deltas to cumulative values
The otlp-deltatocumulative feature converts incoming delta metrics before
writing them to the TSDB:
1prometheus --enable-feature=otlp-deltatocumulative
With this feature enabled, Prometheus keeps the accumulated state in memory. If Prometheus restarts, that state is lost and accumulation starts again from zero, which appears as a counter reset in the stored series.
The conversion also keeps state per series, clears inactive series periodically, and uses mutex-protected in-memory state, so it has additional runtime cost compared with ingesting cumulative metrics directly.
2. Storing delta metrics as-is
The alternative is otlp-native-delta-ingestion:
1prometheus --enable-feature=otlp-native-delta-ingestion
With native delta ingestion, the samples no longer have ordinary Prometheus
counter semantics. This means that a value of 12 represents 12 events during
that interval, rather than a cumulative counter value of 12.
And since rate() and increase() assume cumulative counters, Prometheus
currently recommends using sum_over_time() for delta metrics instead.
The two delta modes are mutually exclusive. Prometheus won't start if you enable both:
12cannot enable otlp-deltatocumulative and otlp-native-delta-ingestionfeatures at the same time
For most OTLP-to-Prometheus pipelines, cumulative metrics remain the simplest option. Prefer cumulative export at the SDK when you control the producer, or convert deltas in the Collector if that's where you manage telemetry processing.
Prometheus's experimental delta features are useful when neither of those options is available, or when you deliberately want to retain raw delta values.
Exemplars
Prometheus can ingest exemplars over OTLP, but exemplar storage must be enabled:
1prometheus --enable-feature=exemplar-storage
Without that flag, exemplar queries return no results even though the metric itself was ingested successfully.
Prometheus maps OpenTelemetry trace and span IDs to the trace_id and span_id
exemplar labels, preserving the link from a metric data point back to a trace.
One current limitation is that exemplar visualization is still only available in Prometheus's old web UI. To inspect exemplars there, enable it alongside exemplar storage:
12prometheus \--enable-feature=exemplar-storage,old-ui
The HTTP API can still query exemplars directly through
/api/v1/query_exemplars, so the old UI requirement only applies when you want
to inspect them in Prometheus's built-in interface.
Out-of-order exemplars don't cause the surrounding metric write to fail as Prometheus counts them separately with:
1prometheus_api_otlp_out_of_order_exemplars_total
For a deeper look at how exemplars connect metrics and traces across an OpenTelemetry pipeline, see correlating metrics with traces using exemplars.
How Prometheus stores OpenTelemetry histograms
As mentioned earlier, explicit-bucket OpenTelemetry histograms are stored as
classic histograms in Prometheus with the familiar _bucket, _count, and
_sum series.
On the other hand, OpenTelemetry exponential histograms are stored as Prometheus native histograms when they arrive through the OTLP receiver, so no additional configuration is required.
The OpenTelemetry exponential histogram generally maps well to Prometheus native histograms, although not every field carries over. Prometheus may downscale very high-resolution histograms, and OpenTelemetry's minimum and maximum values are discarded during translation.
If you'd like to convert explicit-bucket histograms to native histograms during ingestion, you can use:
12otlp:convert_histograms_to_nhcb: true
This stores the histogram as a native histogram with custom bucket boundaries, which can reduce the number of series used to represent it.
The trade-off is aggregation. Native histograms combine cleanly when their bucket schemas are compatible, but custom bucket layouts can differ between services or instrumentations. If they do, Prometheus may be unable to merge those histograms meaningfully across instances.
If several services record the same metric, keep their explicit bucket boundaries aligned before enabling this conversion.
What changes when you push metrics into Prometheus
OTLP uses a push model, while Prometheus was designed around scraping targets. That difference shows up in a few operational behaviors.
The first is target health. Prometheus creates an up metric for every scrape
target, but there's no equivalent for metrics received over OTLP because
Prometheus isn't actively checking a target to tell you whether the service is
still alive.
Staleness also works differently. OTLP doesn't carry Prometheus staleness
markers, so when a pushed series stops arriving it remains visible until
--query.lookback-delta expires, which is five minutes by default, and then
disappears from instant queries.
If you need an up-style signal, emit an explicit heartbeat metric and alert
when it disappears. You can also watch the number of active instances with
queries such as:
1count by (job) (target_info)
absent() and absent_over_time() can still detect missing telemetry, but only
for label combinations you already know to query for.
OTLP ingestion also bypasses metric_relabel_configs, so Prometheus can't drop
or rewrite bad labels before storage. You need to fix them at the source or in
an OpenTelemetry Collector with the
filter or
transform
processor before they arrive.
So while OTLP gives Prometheus a direct push-based ingestion path, it doesn't recreate all the operational behavior of the scrape model.
What changes with an OTel-native backend
Most of the differences we've covered come from the same place. Prometheus has to translate OpenTelemetry metrics into its own data model before storing them.
That translation can rewrite metric names, separate resource attributes from the series they describe, reject delta temporality unless you opt into special handling, and drop information that has no direct Prometheus equivalent.
A backend that stores the OpenTelemetry model natively doesn't need that translation step. Dash0 preserves the OpenTelemetry metric model, so metric identity and resource context are not translated into a different representation at ingestion.
When you need PromQL compatibility, Dash0 exposes Prometheus-compatible names alongside the original OpenTelemetry metric name rather than making the translated form the only representation you can query.
This native approach also helps with correlation across signals. Metrics, traces, and logs retain the OpenTelemetry context that connects them, so you can move between signals without reconstructing relationships that were lost during ingestion.
Final thoughts
Prometheus can receive OpenTelemetry metrics directly over OTLP, so you no longer need a separate translation layer just to get OTel metrics into Prometheus. But direct ingestion doesn't mean the two systems use the same metric model.
Before relying on the resulting data, decide how you want Prometheus to handle
metric names, which resource attributes should become labels, whether your
producers emit cumulative or delta metrics, and whether the loss of
scrape-native behaviors such as up and stale markers matters for your
monitoring.
Once those choices are deliberate, OTLP ingestion is straightforward since most surprises come from assuming the metric you send is exactly the metric you'll query afterward.
If you'd rather preserve the OpenTelemetry model at ingestion, an OTel-native backend like Dash0 avoids those translation decisions while providing PromQL-compatible querying alongside correlation with traces and logs.
To see what an OpenTelemetry-native experience looks like, try Dash0 for free today with a 14-day trial.