Last updated: April 22, 2026
Better Ruby on Rails Logging with Semantic Logger
Logs are often the first place you look when something feels off in production. Perhaps a page is slow, an endpoint is throwing 500 errors, or a background job silently fails. Without good logs, you're left guessing; with them, you can usually walk straight to the problem.
Rails comes with a logger that works well for small applications, but modern systems need more structure and flexibility.
Semantic Logger is a drop-in replacement that addresses many of the standard logger's limitations by offering:
- Structured logging in JSON.
- Asynchronous non-blocking writes.
- Contextual logging.
- Seamless OpenTelemetry correlation.
In this guide, you'll learn to instrument your Ruby on Rails services with Semantic Logger and configure a logging pipeline that aligns with modern observability standards.
Let's begin!
Getting started with Semantic Logger
To begin, add the library to your Gemfile. If you're using Rails, you should
specifically use the Rails integration gem, which automatically hooks into the
framework's internal events:
1234567source 'https://rubygems.org'# For standard Ruby applicationsgem 'semantic_logger'# Or for Ruby on Rails applicationsgem 'rails_semantic_logger'
Then execute the bundle command to install the dependencies:
1bundle install
You can now use it in your Ruby programs like this:
123456require "semantic_logger"SemanticLogger.add_appender(io: $stdout)logger = SemanticLogger['MyApp']logger.info('Hello from Semantic Logger!')
This script initializes the library and directs output to the standard output
stream ($stdout). It creates a named logger instance (MyApp) to identify the
source component and emits an informational event. By default, this produces a
human-readable text format:
12025-11-27 10:53:21.569191 I [2023521:16] MyApp -- Hello from Semantic Logger!
In production environments, you should switch your log output to JSON:
1234SemanticLogger.add_appender(io: $stdout,formatter: :json)
This outputs the following newline-delimited JSON log (pretty-printed here for readability):
1234567891011{"host": "falcon","application": "Semantic Logger","timestamp": "2025-11-27T09:58:50.850338Z","level": "info","level_index": 2,"pid": 2043187,"thread": "16","name": "MyApp","message": "Hello from Semantic Logger!"}
Since most Ruby logging occurs within the context of a specific class, Semantic Logger provides a shorthand mixin to handle namespace resolution automatically:
123456789class PaymentGateway# Adds `logger` class and instance methodsinclude SemanticLogger::Loggabledef charge(amount)# Automatically tagged with name: "PaymentGateway"logger.info("Processing charge", amount: amount)endend
The inclusion of SemanticLogger::Loggable ensures that every log entry is
correctly attributed to its source component without manual configuration:
123456{[...],"name": "PaymentGateway","message": "Processing charge","payload": { "amount": 40 }}
Asynchronous vs synchronous logging
Semantic Logger defaults to an asynchronous logging architecture that utilizes an in-memory queue and a dedicated background thread for flushing logs.
When your application triggers a log event, the payload is pushed to the queue, and the main thread immediately resumes execution.
This creates a non-blocking path that decouples application performance from logging latency:
123456789# The difference in execution flow# Synchronouslogger.info("Processing payment") # Blocks until write completesPaymentGateway.charge(user) # Delays based on the configured appenders# Asynchronouslogger.info("Processing payment") # Pushes to queue, returns instantlyPaymentGateway.charge(user) # Executes immediately
While async logging improves throughput, it introduces a risk: if the Ruby process terminates abruptly, any logs remaining in the memory buffer may be lost, which may deprive you of the context needed to debug the problem.
Since the performance impact of writing to the standard output is usually negligible, you can disable asynchronous logging to guarantee that crash logs will be captured:
123456require "semantic_logger"SemanticLogger.sync! # Add this before any appendersSemanticLogger.add_appender(io: $stdout, formatter: :json)# [...]
How log levels work in Semantic Logger
Semantic Logger supports a set of log levels that lets you control how much logs your services emit. Here's a quick reference table showing the supported levels and their typical use cases:
| Level | Typical use case |
|---|---|
| TRACE | Extremely fine-grained debugging, deeper than debug. |
| DEBUG | Developer-focused diagnostics and internal state. |
| INFO | Routine application events: startup, shutdown, user actions. |
| WARN | Something unexpected or concerning, but not an outright failure. |
| ERROR | An operation failed and needs investigation. |
| FATAL | A serious failure or system-level risk that requires immediate attention. |
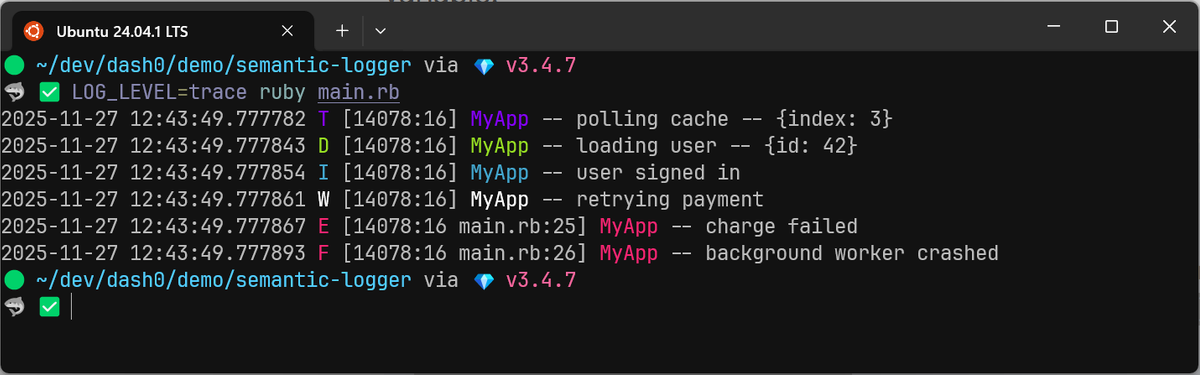
Semantic Logger exposes these levels through simple method calls:
123456logger.trace("polling cache", index: 3)logger.debug("loading user", id: 42)logger.info("user signed in")logger.warn("retrying payment")logger.error("charge failed")logger.fatal("background worker crashed")
Adjusting the log level
If you want to adjust verbosity globally, set the default level. It controls anything that doesn't override its own level:
1SemanticLogger.default_level = :info # info is the default if unspecified
You can override the level per logger as follows:
12345678910111213class EmailSenderinclude SemanticLogger::Loggabledef initializelogger.level = :warnenddef deliver(message)logger.debug("Rendering email", template: message.template)logger.info("Sending email", to: message.recipient)# ...endend
This configuration overrides the global setting and restricts the output of this class to warnings and errors only.
For the application as a whole, it's common to derive the log level from an environment variable:
1SemanticLogger.default_level = ENV.fetch("LOG_LEVEL", "info")
Production settings typically default to info or warn to minimize
performance overhead and reduce costs, while debug and lower are reserved for
development environments or active troubleshooting.
Dynamically updating the log level
While environment variables are useful for initialization, relying on them for active troubleshooting isn't ideal as it typically requires a restart to take effect, which can clear the state you're trying to diagnose.
To solve this, you should implement a mechanism to toggle log verbosity at runtime without interrupting the process. Semantic Logger includes a small but incredibly handy feature for situations like this.
On Unix-like systems (Linux, macOS, BSD), processes can receive signals such as
HUP, TERM, or USR1. Semantic Logger can hook into these signals and change
its behavior on the fly.
To turn on signal handling, add a simple initializer:
1SemanticLogger.add_signal_handler
Once enabled, Semantic Logger watches for the SIGUSR2 signal. When your
process receives this signal, the global default log level rotates to the next
level. No restart is required, and no code changes are needed.
12kill -SIGUSR2 <process_id># or: docker kill -s="SIGUSR2" <container>
The rotation cycle goes in this order:
1fatal → error → warn → info → debug → trace → (wraps back to) fatal
So if your app is currently logging at info, sending SIGUSR2 bumps it to
debug. Send it again and you're at trace. Send it once more and you roll
back to fatal.
This makes it easy to capture verbose diagnostics for a brief period and then step the log level back down once you have the information you need. The caveat is that it only works for loggers that inherit their level from the global default.
If you need to change the level of a class logger, you do so like this:
12345# Change the log level to DEBUGPaymentGateway.logger.level = :debug# Or inherit the global default levelPaymentGateway.logger.level = nil
For cloud-native applications, managing log verbosity through feature flags or a centralized control plane is generally more robust than relying on OS signals.
Temporarily silencing logs
When you're writing tests, it's common to call methods that produce far more logging than you need or care about.
Semantic Logger provides a more controlled option through the silence()
method. It lets you temporarily raise the minimum log level for a specific block
of code, which effectively suppresses low-priority messages.
Here's an example using RSpec:
1234567891011121314151617require "semantic_logger"RSpec.describe PaymentProcessor doinclude SemanticLogger::Loggableit "processes payments without polluting the test output" do# Reduce noise: only errors from inside the block will be logged.logger.silence(:error) doprocessor = PaymentProcessor.newresult = processor.charge(amount: 100, card: "4242424242424242")expect(result).to be_successend# Outside the block, the logger returns to its previous verbosity.endend
In this test, anything below error inside the silence block is ignored,
which keeps the test output clean. As soon as the block ends, Semantic Logger
restores the original global level automatically.
Note that this suppression applies only to loggers utilizing the global default
level. If a logger has an explicitly configured log level, it will ignore the
silence directive.
Contextual logging with Semantic Logger
Structured logs only start to pay off when they include context around an event. A log message about a failed operation is useless unless you know what caused it, what inputs were involved, and what the system was doing at the time.
Semantic Logger offers two primary mechanisms to inject this context: Payloads and Tags.
Per-message context (payloads)
Instead of interpolating variables into the message string, you should pass them as the second argument to any level method:
12345678910require "semantic_logger"SemanticLogger.add_appender(io: $stdout,formatter: :json)logger = SemanticLogger["Auth"]logger.info("Failed to update record", user_id: "usr-1234", provider: "github")
The resulting JSON log entry cleanly separates the event description from its metadata:
123456{[...],"name": "Auth","message": "Failed to update record","payload": { "user_id": "usr-1234", "provider": "github" }}
Scoped context (tags)
While payloads are great for individual events, you often need to attach context to a specific workflow that spans multiple method calls. Passing arguments manually to every single log statement leads to parameter drilling, which is tedious and error-prone.
The tagged() method solves this by applying metadata to a specific block of
execution. Any log generated within that block (including in deeply nested
methods) automatically inherits these tags.
12345678910111213class InvoiceProcessorinclude SemanticLogger::Loggabledef process(invoice)SemanticLogger.tagged(invoice_id: invoice.id, customer_id: invoice.customer_id) dologger.info("Starting invoice processing")# processing...logger.info("Invoice successfully processed")endendend
In the output, these shared attributes appear under named_tags. This binds the
logs together, allowing you to filter by invoice_id in your observability tool
and see the entire lifecycle of that specific transaction.
12{...,"named_tags":{"invoice_id":"1234","customer_id":"5678"},"name":"InvoiceProcessor","message":"Starting invoice processing"}{...,"named_tags":{"invoice_id":"1234","customer_id":"5678"},"name":"InvoiceProcessor","message":"Invoice successfully processed"}
Logging errors and exceptions
When something breaks, the last thing you want is a vague message with no context or a swallowed stack trace.
Semantic Logger provides a clean, structured way to capture errors, enrich them with metadata, and surface stack traces in a format that is easy for both humans and machines to read.
To log an exception, simply pass the exception object as the second argument. The logger automatically extracts the class name, the error message, and the full backtrace.
123456begindangerous_operationrescue StandardError => e# Pass the exception object directlylogger.error("Operation failed", e)end
The resulting log entry encapsulates the error details in a dedicated
exception object. Unlike standard logging, which dumps the stack trace as a
giant string, Semantic Logger formats it as a structured array:
123456789101112{[...],"message": "Operation failed","exception": {"name": "NameError","message": "undefined local variable or method 'dangerous_operation' for main","stack_trace": ["app/jobs/worker.rb:42:in `perform'","app/models/user.rb:15:in `update_status'"]}}
Adding context to error logs
An exception tells you what failed, but it rarely tells you why. To fix a bug efficiently, you need the state of the application at the moment of failure.
Semantic Logger allows you to pass both a contextual payload and the exception object simultaneously. The signature changes slightly; you need to pass the payload as the second argument and the exception as the third:
123456begincharge_customer(customer)rescue Gateway::Timeout => e# Signature: message, payload, exceptionlogger.error("Payment timed out", { customer_id: customer.id, amount: 49.99 }, e)end
Now, your log contains the complete picture: the error details alongside the business context required to reproduce the issue.
12345678910{[...],"message": "Payment timed out","payload": { "customer_id": "cust-1234", "amount": 49.99 },"exception": {"name": "Gateway::Timeout","message": "undefined local variable or method 'dangerous_operation' for main","stack_trace": ["main.rb:63:in '<main>'"]}}
How nested exceptions are handled
Ruby applications often wrap low-level errors in domain-specific exceptions. When you raise a new error inside a rescue block, the original error is preserved as the cause.
Semantic Logger automatically detects this relationship and serializes the entire error chain.
12345678910111213def write_fileFile.open("example.txt", "r") do |f|f.write("hello")endrescue IOError => eraise "Failed to save changes"endbeginwrite_filerescue StandardError => elogger.error "File operation error", eend
The output captures the primary error and recursively nests the root cause, making it easy to trace the failure back to its origin:
1234567891011121314151617181920212223{[...],"message": "File operation error","exception": {"name": "RuntimeError","message": "Failed to save changes","stack_trace": ["main.rb:68:in 'Object#write_file'","main.rb:72:in '<main>'"],"cause": {"name": "IOError","message": "not opened for writing","stack_trace": ["main.rb:64:in 'IO#write'","main.rb:64:in 'block in Object#write_file'","main.rb:63:in 'IO.open'","main.rb:63:in 'Object#write_file'","main.rb:72:in '<main>'"]}}}
When to use the FATAL level
The fatal level should be
strictly reserved
for situations where the application cannot continue operating.
A fatal log doesn't mean "a really bad error happened". It means the process
is about to crash, or the system is in such a corrupted state that it must shut
down to prevent data loss.
An example is when a core dependency is completely unavailable and your application cannot function without it:
12345678beginActiveRecord::Base.connection.execute("SELECT 1")rescue => elogger.fatal("Critical: database unavailable, shutting down", e)# Force exit because the app cannot function without a DBexit(1)end
If the application can rescue the error and serve the next request (even if it
returns a 500 status), the level is error, not fatal.
Working with Semantic Logger appenders
In Semantic Logger, an appender defines both the destination and format of your log entries.
In production, the most robust, cloud-native approach is logging JSON exclusively to the standard output as you've done throughout this article.
This shifts the responsibility of routing and storage from your application to your infrastructure, allowing dedicated agents (like the OpenTelemetry Collector) to manage the ingestion pipeline.
That said, Semantic Logger supports many other combinations for how your logs are formatted and where they're sent.
A typical use case is seeing colorful logs in your development environments while switching to JSON in production:
1234567environment = ENV.fetch("RAILS_ENV", "development")SemanticLogger.add_appender(io: $stdout,# Use JSON in production, but colorized text for local developmentformatter: environment == "production" ? :json : :color)
If you're deploying to VMs or bare metal servers without a log collector agent, you may need to write to a local file directly:
1234SemanticLogger.add_appender(file_name: "app.log",formatter: :json)
Note that Semantic Logger doesn't natively handle log rotation, so you must configure a utility like logrotate to manage this.
Because Semantic Logger keeps the file handle open for performance, you should use copytruncate mode. This truncates the active file in place rather than moving it, to prevent losing logs.
Filtering and redacting logs
As your application grows, you'll inevitably encounter situations where you need more control over log volume beyond severity levels.
You might have a third-party library that is too verbose, a health check endpoint spamming your index, or sensitive data inadvertently leaking into your payloads.
While these filtering tasks can (and should) be centralized in your telemetry pipeline, Semantic Logger provides a useful first line of defense that prevents such data from ever leaving the application process.
Filters are defined as a Proc (or a Regular Expression) passed to the appender
configuration. The Proc receives the entire log object, allowing you to make
decisions based on the class name, message, payload, or severity.
1234567891011SemanticLogger.add_appender(io: $stdout,formatter: :json,filter: -> log {return false if log.name == "PaymentGateway"return false if log.payload.is_a?(Hash) && log.payload[:path] == "/healthz"true})
In this example, if the filter returns false, the log entry is discarded
immediately. Otherwise, the log proceeds to formatting and output.
Filters are also useful for scrubbing Personal Identifiable Information (PII) or credentials that might have been passed into a payload.
Here's how to implement a scrubber that sanitizes a predefined set of keys before they leave your application:
1234567891011121314151617SENSITIVE_KEYS = %i[password token secret credit_card_number].freezeSemanticLogger.add_appender(io: $stdout,formatter: :json,filter: -> log {if log.payload.is_a?(Hash)log.payload.each_key do |key|if SENSITIVE_KEYS.include?(key)log.payload[key] = "[REDACTED]"endendendtrue})
With this filter active, each logging call is automatically intercepted and the sensitive fields are redacted:
12345{[...],"message": "user signed in","payload": { "password": "[REDACTED]" }}
For stricter security, you can invert this strategy by implementing an allowlist where all payload data is discarded unless it matches a set of explicitly approved safe keys.
Configuring Rails for production logging with Semantic Logger
While using the semantic_logger gem directly works, a Rails application
benefits significantly from its full framework integration since you'll want
your controller logs, Active Record queries, background jobs, and third-party
libraries (like Sidekiq) to all emit unified, structured events.
The easiest way is with the rails_semantic_logger gem:
12# Gemfilegem "rails_semantic_logger"
This gem is a drop-in replacement that patches Rails.logger and automatically
hooks into:
- Action Controller & Action View
- Active Record
- Active Job
- Popular libraries like Sidekiq, Resque, and Bugsnag
Once installed, the default, unstructured Rails logger is immediately replaced.
The following configuration ensures that both your custom logs and Rails' internal request logs are formatted as JSON and sent to standard output:
123456789101112131415# config/application.rb# [...]module MyAppclass Application < Rails::Application# [...]config.semantic_logger.add_appender(io: $stdout,formatter: :json)# Treat Semantic Logger as the primary formatter.config.rails_semantic_logger.format = :jsonendend
With this configuration, a standard request to your application produces a rich, structured log entry instead of a block of text:
123456789101112131415{"host": "falcon","application": "Semantic Logger","environment": "development","timestamp": "2025-11-27T12:29:04.783151Z","level": "info","level_index": 2,"pid": 74114,"thread": "puma srv tp 001","duration_ms": 6.560708001255989,"duration": "6.561ms","name": "Rails::WelcomeController","message": "Completed #index","payload": {...}}
Inside Rails components, you simply call logger.<method> as usual. For plain
Ruby classes that are not managed by Rails, you can include
SemanticLogger::Loggable to get a class-specific logger instance as usual or
create a new explicit logger (logger = SemanticLogger["MyService"]).
Tuning Rails request logs
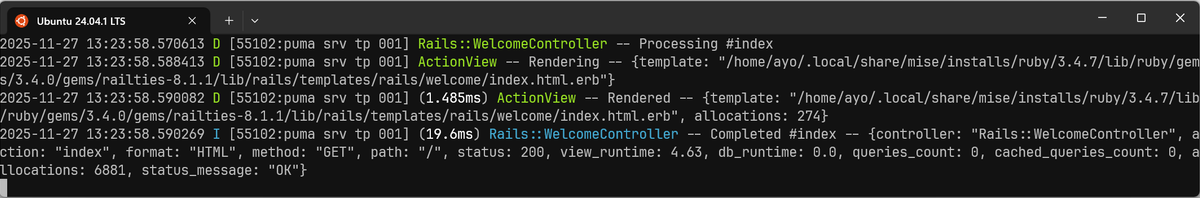
Rails emits multiple log entries (Started, Processing, Rendered,
Completed) for every single HTTP request. Aside from the Completed entry,
they're all logged at the debug level, so they don't show up in production
environments.
1234{...,"message":"Started","payload":{"method":"GET","path":"/logger-test","ip":"::1"}}{...,"message":"Processing #show"}{...,"message":"Rendered","payload":{"template":"text template","allocations":6}}{...,"message":"Completed #show",...}
To include relevant business context in request completion logs, you can provide
additional fields by defining the append_info_to_payload() method in your
controllers as follows:
12345678910111213class OrdersController < ApplicationControllerdef show@order = Order.find(params[:id])render json: @orderenddef append_info_to_payload(payload)superpayload[:order_id] = @order&.idpayload[:customer_id] = @order&.customer_idpayload[:total_cents] = @order&.total_centsendend
Every Completed log for this controller will now include the extra fields in
the payload object:
1{...,"message":"Completed #show","payload":{...,"order_id":"ORD-123","customer_id":"CUST-XYZ","total_cents":89.8,...}}
If you need to modify the payload for all requests, you can do so by defining
append_info_to_payload in the ApplicationController class. It's the ideal
place to add extra context or strip out anything you'd like to omit from the
logs:
1234567891011# app/controllers/application_controller.rbclass ApplicationController < ActionController::Base# [...]def append_info_to_payload(payload)superpayload.delete(:allocations)payload.delete(:db_runtime)payload.delete(:view_runtime)endend
Global tags in Rails
Rails' log_tags feature lets you attach per-request metadata to every log line
generated while that request is being processed. When you're using
rails_semantic_logger, those tags are automatically mapped into the
named_tags field in your structured JSON logs.
A common use case is adding the request ID so that every log line generated during a request shares a unique identifier:
1234# config/application.rbconfig.log_tags = {request_id: :request_id}
In your log stream, this appears as:
123"named_tags": {"request_id": "e2b63b7c-65a5-4fb0-9b5b-fb128400c771"}
While a request_id may be sufficient for debugging within a single monolith,
modern cloud-native applications rely on
Distributed Tracing
(via OpenTelemetry) to examine the full journey of
a request within and across service boundaries.
Configuring the full OpenTelemetry SDK is beyond the scope of this guide. However, if your application is already instrumented, leaving your logs isolated from your traces is a missed opportunity.
By injecting the standard OpenTelemetry trace_id and span_id into your
Semantic Logger output, you'll create a seamless bridge between your
observability signals.
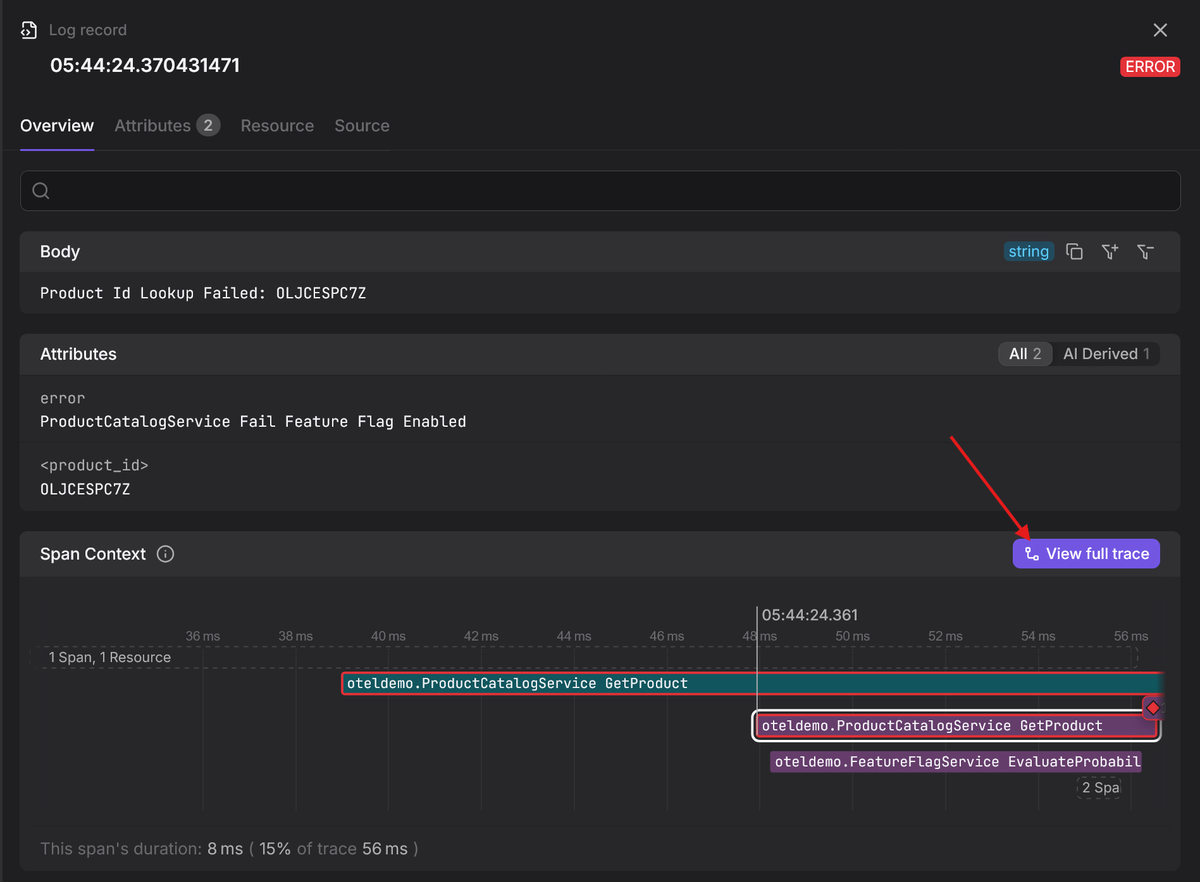
Instead of manually correlating timestamps or grepping for request IDs during an outage, you can navigate from a specific error in your trace timeline to the exact log entries that explain the root cause.
Let's see what this looks like in practice.
Connecting Rails logs with traces using OpenTelemetry
To bridge your logs and traces, you first need a working OpenTelemetry
configuration. A minimal setup requires the SDK and the standard instrumentation
libraries in your Gemfile:
123# Gemfilegem "opentelemetry-sdk"gem "opentelemetry-instrumentation-all"
Next, configure the SDK in an initializer to enable automatic instrumentation:
12345678# config/initializers/opentelemetry.rbrequire 'opentelemetry/sdk'require 'opentelemetry/instrumentation/all'OpenTelemetry::SDK.configure do |c|c.service_name = 'my-app'c.use_all() # enables all instrumentation!end
To verify the setup, run your server with the console exporter enabled. This will print trace spans directly to your terminal instead of sending them to a backend.
1OTEL_TRACES_EXPORTER=console bin/rails server
When you trigger a request, you'll see the raw span data emitted in the console.
Buried within this structure are the trace_id and span_id:
123456789#<struct OpenTelemetry::SDK::Trace::SpanDataname="GET /logger-test",kind=:server,start_timestamp=1764109451243524000,end_timestamp=1764109451362775000,# ... attributes omitted for brevity ...span_id="\xB4l\xC1\xBC5\xFC\xF3\xCF",trace_id="\x93\x1A\x8A\xA9\xFA\xDBj`\x93\xD2\xF5\xED\x875@\x8E",parent_span_is_remote=false>
Injecting trace context into logs
Seeing spans in the console proves instrumentation is working, but your logs
remain disconnected. To bridge the gap, you need to extract the trace_id and
span_id from the current OpenTelemetry context and attach them to the logs.
One way to do this is via the log_tags feature we explored earlier:
1234567891011121314151617181920# config/application.rbmodule MyAppclass Application < Rails::Application# [...]config.log_tags = {trace_id: -> request {span = OpenTelemetry::Trace.current_spanspan.context.valid? ? span.context.hex_trace_id : nil},span_id: -> request {span = OpenTelemetry::Trace.current_spanspan.context.valid? ? span.context.hex_span_id : nil},trace_sampled: -> request {span = OpenTelemetry::Trace.current_spanspan.context.valid? ? span.context.trace_flags.sampled? : nil}}endend
This configuration does two things:
-
It extracts the
trace_id,span_id, andtrace_sampledfrom the current OpenTelemetry span (if available). -
Then it injects them into the
named_tagsstructure of your JSON log.
When you inspect your logs, you'll now see the trace context automatically populated:
123456789{[...],"named_tags": {"trace_id": "930eeb0c1207f6f761a47261cb5f0dc9","span_id": "5f3f22f1d4e482d6","trace_sampled": true},[...]}
If you're running a high-traffic service, you're probably only sampling 1% or
10% of your traces. The trace_sampled field is necessary to let you know
whether the referenced trace was actually recorded, or if you must rely solely
on the log context to debug an issue.
A note on the OTel data model
OpenTelemetry provides a Logs Data Model that creates a standardized schema for log records no matter where they come from.
Instead of a JSON blob where every application invents its own field names, the model enforces a strict structure consisting of:
-
Top-level fields: Reserved for essential metadata like
timestamp,severity_number,trace_id,span_id, andtrace_flags. -
Body: The primary human-readable message of the log.
-
Attributes: A dedicated key-value map for event-level structured context.
-
Resource attributes: Context that identifies the source of the log, such as
service.name,k8s.pod.name, orcloud.region.
Aligning your Semantic Logger output to this model is a necessary step to standardize your telemetry across the entire stack.
While you can normalize logs within your OpenTelemetry Collector pipeline using the transform processor, it's usually preferable to align the output to be as close as possible at the source to reduce the amount of processing needed in the Collector.
Here's a custom Semantic Logger formatter that inherits from the default JSON formatter but overrides the structure to follow semantic conventions in the attribute names:
1234567891011121314151617181920212223242526272829303132333435363738394041424344454647484950515253545556575859606162636465666768697071727374757677787980# lib/logger/otel_formatter.rbrequire 'semantic_logger'module Loggersclass OtelFormatter < SemanticLogger::Formatters::Jsondef call(log, logger)output = {timestamp: log.time.utc.iso8601(9),severity_text: log.level.upcase,severity_number: map_severity_to_number(log.level),body: log.message,attributes: {}}if log.named_tagsoutput[:trace_id] = log.named_tags[:trace_id]output[:span_id] = log.named_tags[:span_id]output[:trace_flags] = log.named_tags[:trace_sampled] ? "01" : "00"log.named_tags.delete(:trace_id)log.named_tags.delete(:span_id)log.named_tags.delete(:trace_sampled)endif log.exceptionoutput[:attributes]['exception.type'] = log.exception.class.nameoutput[:attributes]['exception.message'] = log.exception.messageoutput[:attributes]['exception.stacktrace'] = log.exception.backtrace&.join("\n")endif log.payload.is_a?(Hash)map_payload_to_semantic_conventions(log.payload, output[:attributes])endoutput[:attributes].merge!(log.named_tags) if log.named_tagsoutput.to_jsonendprivatedef map_severity_to_number(level)case levelwhen :trace then 1when :debug then 5when :info then 9when :warn then 13when :error then 17when :fatal then 21else 9endend# Rename Rails keys to OTel Semantic Conventionsdef map_payload_to_semantic_conventions(payload, attributes)payload.each do |key, value|new_key = case keywhen :method then 'http.request.method'when :path then 'url.path'when :status then 'http.response.status_code'when :duration then 'rails.duration'when :db_runtime then 'rails.db_runtime'when :view_runtime then 'rails.view_runtime'when :allocations then 'rails.allocations'when :queries_count then 'rails.queries_count'when :cached_queries_count then 'rails.cached_queries_count'when :status_message then 'rails.status_message'when :controller then 'rails.controller'when :action then 'rails.action'when :format then 'rails.format'else key.to_sendattributes[new_key] = valueendendendend
Then configure Rails to use the custom formatter:
123456789101112# config/application.rbrequire_relative '../lib/logger/otel_formatter'module MyAppclass Application < Rails::Application# [...]config.semantic_logger.add_appender(io: $stdout, formatter: Loggers::OtelFormatter.new)config.rails_semantic_logger.format = Loggers::OtelFormatter.newendend
The result is a JSON log that looks like this:
1234567891011121314151617181920212223{"timestamp": "2025-11-29T07:41:22.581361000Z","severity_text": "INFO","severity_number": 9,"body": "Completed #index","attributes": {"http.request.method": "GET","url.path": "/","http.response.status_code": 200,"rails.view_runtime": 2.01,"rails.db_runtime": 0.0,"rails.queries_count": 0,"rails.cached_queries_count": 0,"rails.allocations": 6175,"rails.status_message": "OK","rails.controller": "Rails::WelcomeController","rails.action": "index","rails.format": "*/*"},"trace_id": "5ae5edf0f2b203bbce1758f01b359e8f","span_id": "b09ad6b2994e7c39","trace_flags": "01"}
With this in place, your OTel Collector configuration becomes much simpler. You no longer need as many transform statements to rename keys; you simply map the top-level fields and pass the attributes map through as-is.
For a practical configuration example, refer to our article on the OpenTelemetry Collector's transform processor.
Centralizing logs with Dash0
You've invested significant effort into configuring your Ruby logs, but they'll do you no good just sitting on a local disk.
To make them actionable, you must aggregate the log streams into a persistent backend where they can be queried, analyzed, and correlated with metrics and traces.
Dash0 is an OpenTelemetry-native observability platform that pulls your logs, traces, and metrics into one place and helps you quickly surface the root cause of any issue.
All you need to do is point your OpenTelemetry Collector at the Dash0 endpoint using a standard OTLP exporter:
123456789101112131415# otelcol.yaml# [...]exporters:otlp/dash0:endpoint: "<your_dash0_endpoint>"headers:Authorization: "Bearer ${env:DASH0_TOKEN}"service:pipelines:logs:receivers: [filelog]processors: [batch, transform]exporters: [otlp/dash0]
Final thoughts
Semantic Logger transforms Ruby on Rails logging from a passive text stream into an active, queryable signal. By adopting structured JSON and OpenTelemetry correlation, you'll align your telemetry practices with modern observability standards.
The result is a system where logs aren't just noise you grep through during an
outage, but precise signals that lead you directly to the root cause. Start
simple by outputting JSON to stdout and iterate toward a fully correlated
pipeline that turns your telemetry into your greatest debugging advantage.
Thanks for reading!
