Last updated: June 5, 2026
Laravel Logging: A Practitioner's Guide
Laravel's logging system is more capable than its documentation lets on. Under the surface, the framework wraps Monolog with its own conventions for contextual data, channel routing, and exception reporting.
Recent versions introduced the Context facade, which changes how you should
think about attaching metadata to log entries. And the OpenTelemetry ecosystem
now provides first-class support for PHP and Laravel, making it possible to
connect your logs to distributed traces without writing custom plumbing.
But there's a significant gap between calling Log::info() in a controller and
having logs that actually help you understand what your application is doing in
production. Bridging that gap requires deliberate choices about output format,
contextual enrichment, exception handling, channel architecture, and telemetry
integration.
This guide focuses on exactly those choices. It assumes you understand the basics of Laravel's channel system and Monolog's role behind it. If you need a refresher on Monolog itself, including handlers, processors, formatters, and the PSR-3 interface, our PHP Logging with Monolog guide covers the library in depth.
By the end, your Laravel logs will be structured, enriched with per-request context, and flowing through an OpenTelemetry pipeline into a centralized platform where you can correlate them with traces and metrics across your entire infrastructure.
Prerequisites
Before working through the examples in this guide, make sure your environment includes:
- PHP 8.2 or later
- Composer (latest version)
- Laravel 11 or newer
You should also be comfortable running Artisan commands and editing Laravel configuration files.
How Laravel's logging system works
Laravel's logging infrastructure lives in the config/logging.php configuration
file. This file defines a set of channels, each of which describes a
destination and format for log output. When your application calls Log::info()
or Log::error(), Laravel routes the message through whichever channel is
currently active.
Understanding the default configuration
A fresh Laravel installation ships with several pre-configured channels, but the
one that matters on day one is stack. The default key at the top of
config/logging.php determines which channel is used when you don't specify one
explicitly, and it reads from the LOG_CHANNEL environment variable:
123456789101112131415161718192021222324252627282930// config/logging.phpreturn ['default' => env('LOG_CHANNEL', 'stack'),'channels' => ['stack' => ['driver' => 'stack','channels' => ['single'],'ignore_exceptions' => false,],'single' => ['driver' => 'single','path' => storage_path('logs/laravel.log'),'level' => env('LOG_LEVEL', 'debug'),'replace_placeholders' => true,],'daily' => ['driver' => 'daily','path' => storage_path('logs/laravel.log'),'level' => env('LOG_LEVEL', 'debug'),'days' => env('LOG_DAILY_DAYS', 14),'replace_placeholders' => true,],// ... additional channels omitted],];
The stack driver is a meta-channel that fans out to one or more other channels
listed in its channels array. By default it points to single, which writes
everything to a single file at storage/logs/laravel.log. You can add more
channels to the stack (or swap single for daily, which rotates files
automatically) by editing this array.
Channels, drivers, and Monolog
Each channel specifies a driver that determines its behavior. Laravel ships
with several built-in drivers:
singlewrites to one file that grows indefinitely.dailycreates a new file each day (e.g.laravel-2026-04-12.log) and removes files older than the configureddaysvalue.sysloganderrorlogroute messages to PHP's nativesyslog()anderror_log()functions respectively.
Under the hood, all of these drivers create
Monolog handler instances.
For example, the single driver uses Monolog's StreamHandler, daily uses
RotatingFileHandler, and so on.
If you need to use a Monolog handler that doesn't have a dedicated Laravel
driver, you can use the monolog driver to reference any handler class
directly, or the custom driver to build a channel from scratch in a factory
class. You'll see both of these in later sections.
Log levels
Laravel follows the eight severity levels defined in
RFC 5424, from DEBUG (least
severe) through INFO, NOTICE, WARNING, ERROR, CRITICAL, ALERT, to
EMERGENCY (most severe). Each channel has a level setting that acts as a
minimum threshold: any message below that level is silently discarded.
The LOG_LEVEL environment variable in your .env file controls this threshold
for channels that reference it. In development, debug is a sensible default.
In production, most teams set it to info or warning to reduce noise and
storage costs, then lower it temporarily during incidents.
Where the .env file fits in
Your .env file is where you control logging behavior without touching the
configuration code:
1234LOG_CHANNEL=stackLOG_LEVEL=debugLOG_DAILY_DAYS=14LOG_DEPRECATIONS_CHANNEL=null
LOG_CHANNEL selects the active channel, LOG_LEVEL sets the minimum severity,
LOG_DAILY_DAYS controls how many days of rotated log files to retain (when
using the daily driver) andLOG_DEPRECATIONS_CHANNEL routes PHP and Laravel
deprecation warnings to a specific channel, which is useful when preparing for
major version upgrades.
Writing your first log entry
With the default setup, you can immediately begin creating log entries in your application:
12345678910111213// routes/web.phpuse Illuminate\Support\Facades\Log;Route::get('/test-logging', function () {Log::info('Application started.');Log::error('Something went wrong.', ['component' => 'payment-gateway',]);return response()->json(['message' => 'Logs written.',]);});
The second argument is an optional context array that gets appended to the log
entry. Check storage/logs/laravel.log and you'll see output like this:
12[2026-04-12 20:14:29] local.INFO: Application started.[2026-04-12 20:14:29] local.ERROR: Something went wrong. {"component":"payment-gateway"}
The format is [timestamp] environment.LEVEL: message {context}. It's
human-readable, which is fine for local development. But this format has real
limitations once your application reaches production.
Switching to structured JSON output
The default format you saw above is produced by Monolog's LineFormatter. It's
readable in a terminal, but it falls apart in production: multi-line stack
traces break line-based tooling, context values are hard to search reliably, and
parsing requires fragile regular expressions.
Structured JSON output solves all of this by turning each log entry into a well-defined object that downstream systems can index, filter, and aggregate reliably.
Laravel's tap mechanism
lets you customize how Monolog is configured for any channel without replacing
the channel driver. Create a class that receives the logger instance and swaps
in the JsonFormatter:
123456789101112131415161718<?php// app/Logging/JsonFormatter.phpnamespace App\Logging;use Monolog\Formatter\JsonFormatter as MonologJsonFormatter;class JsonFormatter{public function __invoke($logger){foreach ($logger->getHandlers() as $handler) {$handler->setFormatter(new MonologJsonFormatter());}}}
In Docker or Kubernetes, writing to stdout or stderr is the recommended
approach because container runtimes capture these streams natively and
orchestrators handle collection, rotation, and forwarding for you. This aligns
with the twelve-factor app methodology and keeps
log management out of your application code.
Laravel already ships with a stderr channel in config/logging.php. Add the
tap key to it so that it uses your JsonFormatter class:
12345678910111213// config/logging.php'stderr' => ['driver' => 'monolog','level' => env('LOG_LEVEL', 'debug'),'handler' => StreamHandler::class,'formatter' => env('LOG_STDERR_FORMATTER'),'with' => ['stream' => 'php://stderr',],'tap' => [App\Logging\JsonFormatter::class],'processors' => [PsrLogMessageProcessor::class],],
Make sure LOG_CHANNEL=stack is set (it's the default), then set
LOG_STACK=stderr to tell the stack which channel to fan out to:
123# .envLOG_CHANNEL=stackLOG_STACK=stderr
Now visit /test-logging again and you'll see JSON output directly in your
terminal:
12{"message":"Application started.","context":{},"level":200,"level_name":"INFO","channel":"local","datetime":"2026-04-12T20:30:42.918064+00:00","extra":{}}{"message":"Something went wrong.","context":{"component":"payment-gateway"},"level":400,"level_name":"ERROR","channel":"local","datetime":"2026-04-12T20:30:42.920222+00:00","extra":{}}
The context field carries the data you passed explicitly with the log call,
while extra is reserved for data injected automatically by Monolog processors.
Both are now first-class, queryable fields rather than a string appended to the
end of a line.
Contextual logging in Laravel
Logs only become valuable when they carry enough context to explain what happened, to whom, and as part of which operation.
Laravel provides several mechanisms for attaching this context. Understanding which one to use and when is one of the most important production logging decisions you'll make.
Per-message context
The simplest form of context is the array you pass as the second argument to any
Log method:
12345678use Illuminate\Support\Facades\Log;Log::error('Payment processing failed.', ['order_id' => $order->id,'gateway' => 'stripe','error_code' => $exception->getCode(),'customer_id' => $order->customer_id,]);
This data appears in the context field of the resulting JSON record, and it
should be used for event-specific context alone. The quality of the resulting
logs largely depends on the attributes you choose to include here.
An error log that says "processing failed" tells you almost nothing; one that includes the order ID, gateway name, and error code gives you the necessary details to aid your investigation.
The Context facade (Laravel 11+)
Per-message context doesn't scale when the same attributes need to appear on
every log entry in a request. Passing cross-cutting attributes into every Log
call is tedious, inconsistent, and easy to forget in the one place where it
matters most.
Laravel 11 introduced the Context facade to solve exactly this problem. It
provides a request-scoped data store that's automatically appended to every
subsequent log entry without you needing to pass it explicitly.
This is the recommended approach for request-scoped metadata like request IDs, authenticated user details, and tenant identifiers. A middleware is the natural place to set it up:
1234567891011121314151617181920212223242526<?php// app/Http/Middleware/AttachRequestContext.phpnamespace App\Http\Middleware;use Closure;use Illuminate\Http\Request;use Illuminate\Support\Facades\Context;use Illuminate\Support\Str;use Symfony\Component\HttpFoundation\Response;class AttachRequestContext{public function handle(Request $request,Closure $next): Response {Context::add('request_id', Str::uuid()->toString());if ($user = $request->user()) {Context::add('user_id', $user->id);}return $next($request);}}
Register this middleware globally in your application's bootstrap/app.php:
12345->withMiddleware(function (Middleware $middleware) {$middleware->append(\App\Http\Middleware\AttachRequestContext::class);})
From this point forward, every log call made during the request will
automatically include the request_id and user_id fields (if available)
without you needing to pass them explicitly.
You'll see these fields in the extra attribute:
12{"message":"Application started.",..., "extra":{"request_id":"2321d78f-2212-4b04-bd81-c0d064022655"}}{"message":"Something went wrong.",..., "extra":{"request_id":"2321d78f-2212-4b04-bd81-c0d064022655"}}
Context propagation across queued jobs
One of the most powerful features of the Context facade is its automatic
propagation to queued jobs. When Laravel dispatches a job, it serializes the
current context data through a dehydration step. Then when a queue worker picks
up the job, the context is hydrated back into the worker's process.
This means that if your middleware sets a request_id and user_id via
Context::add(), and the request dispatches a ProcessOrder job to the queue,
the log entries emitted by that job will automatically include the same
request_id and user_id. You get a thread of correlation from the initial
HTTP request through to the background processing without any manual wiring.
123456789101112// In your controller or serviceContext::add('request_id', Str::uuid()->toString());Context::add('user_id', $user->id);// Later in the same requestProcessOrder::dispatch($order);// Inside the job's handle() method, logs automatically// carry request_id and user_id from the originating requestLog::info('Processing order.', ['order_id' => $order->id,]);
If you need to add job-specific context without overwriting the inherited
request context, you can call Context::add() inside the job's handle()
method.
Preventing sensitive data from leaking into your logs
The more context you attach to your logs, the more useful they become for debugging. But that same habit creates a risk: it's easy to inadvertently log API keys, bearer tokens, passwords, or personally identifiable information that should never be exposed in your logs.
Laravel's Context facade provides one built-in safeguard through hidden
context, and you can supplement it with a sanitization layer in your own code.
Using hidden context for sensitive data
The Context facade supports hidden context, which is data that's available to
your application code but never written to log entries. This is useful for
values that need to flow through the request lifecycle for authorization or
routing decisions but shouldn't appear in logs.
12345Context::addHidden('api_key', $request->bearerToken());Context::addHidden('session_token',$request->session()->getId());
Hidden context propagates to queued jobs just like regular context, but it's excluded from log output by design.
Redacting sensitive keys with a Monolog processor
Another safety net is using a Monolog processor that intercepts every log record and redacts specified keys before they reach any handler, regardless of how the log call was written.
For something this security-critical, you're better off writing this yourself than pulling in a third-party package. A processor that covers the common cases is around 20 lines, you own the logic entirely, and there's nothing to audit or keep updated.
Laravel's tap mechanism expects a class with an __invoke($logger) signature,
so combine both responsibilities in one class: the tap registers the processor,
and the processor does the redaction:
1234567891011121314151617181920212223242526272829303132333435<?php// app/Logging/RedactSensitiveFields.phpnamespace App\Logging;use Monolog\LogRecord;class RedactSensitiveFields{private array $keys = ['password','password_confirmation','api_key','token','secret','ssn','credit_card','authorization',];public function __invoke($logger): void{$logger->pushProcessor(function (LogRecord $record) {$context = $record->context;foreach ($this->keys as $key) {if (isset($context[$key])) {$context[$key] = '********';}}return $record->with(context: $context);});}}
To wire this into your Laravel channel, add it to its tap array:
123456789// config/logging.php'stderr' => [// ...existing config...'tap' => [App\Logging\JsonFormatter::class,App\Logging\RedactSensitiveFields::class,],],
Now even if someone writes Log::info('Login attempt.', $request->all()),
sensitive fields are masked before they're written anywhere. You can test this
with a quick route:
1234567891011Route::get('/test-redaction', function () {Log::info('login attempt', ['user_id' => 'usr-1234','password' => 'secret123','api_key' => 'sk-live-abc123xyz',]);return response()->json(['message' => 'Check logs for redacted output.',]);});
The resulting log entry will show both password and api_key fully masked,
while user_id passes through:
123456789101112{"message": "login attempt","context": {"user_id": "usr-1234","password": "********","api_key": "********"},"level": 200,"level_name": "INFO","channel": "local","datetime": "2026-04-13T07:12:04.584784+00:00"}
Keep in mind that this approach isn't foolproof since a developer can still log a sensitive value under a key name that isn't in the redaction list so this doesn't remove the need for code review and team awareness around what gets logged.
It's also worth noting that sensitive values can leak through exception stack
traces, not just context arrays. PHP 8.2's
#[\SensitiveParameter]
attribute lets you mark function parameters so their values are replaced with a
placeholder in stack traces. Apply it to any parameter that accepts credentials,
tokens, or secrets.
If your logs flow through an OpenTelemetry Collector (which we'll set up later in this guide), you can add further layers of redaction that strip sensitive attributes from log records and other telemetry signals before they leave your infrastructure.
This catches anything the application layer missed, and it's where you'd put redaction rules that don't belong in application code.
Capturing debug context only when errors occur
One of the hardest trade-offs in logging is choosing between verbosity and cost.
You generally want DEBUG-level detail when actively investigating a production
issue, but emitting it continuously generates data volumes that are expensive to
store and almost never worth the cost on the requests where nothing interesting
happens.
Monolog's FingersCrossedHandler
solves this
by buffering all log records in memory without writing them anywhere. The moment
a record at or above a configurable trigger level arrives (typically ERROR),
the handler flushes the entire buffer to the wrapped handler.
Because FingersCrossedHandler takes a handler instance as its first
constructor argument, you can't wire it up cleanly using Laravel's monolog
driver alone as it resolves a single handler class and has no way to express the
nested handler relationship.
The right approach is the custom driver with a factory class. This also keeps
your config array free of object instantiation and safe to serialize with
php artisan config:cache.
Create the factory class:
123456789101112131415161718192021222324252627<?php// app/Logging/BufferedChannel.phpnamespace App\Logging;use Monolog\Handler\FingersCrossedHandler;use Monolog\Handler\FingersCrossed\ErrorLevelActivationStrategy;use Monolog\Handler\StreamHandler;use Monolog\Logger;class BufferedChannel{public function __invoke(array $config): Logger{$logger = new Logger('buffered');$innerHandler = new StreamHandler('php://stderr');$logger->pushHandler(new FingersCrossedHandler($innerHandler,new ErrorLevelActivationStrategy(\Monolog\Level::Error),bufferSize: 200,));return $logger;}}
Then register it as a custom channel in your logging configuration:
12345678910// config/logging.php'buffered' => ['driver' => 'custom','via' => App\Logging\BufferedChannel::class,'tap' => [App\Logging\JsonFormatter::class,App\Logging\RedactSensitiveFields::class,],],
This channel buffers all log records in memory and only flushes them to stderr
when a record at ERROR level or above arrives. If the request completes
without an error, the buffer is discarded and nothing is written.
The bufferSize parameter caps how many records the buffer holds. It's
unbounded by default which could lead to memory exhaustion for long-running
queue workers that process many jobs back-to-back.
It's best to cap the bufferSize to keep memory usage predictable, so set it to
a value that reflects how verbose your debug logging is and how long your
workers run.
For this channel to receive your logs, include it alongside your existing
stderr channel via LOG_STACK:
1LOG_STACK=stderr,buffered
Note that LOG_LEVEL controls the minimum level for the stderr channel (which
references it), but the buffered channel hardcodes level: debug so it always
accepts every record into its buffer regardless of your production LOG_LEVEL
setting. Only the ErrorLevelActivationStrategy determines when the buffer is
flushed.
You can test this by adding a route that either succeeds or fails:
12345678910111213141516171819// routes/web.phpRoute::get('/test-buffered/{fail?}',function (string $fail = 'no') {Log::debug('Step 1: validating input.');Log::debug('Step 2: checking inventory.');Log::info('Step 3: charging payment.');if ($fail === 'yes') {Log::error('Step 4: payment failed.');} else {Log::info('Step 4: payment succeeded.');}return response()->json(['message' => "Done (fail=$fail). Check logs.",]);});
Make sure your LOG_LEVEL environment variable is set to info, then hit the
/test-buffered/no endpoint. You'll see two INFO messages from stderr
channel:
12{"message":"Step 3: charging payment.","level_name":"INFO", ...}{"message":"Step 4: payment succeeded.","level_name":"INFO", ...}
The buffered channel accumulated all four entries in-memory but discarded them
because no error occurred. Now, hit /test-buffered/yes (to simulate error
conditions) and you'll see an ERROR message from stderr as before, plus all
four entries (including the two DEBUG messages) flushed by the buffered
channel:
123456789// stderr channel{"message":"Step 3: charging payment.","level_name":"INFO", ...}{"message":"Step 4: payment failed.","level_name":"ERROR", ...}// buffered channel (the error + full context){"message":"Step 1: validating input.","level_name":"DEBUG", ...}{"message":"Step 2: checking inventory.","level_name":"DEBUG", ...}{"message":"Step 3: charging payment.","level_name":"INFO", ...}{"message":"Step 4: payment failed.","level_name":"ERROR", ...}
The result is zero noise on success and full context on failure.
You'll notice that INFO and ERROR entries appear in both channels when the
buffer flushes. This duplication is inherent to the pattern: the buffered
channel needs to see the ERROR to trigger its flush, and stderr writes
INFO+ as its normal baseline.
In most setups you'll want to avoid the duplication to avoid paying unnecessary
ingestion or egress costs. The cleanest way is to wrap the inner StreamHandler
in a FilterHandler that only passes DEBUG records through. When the buffer
flushes on ERROR, FingersCrossedHandler sends every buffered record to the
inner handler, but FilterHandler discards anything above DEBUG since those
were already written by stderr.
Update BufferedChannel like this:
1234567891011121314151617181920212223242526272829303132<?php// app/Logging/BufferedChannel.phpnamespace App\Logging;use Monolog\Handler\FilterHandler;use Monolog\Handler\FingersCrossedHandler;use Monolog\Handler\FingersCrossed\ErrorLevelActivationStrategy;use Monolog\Handler\StreamHandler;use Monolog\Level;use Monolog\Logger;class BufferedChannel{public function __invoke(array $config): Logger{$logger = new Logger('buffered');$innerHandler = new FilterHandler(new StreamHandler('php://stderr'),Level::Debug,Level::Debug,);$logger->pushHandler(new FingersCrossedHandler($innerHandler,new ErrorLevelActivationStrategy(Level::Error),));return $logger;}}
The FilterHandler constructor takes a minimum and maximum level, so passing
Level::Debug for both limits output strictly to DEBUG records. Now the
flushed output contains only what stderr didn't already write:
The Log::debug() calls still go through the default stack, where stderr
drops them (because LOG_LEVEL=info) and buffered accepts them into its
memory buffer. But INFO goes directly to stderr only, and ERROR goes
directly to buffered only, so there are no duplicate entries:
1234567// stderr channel{"message":"Step 3: charging payment.","level_name":"INFO", ...}{"message":"Step 4: payment failed.","level_name":"ERROR", ...}// buffered channel (DEBUG records only){"message":"Step 1: validating input.","level_name":"DEBUG", ...}{"message":"Step 2: checking inventory.","level_name":"DEBUG", ...}
The out-of-order appearance is only a visual issue in your terminal. Each JSON entry includes a datetime field with microsecond precision, so any log aggregation platform will sort them correctly regardless of the order they arrive.
Exception handling and error logging
Laravel's exception handler is the single most important piece of your logging infrastructure, because it's the last line of defense for errors that aren't caught by application code. Get it wrong and errors disappear silently
How Laravel handles exceptions by default
When an unhandled exception occurs, Laravel's exception handler logs it at the
ERROR level and renders an appropriate response. The default behavior already
does several useful things: it serializes the exception class, message, file,
line, and full stack trace into the log entry.
In most cases, you don't need to override this behavior. What you do need is to ensure that the surrounding context is rich enough to make the logged exception actionable.
Adding context to exceptions
Laravel supports a context() method on exception classes. If your custom
exception defines this method, the returned array is automatically merged into
the log entry's context when the exception is reported:
123456789101112131415161718192021222324252627<?phpnamespace App\Exceptions;use RuntimeException;class PaymentFailedException extends RuntimeException{public function __construct(string $message,private string $orderId,private string $gateway,private string $errorCode,?\Throwable $previous = null,) {parent::__construct($message, 0, $previous);}public function context(): array{return ['order_id' => $this->orderId,'gateway' => $this->gateway,'error_code' => $this->errorCode,];}}
When this exception is thrown and reaches the handler, the resulting log entry
includes both the exception details and your structured business context
automatically. This is cleaner than catching the exception just to add context
to a manual Log::error() call.
Controlling exception reporting
Laravel's bootstrap/app.php lets you customize exception reporting behavior.
You can use reportable() to add logic for specific exception types, or
dontReport() to suppress exceptions that you know are benign:
123456789101112131415161718use App\Exceptions\PaymentFailedException;->withExceptions(function (Exceptions $exceptions) {$exceptions->reportable(function (PaymentFailedException $e) {Log::channel('critical-alerts')->error('Payment failure requires attention.',$e->context());// Return false to prevent default reporting// (which would double-log), or omit the return// to let both the custom and default reporting// happen.return false;});})
Avoiding duplicate logging
A common mistake is catching an exception, logging it manually, and then re-throwing it so that the exception handler logs it again:
123456789// This produces two log entries for the same errortry {$this->processPayment($order);} catch (PaymentFailedException $e) {Log::error('Payment failed.', ['order_id' => $order->id,]);throw $e; // The exception handler also logs this}
The cleaner approach is to let the exception carry its own context (via the
context() method shown above) and let Laravel's exception handler do the
logging. If you need additional custom behavior, use reportable() in the
exception configuration rather than catch-and-rethrow patterns.
When you do need to catch an exception for control flow but still want it
reported, use Laravel's report() helper:
1234567try {$this->processPayment($order);} catch (PaymentFailedException $e) {report($e);// Handle the failure gracefully without re-throwingreturn $this->fallbackResponse($order);}
The report() helper sends the exception through the standard reporting
pipeline exactly once.
Connecting Laravel logs to OpenTelemetry
Everything covered so far makes your logs useful within a single service. But production applications rarely consist of a single service. Your Laravel API might talk to a payment gateway, a notification service, a queue worker, and a database. When something fails, you need to follow the thread across all of them.
OpenTelemetry makes this possible. By routing your Laravel logs through an OpenTelemetry pipeline, each record is normalized into a vendor-neutral data model and enriched with trace and span identifiers that link it to the distributed trace it belongs to.
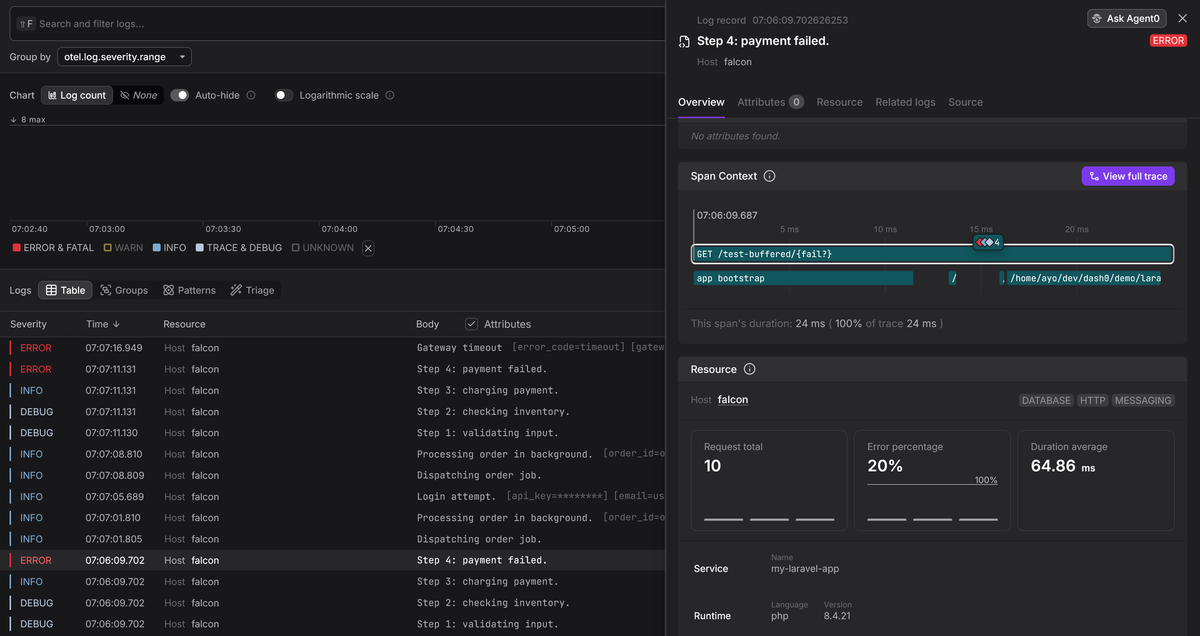
You can start from a log entry that says "payment failed", jump to the distributed trace for that request, see every service involved, and identify exactly where the error originated. Without OpenTelemetry, reconstructing that picture means manually correlating timestamps and request IDs across separate systems.
For a deeper look at how the OpenTelemetry log data model works, including resource attributes, severity mapping, and trace correlation, see our dedicated guide.
Setting up the integration
The keepsuit/laravel-opentelemetry package is the most practical way to add OpenTelemetry to a Laravel application. It handles log export, distributed tracing, metrics, and trace correlation in a single dependency, and integrates with Laravel's logging system directly through a pre-configured Monolog channel.
Install it via Composer:
1composer require keepsuit/laravel-opentelemetry
The package auto-injects an otlp log channel that you can add to your logging
stack. Update your .env to include it alongside your existing stderr
channel:
1LOG_STACK=stderr,otlp
Then configure the exporter to point at your OpenTelemetry Collector (or backend endpoint):
123OTEL_SERVICE_NAME=my-laravel-appOTEL_EXPORTER_OTLP_ENDPOINT=http://localhost:4318OTEL_EXPORTER_OTLP_PROTOCOL=http/protobuf
Your application continues writing JSON logs to stderr for local collection,
and the otlp channel simultaneously exports log records through the
OpenTelemetry SDK. The two pipelines are independent, so you can configure
different minimum levels, apply different processors, or disable one without
affecting the other.
What you get for free
Beyond log export, the package automatically instruments HTTP server requests, database queries (Eloquent and the query builder), queue job processing, Redis commands, and cache operations. Each of these produces distributed trace spans without any code changes.
Trace correlation
is handled automatically too. The package injects the active trace_id into the
log context of every entry, so your structured JSON output from stderr
includes correlation identifiers you can search for manually, and the otlp
channel attaches the full trace and span IDs to each exported LogRecord.
It also detects worker mode automatically. When your application runs under Octane, Horizon, or a standard queue worker, the package adjusts its flush behavior so telemetry is exported correctly in long-running processes rather than being lost when the worker eventually shuts down.
If you need to customize the instrumentation (disable specific auto-instruments, exclude certain routes from tracing, configure sampling), publish the config file:
123php artisan vendor:publish \--provider="Keepsuit\LaravelOpenTelemetry\LaravelOpenTelemetryServiceProvider" \--tag="opentelemetry-config"
This creates config/opentelemetry.php where you can toggle each
instrumentation, configure tail sampling rules, set metrics export intervals,
and more. But the defaults are sensible for most applications, and you can
control the most important settings through
environment variables
alone.
What your logs look like in the OTel data model
When a Laravel log record reaches the OpenTelemetry Collector, it's transformed
into the OpenTelemetry log data model. If you enable the
debug exporter on
the Collector, the output looks something like this (assuming
verbosity: detailed):
123456789101112131415161718192021222324252627282930313233343536372026-06-04T16:48:44.811Z info ResourceLog #0Resource SchemaURL:Resource attributes:-> service.name: Str(my-laravel-app)-> host.name: Str(falcon)-> host.arch: Str(x86_64)-> host.id: Str(4a3dc42bf0564d50807d1553f485552a)-> os.type: Str(linux)-> os.description: Str(6.6.114.1-microsoft-standard-WSL2)-> os.name: Str(Linux)-> os.version: Str(#1 SMP PREEMPT_DYNAMIC Mon Dec 1 20:46:23 UTC 2025)-> process.runtime.name: Str(cli-server)-> process.runtime.version: Str(8.4.21)-> process.pid: Int(14487)-> process.executable.path: Str(/usr/bin/php8.4)-> process.owner: Str(ayo)-> telemetry.sdk.name: Str(opentelemetry)-> telemetry.sdk.language: Str(php)-> telemetry.sdk.version: Str(1.14.0)-> telemetry.distro.name: Str(opentelemetry-php-instrumentation)-> telemetry.distro.version: Str(1.2.1)ScopeLogs #0ScopeLogs SchemaURL: https://opentelemetry.io/schemas/1.38.0InstrumentationScope laravel-opentelemetry 2.2.1LogRecord #0ObservedTimestamp: 2026-06-04 16:48:44.746552064 +0000 UTCTimestamp: 2026-06-04 16:48:44.746473502 +0000 UTCSeverityText: errorSeverityNumber: Error(17)Body: Str(Gateway timeout)Attributes:-> order_id: Str(ord-817)-> gateway: Str(stripe)-> error_code: Str(timeout)Trace ID: 130588ac63b7ae332a58d55c8863d16dSpan ID: b633df644bce662cFlags: 1
The Resource attributes section contains metadata about the service and
runtime environment, attached automatically by the OTel SDK. Your Laravel
context data appears under Attributes, and the Trace ID and Span ID fields
link this log entry directly to the distributed trace for the request that
triggered the log entry.
Seeing it come together in Dash0
Once your telemetry is flowing through the OpenTelemetry Collector, you need to send it somewhere it can be analyzed and correlated across services.
Dash0 is OpenTelemetry-native, which means your logs, traces, and metrics keep their semantic structure from ingestion through to query time. There's no translation layer or proprietary schema mapping sitting between your data and the query engine.
To see it in action, sign up for a free Dash0 trial and configure the Collector's OTLP exporter to point at your Dash0 ingress endpoint. Our PHP integration page has other setup instructions should you need them.
Final thoughts
Laravel's logging system is significantly more capable than its default
configuration suggests. The Context facade, introduced in Laravel 11, makes it
trivial to attach metadata that propagates across log entries and queued jobs
automatically. Combined with structured JSON output and OpenTelemetry
integration, this gives you logs you can actually debug with in production.
For deeper coverage of Monolog's internals, including handlers, processors, and formatters, see our companion guide on logging in PHP with Monolog. For language-agnostic patterns, see our logging best practices guide.
