Last updated: June 8, 2026
Pino Logger Tutorial: A Complete Guide for Node.js
If your Node.js app misbehaves in production, the first thing you reach for is your logs. Using a structured logger means you can actually find what you're looking for when something breaks.
Pino is one of the fastest and well-known logging libraries in the Node.js ecosystem. The benchmarks in its own repo show it consistently outperforming Winston and Bunyan by a significant margin.
The name means "pine tree" in Italian, which at least makes for a good mascot. What matters more is that it outputs clean JSON by default, stays out of your event loop's way, and plays well with modern observability tooling.
There's a lot Pino can do beyond basic "this happened" messages, and this guide covers most of it. You'll see how to configure log levels, shape your output with serializers, integrate with web frameworks, and connect the whole thing to OpenTelemetry so that your logs, traces, and metrics actually talk to each other.
Introducing Pino
Pino has been around since 2014 and even became the default logger for the performance-focused Fastify web framework, which tells you something about its performance characteristics. If you're coming from Winston or Bunyan, the API will feel familiar but the output and philosophy are different.
1npm install pino
Then create a logger and write your first message:
1234import pino from "pino";const logger = pino();logger.info("A log message");
This produces the following structured JSON output:
1234567{"level": 30,"time": 1746617936285,"pid": 11187,"hostname": "Falcon","msg": "A log message"}
A few things worth noting about Pino's default output:
- The output is JSON, or more accurately, newline-delimited JSON (NDJSON).
- The
levelfield is a number, not a string (30meansinfo). - The
timestampis a Unix millisecond epoch (milliseconds since 1, January 1970). - The
pidandhostnamefields are included by default for all logs. They're useful when you're running multiple instances of a service and trying to figure out which one logged something.
For local development, you can pipe the output through pino-pretty to see a more human-readable output:
1npm install --save-dev pino-pretty
1node index.js | npx pino-pretty

It colorizes by level, reformats the timestamp, and makes the output actually
scannable. Run pino-pretty --help if you want to see how far you can push the
formatting:

For the rest of this guide, the examples use raw JSON output since that's the
recommended format for production. pino-pretty is a dev tool, not a production
one.
Working with Pino log levels
Pino supports six log levels out of the box, each mapped to a numeric severity value:
123456logger.trace("A trace message"); // 10logger.debug("A debug message"); // 20logger.info("An info message"); // 30logger.warn("A warn message"); // 40logger.error("An error message"); // 50logger.fatal("A fatal message"); // 60
There's also silent (mapped to Infinity) which suppresses all output
entirely.
By default, Pino only emits info and above, so trace() and debug() calls
are no-ops unless you explicitly lower the threshold. You can see this in action
from the output below, where the first two calls produce nothing:
1234{"level":30,"time":1746627220916,"pid":17145,"hostname":"Falcon","msg":"An info message"}{"level":40,"time":1746627220916,"pid":17145,"hostname":"Falcon","msg":"A warn message"}{"level":50,"time":1746627220916,"pid":17145,"hostname":"Falcon","msg":"An error message"}{"level":60,"time":1746627220916,"pid":17145,"hostname":"Falcon","msg":"A fatal message"}
To change the threshold, set the level option at logger creation. Tying it to
an environment variable is the most practical approach:
12345import pino from "pino";const logger = pino({level: process.env.LOG_LEVEL || "info",});
With LOG_LEVEL=error, only error and fatal get through:
1LOG_LEVEL=error node index.js
12{"level":50,"time":1746628518983,"pid":17909,"hostname":"Falcon","msg":"An error message"}{"level":60,"time":1746628518983,"pid":17909,"hostname":"Falcon","msg":"A fatal message"}
To silence logging entirely, set LOG_LEVEL=silent. This can be handy in test
environments where log output often clutters the test runner output.
Outputting log levels as strings
Pino's numeric levels are internal to Pino. A 30 means nothing to your log
aggregator, your on-call engineer scanning entries at 2am, or any tool outside
the Pino ecosystem. You can fix this with formatters.level():
12345678const logger = pino({level: process.env.LOG_LEVEL || "info",formatters: {level(label) {return { level: label };},},});
12{"level":"info","time":1746629118489,"pid":18290,"hostname":"Falcon","msg":"An info message"}{"level":"warn","time":1746629118489,"pid":18290,"hostname":"Falcon","msg":"A warn message"}
Setting up custom log levels
If the built-in levels don't map well to your domain, you can define your own custom levels:
1234567891011const logger = pino({customLevels: {verbose: 15, // slots in between trace and debugcritical: 55, // slots in between error and fatal},useOnlyCustomLevels: false,});logger.verbose("a very verbose message");logger.info("an info message");logger.critical("a critical system alert");
Each key becomes a method on the logger, and its value sets the priority.
Setting useOnlyCustomLevels: false keeps the built-in levels available
alongside your custom ones. Flip it to true if you want to replace them
entirely.
That said, custom levels are rarely worth it in practice. Pino's defaults
(trace through fatal) match the levels used by most logging systems and
observability platforms, so deviating from them means more translation work
downstream with little upside.
Adjusting Pino's timestamp format
Beyond the level field, you can also control how Pino formats timestamps.
Three built-in options are available under pino.stdTimeFunctions:
epochTime: milliseconds since Unix epoch (the default).unixTime: seconds since Unix epoch.isoTime: ISO 8601 in UTC.
Switching to ISO 8601 is a common choice since it's human-readable without a converter:
123const logger = pino({timestamp: pino.stdTimeFunctions.isoTime,});
1234567{"level": 30,"time": "2025-05-07T16:42:38.849Z","pid": 20350,"hostname": "Falcon","msg": "An info message"}
If you need to rename the time field itself, pass a custom function instead.
The function must return a valid JSON fragment including a leading comma,
because Pino concatenates it directly into the JSON string it's building rather
than merging an object:
1234const logger = pino({level: process.env.LOG_LEVEL || "info",timestamp: () => `,"timestamp":"${new Date().toISOString()}"`,});
1234567{"level": 30,"timestamp": "2025-05-07T16:42:38.849Z","pid": 21305,"hostname": "Falcon","msg": "Hello"}
Customizing the default bindings
Pino includes pid and hostname in every log entry by default. These come
from the logger's bindings, which you can modify using formatters.bindings.
To drop them entirely, set base: null:
123const logger = pino({base: null,});
1{ "level": 30, "time": 1780862019804, "msg": "Hello" }
You can also keep the default fields and add your own fields alongside them. A practical pattern is including your service name, version, and deployment environment so every log entry carries enough context to know exactly where it came from:
123456789101112131415import packageJson from "./package.json" with { type: "json" };const logger = pino({formatters: {bindings: ({ pid, hostname }) => {return {pid,hostname,service: packageJson.name,version: packageJson.version,environment: process.env.NODE_ENV || "development",};},},});
12345678910{"level": "info","time": "2025-05-07T16:42:38.849Z","pid": 21305,"hostname": "Falcon","service": "payments-api","version": "1.4.2","environment": "production","msg": "An info message"}
This pays off when you're running multiple services or deployments and need to filter logs down to a specific version that introduced a regression, or confirm which environment a noisy log is coming from.
Enriching log entries with context
The difference between a useful log and a useless one is almost always the fields around the message. Pino supports this through an optional merging object as the first argument to any log method, with the message as the second:
1logger.info({ userId: "usr_123", action: "login" }, "user signed in");
123456789{"level": "info","time": "2025-05-07T16:42:38.849Z","pid": 21305,"hostname": "Falcon","userId": "usr_123","action": "login","msg": "user signed in"}
That works fine for one-off entries, but passing the same fields on every call
gets old fast. If you're handling a request, you want requestId and userId
on every log that request produces without thinking about it. Child loggers do
exactly that:
12345678const requestLogger = logger.child({requestId: req.headers["x-request-id"],userId: req.user?.id,});requestLogger.info("processing started");requestLogger.info({ items: 42 }, "cart loaded");requestLogger.warn("slow query detected");
123{...,"requestId":"req-abc123","userId":"usr_456","msg":"processing started"}{...,"requestId":"req-abc123","userId":"usr_456","items":42,"msg":"cart loaded"}{...,"requestId":"req-abc123","userId":"usr_456","msg":"slow query detected"}
The child inherits the parent's configuration (level, formatters, transport) but
the bindings are its own. You can also create grandchildren from a child (by
calling .child() again), which is useful for adding even more specific context
deeper into a call stack without losing the outer context.
Logging Node.js errors with context
When an error occurs, pass it as the first argument to a log method. Pino
serializes it automatically and nests the result under an err key:
12345try {throw new Error("something happened!");} catch (someErr) {logger.error(someErr);}
123456789101112{"level": "error","time": "2026-06-07T20:07:53.183Z","pid": 35523,"hostname": "falcon","err": {"type": "Error","message": "something happened!","stack": "Error: something happened!\n at file:///home/ayo/dev/dash0/demo/pinojs-demo/main.js:35:8\n at ModuleJob.run (node:internal/modules/esm/module_job:439:25)\n at async node:internal/modules/esm/loader:666:26\n at async asyncRunEntryPointWithESMLoader (node:internal/modules/run_main:101:5)"},"msg": "something happened!"}
When no message is provided, Pino uses the error's own message as the log msg.
You can override this by passing a string as the second argument, which is
useful when the error message alone doesn't give enough context about where or
why it occurred:
1logger.error(someErr, "payment processing failed");
12345678{"level": "error","time": "2026-06-07T20:10:51.137Z","pid": 36385,"hostname": "falcon","err": {...},"msg": "payment processing failed"}
If you want to attach additional context to the error log, use the merging
object form and make sure to pass the error under the err key. Pino's built-in
error serializer only activates when the error appears under that specific name:
123456789101112try {throw new Error("something happened!");} catch (someErr) {logger.error({err: someErr,statusCode: 500,orderId: "ord_789",},"payment processing failed",);}
12345678910{"level": "error","time": "2026-06-07T20:12:26.927Z","pid": 36938,"hostname": "falcon","err": {...},"statusCode": 500,"orderId": "ord_789","msg": "payment processing failed"}
If you nest the error under any other key, Pino won't recognize it as an error and will log an empty object instead.
12345678logger.error({someErr,statusCode: 500,orderId: "ord_789",},"payment processing failed",);
12345678910{"level": "error","time": "2026-06-07T20:13:29.001Z","pid": 37354,"hostname": "falcon","someErr": {},"statusCode": 500,"orderId": "ord_789","msg": "payment processing failed"}
Notice that someErr is an empty object, which means you'll know something went
wrong but have nothing to debug with. So always use err as the key when
logging errors with Pino.
Shaping log output with serializers
Serializers let you transform specific properties in a log object before they're
written. You've already seen one in action: when you pass an error under the
err key, Pino runs it through a built-in serializer that extracts the type,
message, and stack trace into a clean object. That serializer is registered by
default, but you can see it explicitly:
12345const logger = pino({serializers: {err: pino.stdSerializers.err, // This is the default configuration},});
The output shape it produces is:
12345{type: String, // constructor name, e.g. "TypeError"message: String, // error messagestack: String, // full stack trace}
If this shape doesn't fit your needs, you can replace it with a custom
serializer function. For example, to add the error's cause when present, use:
12345678910const logger = pino({serializers: {err: (err) => ({type: err.constructor.name,message: err.message,stack: err.stack,cause: err.cause?.message,}),},});
12345678910{[...]"err": {"type": "Error","message": "database query failed","stack": "Error: database query failed\n at file:///home/ayo/dev/dash0/demo/pinojs-demo/main.js:44:14\n at ModuleJob.run (node:internal/modules/esm/module_job:439:25)\n at async node:internal/modules/esm/loader:666:26\n at async asyncRunEntryPointWithESMLoader (node:internal/modules/run_main:101:5)","cause": "connection timed out"},[...]}
Beyond err, Pino ships with two more built-in serializers for HTTP request and
response objects. Unlike err, these aren't active by default and need to be
enabled explicitly:
123456const logger = pino({serializers: {req: pino.stdSerializers.req,res: pino.stdSerializers.res,},});
Without them, logging a raw req or res object dumps the entire Node.js
object into your logs, which is enormous and mostly noise. With them, you get a
minimal subset: method, URL, and a handful of other fields for requests; status
code and headers for responses:
123456app.use((req, res, next) => {res.on("finish", () => {logger.info({ req, res }, "request completed");});next();});
1234567891011121314151617181920212223242526{[...],"req": {"method": "GET","url": "/","query": {},"params": {},"headers": {"host": "localhost:3000","user-agent": "curl/8.5.0","accept": "*/*"},"remoteAddress": "::1","remotePort": 57078},"res": {"statusCode": 200,"headers": {"x-powered-by": "Express","content-type": "application/json; charset=utf-8","content-length": "19","etag": "W/\"13-HC2++35is3whVfJkjd0DuXgS5Ao\""}},"msg": "request completed"}
Notice that both request and response headers are still included though, so if your requests carry sensitive information, you'll definitely want to use a custom serialization function or the redaction config covered in the next section.
Redacting sensitive data
Custom serializers work well for shaping specific objects, but if your goal is just to keep sensitive fields out of your logs, Pino's built-in redaction is simpler. You give it a list of field paths and it censors them before writing:
12345678910111213141516const logger = pino({redact: {paths: ["password", "user.creditCard", "*.sensitive"],censor: "[REDACTED]",},});logger.info({user: {id: "user123",password: "supersecret",creditCard: "1234-5678-1234-5678",},sensitive: "This will be redacted",normal: "This will remain",});
1234567891011121314{"level": "info","time": "2025-05-07T16:42:38.849Z","pid": 12345,"hostname": "Falcon","user": {"id": "user123","password": "[REDACTED]","creditCard": "[REDACTED]"},"sensitive": "[REDACTED]","normal": "This will remain","msg": ""}
The paths support dot notation for nested fields and a wildcard * for matching
a key across all top-level objects. The default censor value is [Redacted] but
you can set censor to any string to override it.
If you'd rather drop the field entirely instead of replacing it, use
remove: true:
123456const logger = pino({redact: {paths: ["password", "user.creditCard", "*.sensitive"],remove: true,},});
Routing logs with Pino transports
By default, Pino writes to stdout. Transports let you send logs elsewhere, and each one runs in a separate worker thread so that log I/O never blocks your main event loop.
For example, to write to a file, use:
123456const logger = pino({transport: {target: "pino/file",options: { destination: "logs/app.log", mkdir: true },},});
The mkdir option ensures that the destination directory is automatically
created if it doesn't exist already. If you don't use that option and the parent
directory of the log file doesn't exist, you'll see the following error:
1Error: ENOENT: no such file or directory, open 'logs/app.log'
Note that pino/file has no log rotation support, so you must reach for
pino-roll for in-process rotation or
a system-level tool like logrotate.
If you need to log to multiple destinations at the same time, use the targets
array:
123456789101112131415161718const logger = pino({transport: {targets: [{target: "pino-pretty",options: { colorize: true },},{target: "pino/file",options: { destination: "logs/app.log" },},{target: "pino-opentelemetry-transport",level: "error",},],},});
Each transport can have its own level, so in the example above only error
and fatal entries are forwarded to the OpenTelemetry transport while
everything else goes to the console and the file.
In cloud-native applications, routing logs to multiple destinations from within the app is generally the wrong approach. Your app should write to stdout and let your infrastructure handle the forwarding.
Transports run in a separate worker thread by default, which keeps log I/O off your main event loop. The trade-off is that a hard crash can drop the last few buffered entries before they flush.
Pino automatically handles flushing on clean exits and common signals like
SIGTERM and SIGINT. The one case you can't protect against is SIGKILL
where the OS kills the process immediately and the buffer doesn't get a chance
to drain. This is worth knowing if you're debugging why a fatal log from a
crashed pod never arrived.
If you need synchronous writes for whatever reason, set sync: true at the
transport level:
12345{target: "pino/file",options: { destination: "logs/app.log" },sync: true,}
Pino has a broad transport ecosystem covering databases, log management platforms, and telemetry pipelines. The full list is in the official documentation.
Setting up HTTP request logging
pino-http is the standard middleware for adding structured HTTP request logging to any Node.js HTTP framework.Install it with:
1npm install pino-http
Then register it as middleware. For example, in Express:
123456import express from "express";import pinoHttp from "pino-http";const app = express();app.use(pinoHttp());
That's enough to get structured request and response logs on every request:
12345678910111213141516171819202122232425262728293031{"level": 30,"time": 1780869495491,"pid": 44916,"hostname": "falcon","req": {"id": 1,"method": "GET","url": "/","query": {},"params": {},"headers": {"host": "localhost:3000","user-agent": "curl/8.5.0","accept": "*/*"},"remoteAddress": "::1","remotePort": 35030},"res": {"statusCode": 200,"headers": {"x-powered-by": "Express","content-type": "application/json; charset=utf-8","content-length": "19","etag": "W/\"13-HC2++35is3whVfJkjd0DuXgS5Ao\""}},"responseTime": 3,"msg": "request completed"}
The middleware also attaches a logger to every request object, scoped with a
unique reqId so you can correlate all logs from a single request:
1234app.get("/", (req, res) => {req.log.info("fetching user record");res.json({ message: "hello" });});
By default, req.log includes the full request object on every entry, which
gets noisy. Set quietReqLogger: true to replace it with just the reqId:
1app.use(pinoHttp({ quietReqLogger: true }));
You'll also almost certainly want to suppress logs for health check endpoints
and other smilar low-value HTTP request logs. Use the autoLogging option to
filter them out:
1234567app.use(pinoHttp({autoLogging: {ignore: (req) => ["/healthz", "/readyz"].includes(req.url),},}),);
You can use any logic in the ignore method such as checking headers, user
agents, or request methods, so it's easy to adapt for other noisy but
uninteresting endpoints.
If you want to pass your own Pino instance with custom configuration,
pino-http accepts one. It's how you bring in everything covered earlier in
this guide: custom serializers for req and res, redaction rules, bindings,
and transport configuration:
123const logger = pino({ level: "info" /* ... */ });app.use(pinoHttp({ logger }));
This pattern works similarly across other Node.js frameworks. Fastify has Pino built in as its default logger, so no extra package is needed there.
One thing worth keeping in mind is that request-level details like method, path, status code, and duration are much better captured in traces than in logs. If distributed tracing is in place, your spans will already carry this information.
Integrating Pino with OpenTelemetry
The
@opentelemetry/instrumentation-pino
package adds two things to your Pino setup: log correlation, which injects the
active trace context into every log entry, and log sending, which forwards your
logs to the OpenTelemetry Logs SDK.
The easiest way to get started is with the
@opentelemetry/auto-instrumentations-node
bundle, which includes Pino instrumentation alongside instrumentations for
Express, HTTP, and most other common Node.js libraries:
12npm install --save @opentelemetry/apinpm install --save @opentelemetry/auto-instrumentations-node
For ESM projects, you need to load the instrumentation when starting your
application using NODE_OPTIONS:
123NODE_OPTIONS="--experimental-loader=@opentelemetry/instrumentation/hook.mjs \--import @opentelemetry/auto-instrumentations-node/register" \node index.js
You'll see this warning from the Node.js runtime:
12(node:60742) ExperimentalWarning: `--experimental-loader` may be removed in the future; instead use `register()`:--import 'data:text/javascript,import { register } from "node:module"; import { pathToFileURL } from "node:url"; register("%40opentelemetry/instrumentation/hook.mjs", pathToFileURL("./"));'
Despite what it says, the register() pattern it suggests isn't yet supported
by the OTel instrumentation package at the time of writing. The OTel JS team is
tracking the migration in
issue #4933,
but for now the --experimental-loader approach is the only one that actually
works.
For CommonJS projects, the setup is simpler:
12NODE_OPTIONS="--require @opentelemetry/auto-instrumentations-node/register" \node index.js
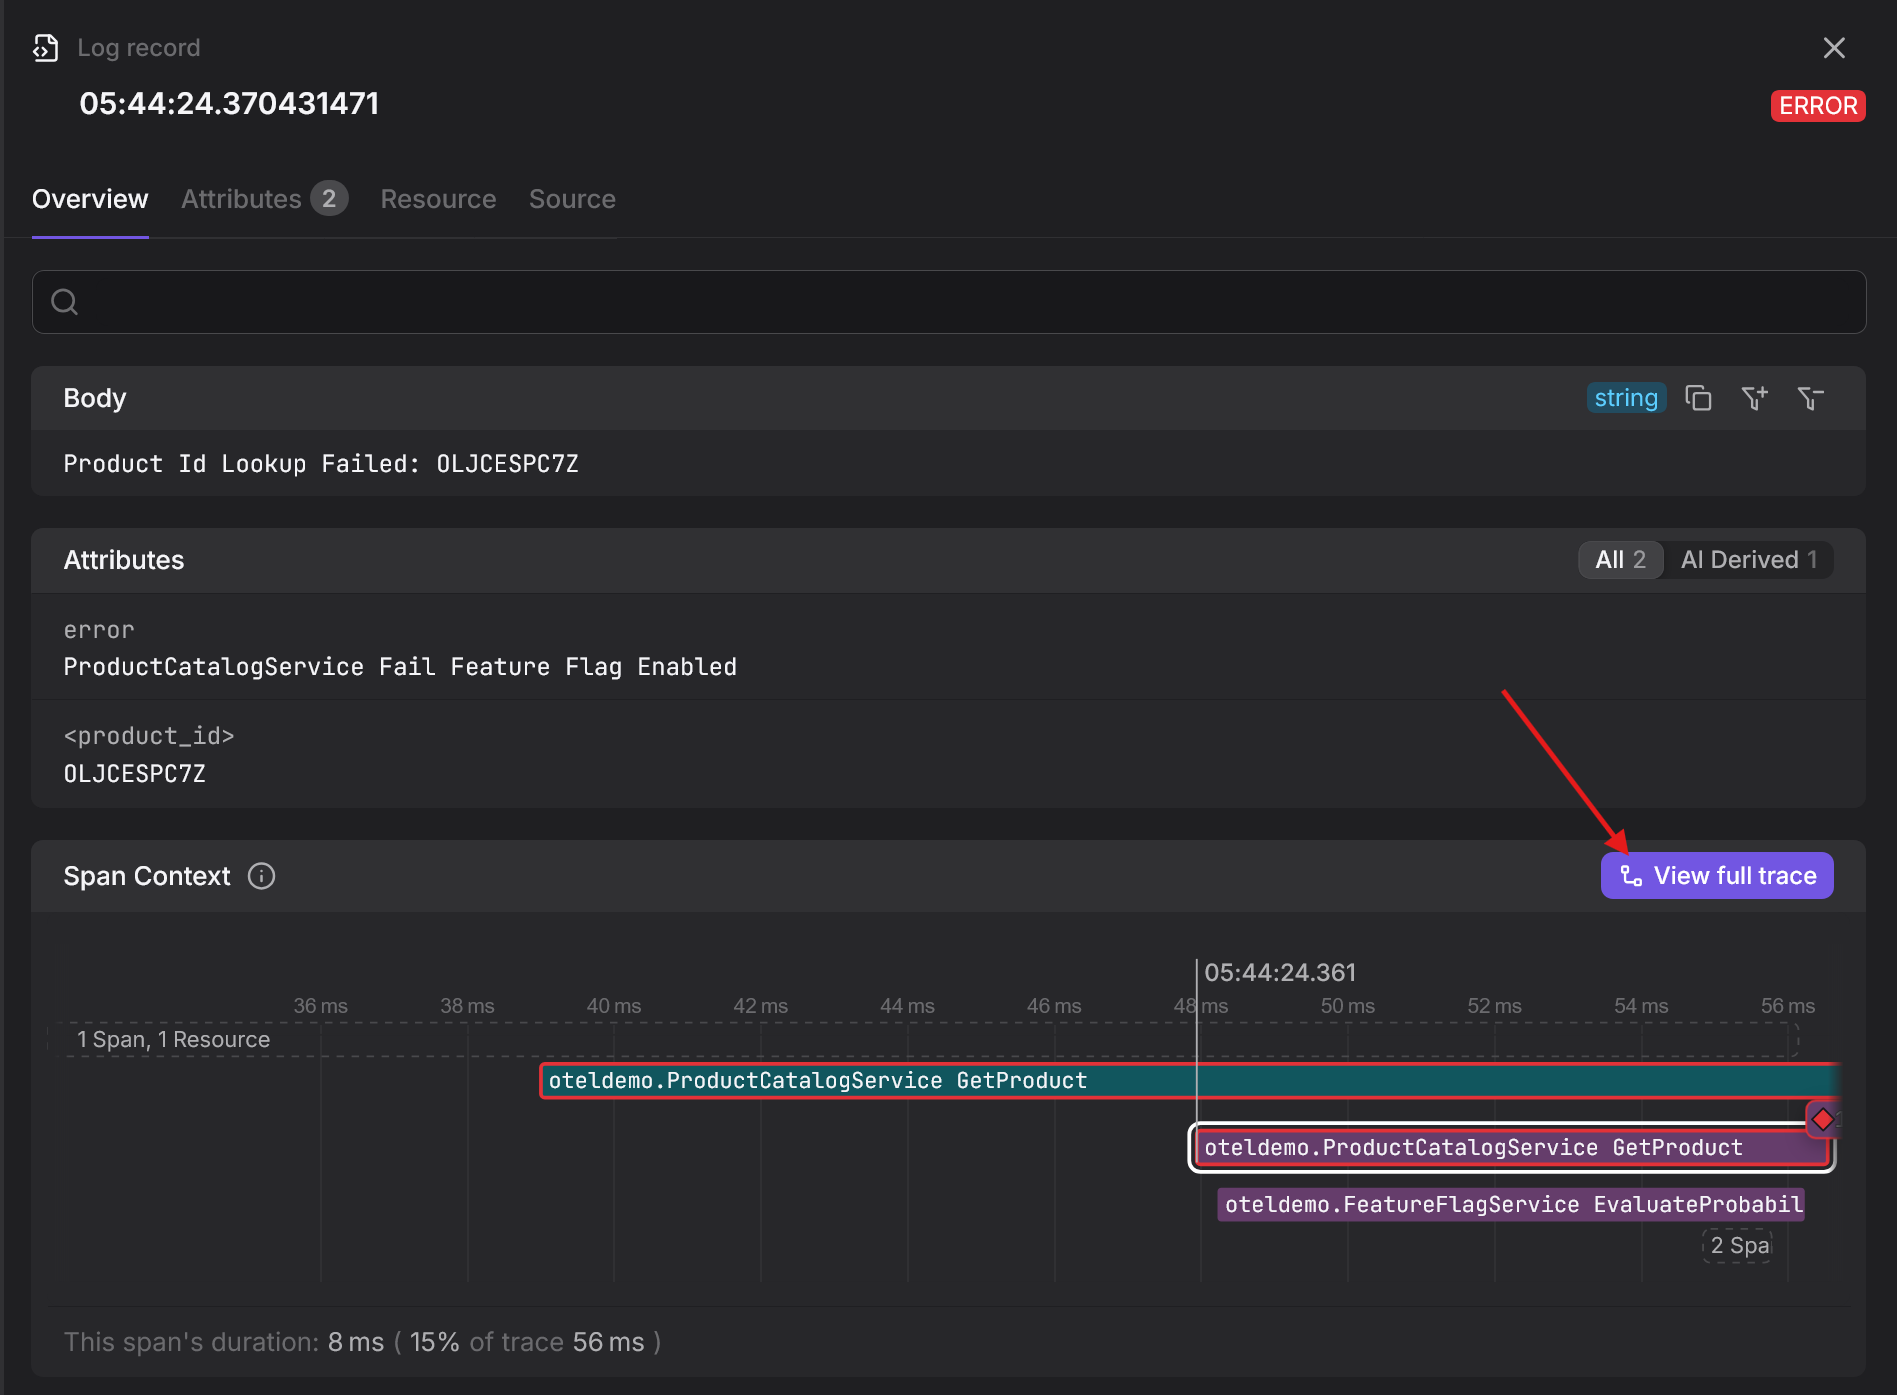
Once the instrumentation is active, log entries produced within a traced request will automatically include the active trace context:
12345678910{"level": "info","time": "2025-05-07T16:42:38.849Z","pid": 21305,"hostname": "Falcon","msg": "user signed in","trace_id": "6c01f40ea85a45fa34ecafe102e56b3c","span_id": "5239529039006e9c","trace_flags": "01"}
This is log correlation in practice. When you're looking at a log entry and want
to know what else happened during that request, the trace_id gets you there
directly without having to grep through surrounding entries.
Beyond correlation, the instrumentation can also forward your logs to the
OpenTelemetry Logs SDK, which then routes them to whatever exporter you've
configured. To verify it's working, set OTEL_LOGS_EXPORTER to console:
1234OTEL_LOGS_EXPORTER=console \NODE_OPTIONS="--experimental-loader=@opentelemetry/instrumentation/hook.mjs \--import @opentelemetry/auto-instrumentations-node/register" \node index.js
You'll see a debug representation of the equivalent OpenTelemetry log record in stdout alongside your regular JSON output:
123456789101112131415161718{resource: {attributes: {'process.pid': 29535,'host.name': 'Falcon',// ... additional system metadata ...}},instrumentationScope: { name: 'pino', version: '9.7.0' },timestamp: 1746780983073000,traceId: '6c01f40ea85a45fa34ecafe102e56b3c',spanId: '5239529039006e9c',traceFlags: 1,severityText: 'info',severityNumber: 9,body: 'user signed in',attributes: { userId: 'usr_123' }}
If you'd prefer to handle log sending without the auto-instrumentation setup,
pino-opentelemetry-transport
is a self-contained alternative that runs its own OTel SDK in a worker thread.
The main difference is that it operates independently of any OTel SDK configured in the main thread, so trace context correlation requires a bit more wiring. It's documentation covers the specifics in more detail.
Centralizing Node.js logs in Dash0
Once your Node.js services are configured to produce structured and context-rich log output, the next step is to send those logs to an observability platform where they can be aggregated, searched, filtered, and correlated with other signals such as traces and metrics.
Dash0 is one such solution that is built on OpenTelemetry's data model from the ground up, so your logs, traces and metrics are preserved exactly as the OTel SDK produced them without being converted into proprietary data structures.
Assuming you've set up the auto-instrumentations-node package as shown above,
you only need to configure the following environmental variables when starting
your service:
123OTEL_SERVICE_NAME="<your_application_name>"OTEL_EXPORTER_OTLP_ENDPOINT="<your_dash0_otlp_endpoint>"OTEL_EXPORTER_OTLP_HEADERS="Authorization=Bearer <your_dash0_secret_token>,Dash0-Dataset=<your_dash0_dataset>"
Within moments, your logs, traces and metrics will begin appearing in the Dash0 interface, where you can inspect, filter, and correlate them as needed:
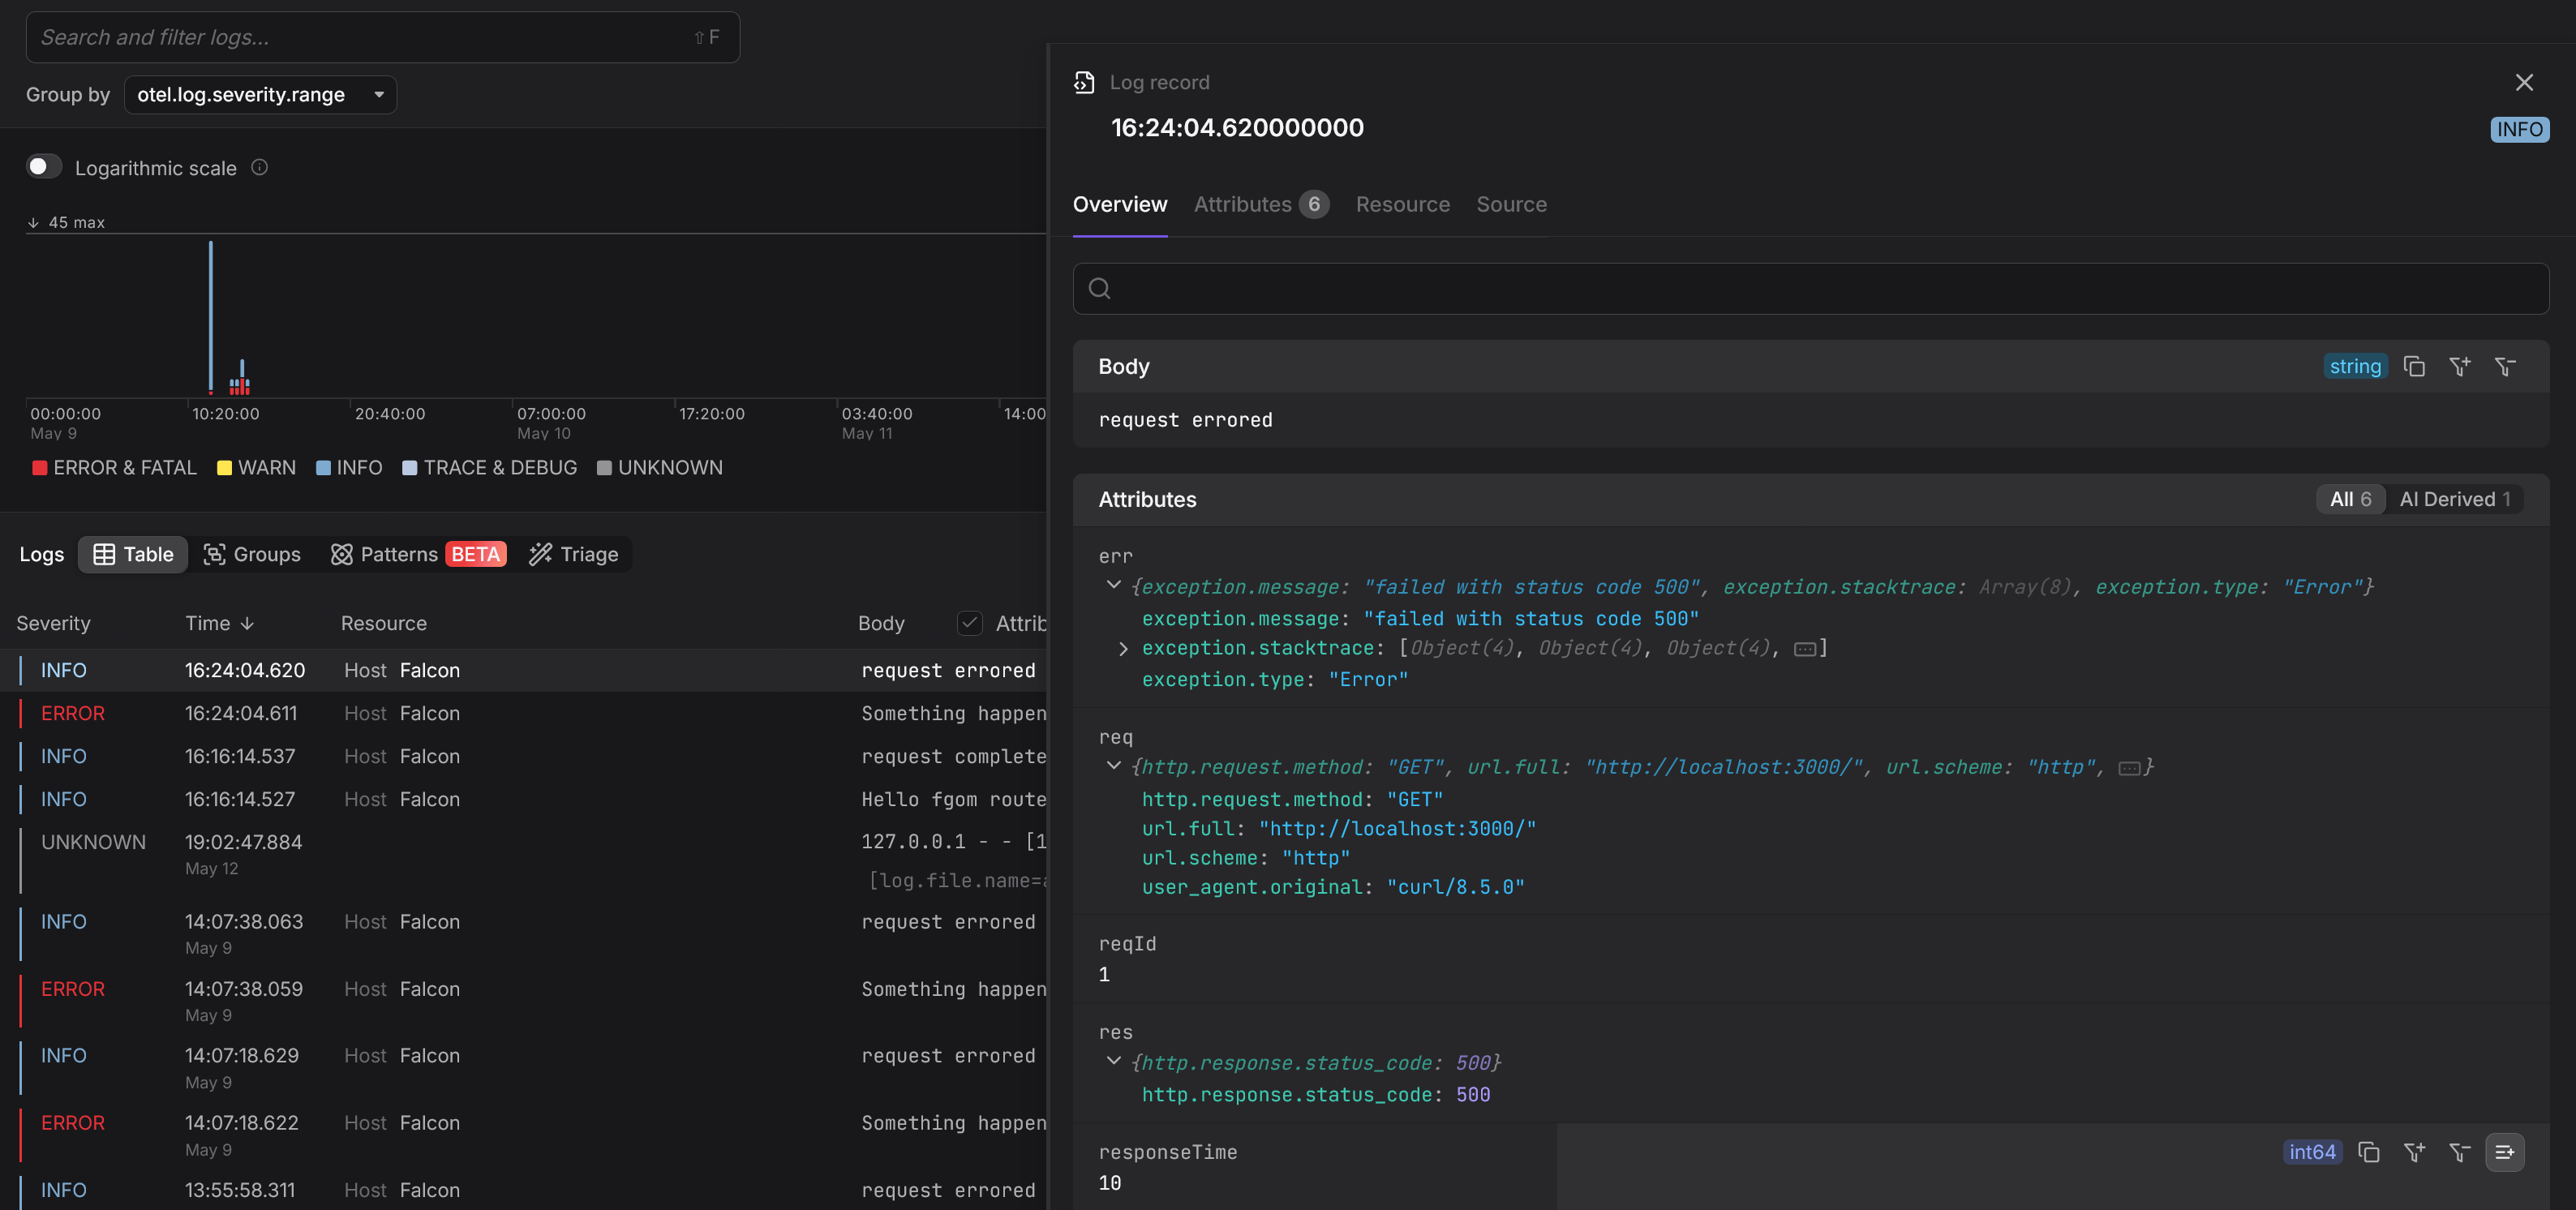
Sending telemetry directly from your application to your observability backend is fine for getting started, but the recommended approach is routing it through the OpenTelemetry Collector instead. The Collector handles batching, retry, filtering, and lets you change your backend without touching application code.
Final thoughts
Pino is a solid foundation for logging in Node.js. It's fast, outputs JSON by default, and flexible enough to grow from a single service to a distributed system with a full OTel pipeline behind it.
The jump from basic logger.info() calls to production-grade logs isn't as
large as it looks. Most of it is configuration: getting your fields right,
redacting what shouldn't be there, and making sure your service metadata shows
up on every entry. The OTel integration then adds trace context without
requiring any changes to how you write log calls.
Where logs fall short, traces pick up. If you're not already instrumenting your Node.js services with OpenTelemetry tracing, that's the natural next step. Our Node.js tracing guide covers it in the same level of detail as this one.
