Last updated: March 11, 2026
Mastering the OpenTelemetry GroupByAttrs Processor
The groupbyattrs processor solves a structural mismatch at the heart of many
OpenTelemetry pipelines where telemetry data that arrives with identifying
attributes trapped at the wrong level of the
OpenTelemetry Protocol (OTLP)
hierarchy.
It promotes specified data-point-level attributes up to the Resource level,
reorganizing spans, metrics, and logs under properly scoped Resources, and
optionally compacts fragmented data by merging duplicated Resource and
InstrumentationScope containers.
This processor is essential whenever you ingest telemetry from flat data sources like file-based log collectors or Fluentbit, or when upstream pipeline stages fragment data that logically belongs together.
Its configuration surface is deliberately minimal, with a single keys array,
but the behavioral implications run deep. Understanding how it restructures
telemetry is essential if you want to avoid subtle pipeline bugs and ensure your
backend receives correctly scoped data.
Why the OTLP hierarchy demands this processor
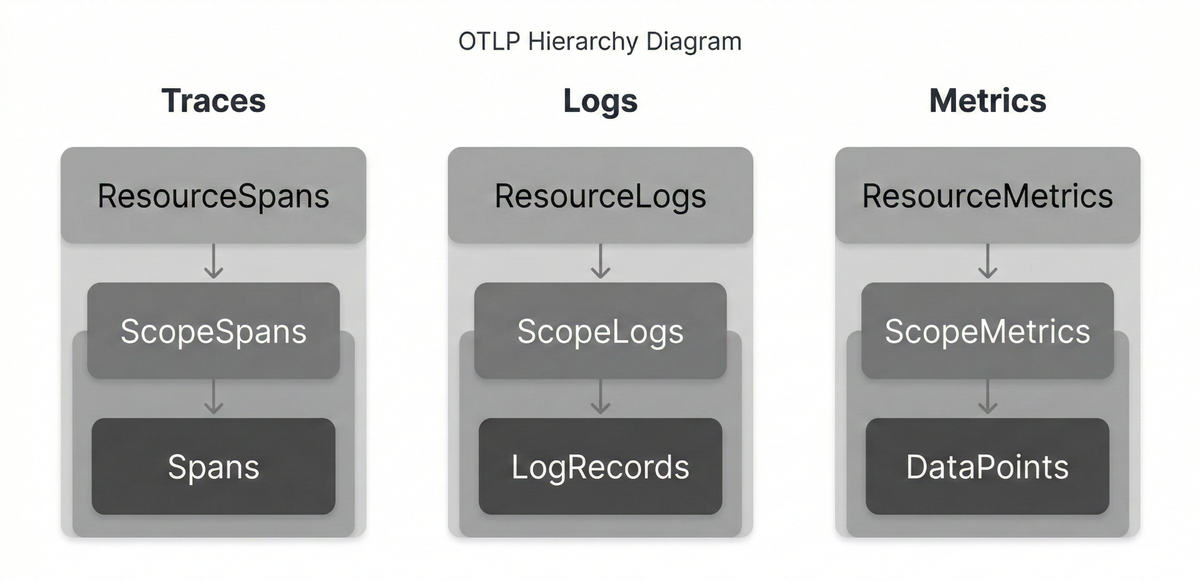
The OTLP data model uses a three-level nesting structure for every signal type:
- Traces nest as
ResourceSpans -> ScopeSpans -> Spans, - Metrics are structued as
ResourceMetrics -> ScopeMetrics -> Metrics, - And Logs are presented as
ResourceLogs -> ScopeLogs -> LogRecords.
Each layer carries a different semantic meaning. The Resource* level
describes the entity producing the telemetry,
the Scope* layer identifies the instrumentation library that generated it, and
the individual records (Spans, Metrics, and LogRecords) contain the event
specific data.
This structure works well when SDKs populate it correctly, but several common ingestion paths break the model. File based log collectors such as the filelog receiver produce flat records where every parsed field becomes a log attribute. A JSON log line has no inherent way to distinguish between fields that identify the source of the telemetry and fields that describe the event.
Receivers that ingest data from Fluent Bit or syslog often show the same
flattening behavior. Even properly instrumented systems can generate fragmented
data later in the pipeline. After passing through processors like groupbytrace
or through load balancing exporters, records that belong to the same logical
resource can end up spread across multiple duplicate ResourceSpans containers.
Fluentbit and syslog receivers exhibit similar flattening. Even properly
instrumented systems can produce fragmented data after passing through the
groupbytrace processor
or a load-balancing exporter, where records that logically share a Resource end
up scattered across multiple duplicate ResourceSpans objects.
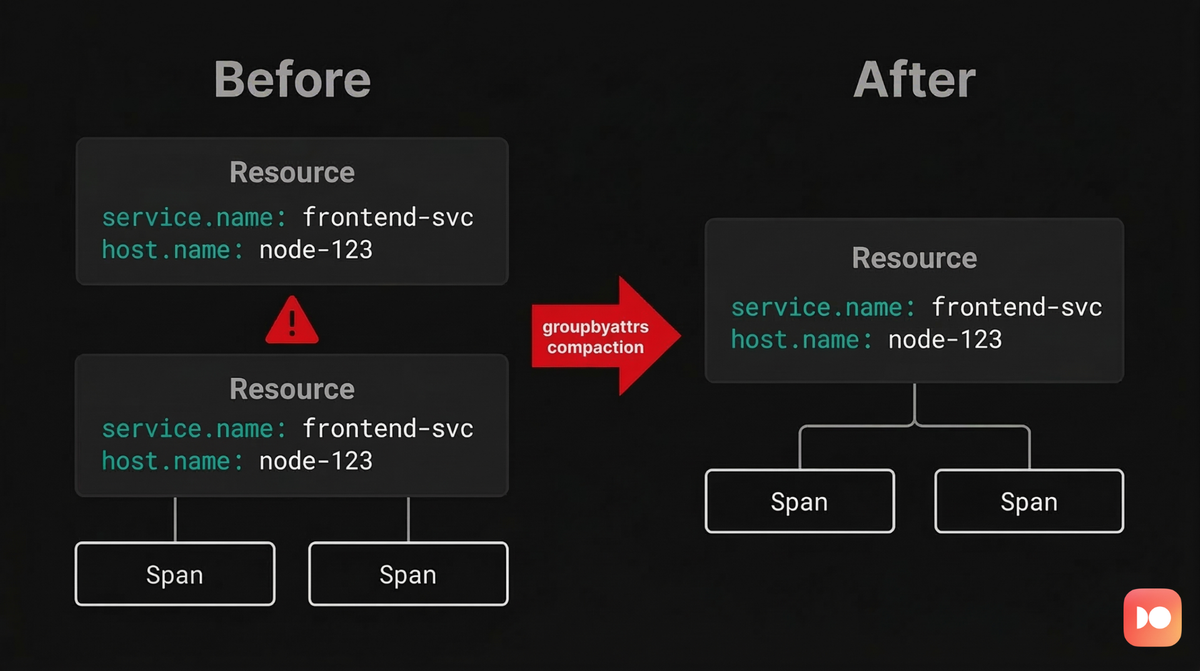
The groupbyattrs processor exists to address these situations. In grouping
mode, it extracts selected attributes from individual records and promotes
them to the Resource level so that telemetry is grouped under the correct
origin. In compaction mode, it merges duplicate Resource* and Scope*
containers without moving attributes.
Both modes produce telemetry that better reflects the OTLP data model while also reducing structural fragmentation. The result is data that serializes more efficiently and aligns more closely with what observability backends expect to receive.
Quick start: structuring flat log data
The easiest way to see the processor in action is with log data since logs collected from file based sources almost always arrive completely flat, with every parsed field stored as a log record attribute with no Resource context attached.
In this example, you'll read a static JSON log file containing entries from
three services running across two hosts. By comparing the
Collector's debug output
before and after enabling the groupbyattrs processor, you'll see how the
structure of the telemetry changes.
Create the log file first and call it app.log. Each line represents a JSON log
event. Attributes such as service.name and host.name describe the source of
the telemetry but appear alongside event specific fields like order_id and
path:
123456{"timestamp":"2026-03-11T10:00:01+01:00","service.name":"checkout","host.name":"host-a","level":"info","msg":"order processed","order_id":"ord-101"}{"timestamp":"2026-03-11T10:00:02+01:00","service.name":"inventory","host.name":"host-b","level":"warn","msg":"stock low","sku":"WIDGET-42"}{"timestamp":"2026-03-11T10:00:03+01:00","service.name":"checkout","host.name":"host-a","level":"error","msg":"payment failed","order_id":"ord-102"}{"timestamp":"2026-03-11T10:00:04+01:00","service.name":"gateway","host.name":"host-a","level":"info","msg":"request routed","path":"/api/checkout"}{"timestamp":"2026-03-11T10:00:05+01:00","service.name":"inventory","host.name":"host-b","level":"info","msg":"restock scheduled","sku":"WIDGET-42"}{"timestamp":"2026-03-11T10:00:06+01:00","service.name":"gateway","host.name":"host-a","level":"warn","msg":"rate limit approaching","path":"/api/search"}
Next, create the Docker Compose configuration:
1234567# docker-compose.ymlservices:otelcol:image: otel/opentelemetry-collector-contrib:0.146.1volumes:- ./otelcol.yaml:/etc/otelcol-contrib/config.yaml- ./app.log:/app.log
Start with a baseline Collector configuration that does not include the
groupbyattrs processor so you can observe the default OTLP structure from the
ingested log records:
123456789101112131415161718192021# otelcol.yamlreceivers:filelog:include:- /app.logstart_at: beginningoperators:- type: json_parsertimestamp:parse_from: attributes.timestamplayout: "%Y-%m-%dT%H:%M:%S%j"exporters:debug:verbosity: detailedservice:pipelines:logs:receivers: [filelog]exporters: [debug]
Then run the Collector and watch the logs:
1docker compose up -d && docker compose logs -f --no-log-prefix otelcol
In the debug output you will see a structure similar to the following:
12345678910111213141516171819202122232425262728293031322026-03-11T09:34:32.699Z info ResourceLog #0Resource SchemaURL:ScopeLogs #0ScopeLogs SchemaURL:InstrumentationScopeLogRecord #0ObservedTimestamp: 2026-03-11 09:34:32.599114727 +0000 UTCTimestamp: 2026-03-11 09:00:01 +0000 UTCSeverityText:SeverityNumber: Unspecified(0)Body: Str({"timestamp":"2026-03-11T10:00:01+01:00","service.name":"checkout","host.name":"host-a","level":"info","msg":"order processed","order_id":"ord-101"})Attributes:-> order_id: Str(ord-101)-> log.file.name: Str(app.log)-> timestamp: Str(2026-03-11T10:00:01+01:00)-> service.name: Str(checkout)-> host.name: Str(host-a)-> level: Str(info)-> msg: Str(order processed)Trace ID:Span ID:Flags: 0LogRecord #1[...]LogRecord #2[...]LogRecord #3[...]LogRecord #4[...]LogRecord #5[...]
All six log records appear under a single empty Resource, regardless of which
service or host actually generated them. Attributes such as service.name and
host.name sit alongside event specific fields like order_id, sku, and
path, rather than describing the origin of the telemetry at the ResourceLog
level.
To a backend, this structure suggests that all six logs came from the same source. As a result you lose the ability to filter logs by service, define per host rules, or correlate logs with traces emitted by the same service.
To fix this, update the Collector configuration to include the groupbyattrs
processor:
12345678910111213141516171819202122232425262728# otelcol.yamlreceivers:filelog:include:- /app.logstart_at: beginningoperators:- type: json_parsertimestamp:parse_from: attributes.timestamplayout: "%Y-%m-%dT%H:%M:%S%j"processors: # Add thisgroupbyattrs:keys:- service.name- host.nameexporters:debug:verbosity: detailedservice:pipelines:logs:receivers: [filelog]processors: [groupbyattrs] # Add thisexporters: [debug]
Restart the container so the new configuration takes effect:
1docker compose up -d --force-recreate
Then read the debug logs once again:
1docker compose logs -f otelcol --no-log-prefix
The structure of the data has changed significantly:
1234567891011121314151617181920212223242526272829303132333435362026-03-11T07:44:22.157Z info ResourceLog #0Resource SchemaURL:Resource attributes:-> service.name: Str(checkout)-> host.name: Str(host-a)ScopeLogs #0ScopeLogs SchemaURL:InstrumentationScopeLogRecord #0[...]LogRecord #1[...]ResourceLog #1Resource SchemaURL:Resource attributes:-> service.name: Str(inventory)-> host.name: Str(host-b)ScopeLogs #0ScopeLogs SchemaURL:InstrumentationScopeLogRecord #0[...]LogRecord #1[...]ResourceLog #2Resource SchemaURL:Resource attributes:-> service.name: Str(gateway)-> host.name: Str(host-a)ScopeLogs #0ScopeLogs SchemaURL:InstrumentationScopeLogRecord #0[...]LogRecord #1[...]
The six flat log records have been reorganized into three properly scoped
ResourceLog objects. The attributes service.name and host.name were
promoted from individual records to the Resource level, and logs produced by the
same service are now grouped together under a single Resource.
This change is not cosmetic.
OpenTelemetry-native backends
rely on the Resource to index and correlate telemetry. Once service.name
appears at the Resource level, logs automatically associate with the correct
service in service maps and appear under the appropriate entity in your
observability platform.
Configuring the groupbyattrs processor
The groupbyattrs processor exposes a single configuration option as seen
below:
123456processors:groupbyattrs/group:keys:- service.name- host.name- deployment.environment.name
The keys field accepts a list of attribute names that the processor should
group telemetry by. When one or more keys are specified, the processor operates
in grouping mode.
In this mode the processor scans every span, log record, or metric data point for the listed attributes. If it finds them, it removes those attributes from the record level and promotes them to the Resource level.
Records that share the same values for the configured keys are then grouped under the same Resource, and any attributes already present on the original Resource are preserved and merged with the promoted attributes.
If keys is empty or omitted entirely, the processor switches to compaction
mode.
123processors:groupbyattrs/compact:# No keys defined -> compaction only
In compaction mode no attributes are moved between levels. Instead, the
processor scans incoming telemetry for Resource* objects that contain
identical attribute sets and merges their contents under a single Resource.
Containers representing instrumentation scopes are also deduplicated by matching
their Name and Version.
There are no timeouts, buffer limits, or cardinality controls to tune. The processor is stateless and synchronous, meaning it processes each incoming batch in a single pass. For every batch it builds new grouping structures, reorganizes the telemetry, and immediately returns the result without storing state between batches.
Understanding compaction mode
Compaction mode focuses on structural cleanup rather than attribute promotion. Its goal is to eliminate duplicate containers that represent the same logical resource but appear multiple times within a batch.
Fragmentation like this is surprisingly common in real pipelines. Some
processors reorganize telemetry in ways that unintentionally duplicate container
structures. The groupbytrace processor, for example, reconstructs complete
traces from scattered spans, but the resulting output can contain multiple
ResourceSpans objects that carry the exact same resource attributes:
123456789101112131415161718192021222324252627282930ResourceSpans #0Resource SchemaURL:-> service.name: Str(checkout)-> host.name: Str(host-a)ScopeSpans #0Scope: checkout.tracerSpan #0TraceID: a1b2c3d4e5f6a1b2c3d4e5f6a1b2c3d4SpanID: 1000000000000001Name: POST /checkoutKind: ServerAttributes:-> http.method: Str(POST)-> http.route: Str(/checkout)ResourceSpans #0Resource SchemaURL:-> service.name: Str(checkout)-> host.name: Str(host-a)ScopeSpans #0Scope: checkout.tracerSpan #0TraceID: a1b2c3d4e5f6a1b2c3d4e5f6a1b2c3d4SpanID: 1000000000000002ParentSpanID: 1000000000000001Name: SELECT ordersKind: ClientAttributes:-> db.system: Str(postgresql)-> db.statement: Str(SELECT * FROM ...)
This is the fragmentation problem. Both spans belong to the same trace, the same
service, and the same instrumentation scope, but they're wrapped in duplicate
ResourceSpans containers because they arrived in separate HTTP requests.
Compaction mode addresses this by scanning each batch and collapsing duplicate
structures. Resource containers with identical attribute maps are combined, and
their child records are merged together. Within each Resource, duplicate
InstrumentationScope containers are also consolidated when their Name and
Version fields match.
123456789processors:groupbyattrs/compact:service:pipelines:traces:receivers: [otlp]processors: [groupbyattrs/compact]exporters: [otlp]
After compaction runs, the two ResourceSpans objects with identical attributes
collapsed into one. The InstrumentationScope was also deduplicated since both
requests shared the same scope name (checkout.tracer):
1234567891011121314151617181920212223ResourceSpans #0Resource SchemaURL:-> service.name: Str(checkout)-> host.name: Str(host-a)ScopeSpans #0Scope: checkout.tracerSpan #0TraceID: a1b2c3d4e5f6a1b2c3d4e5f6a1b2c3d4SpanID: 1000000000000001Name: POST /checkoutKind: ServerAttributes:-> http.method: Str(POST)-> http.route: Str(/checkout)Span #1TraceID: a1b2c3d4e5f6a1b2c3d4e5f6a1b2c3d4SpanID: 1000000000000002ParentSpanID: 1000000000000001Name: SELECT ordersKind: ClientAttributes:-> db.system: Str(postgresql)-> db.statement: Str(SELECT * FROM ...)
The impact becomes most visible in pipelines that export large volumes of telemetry or interact with backends that process data on a per resource basis, since fewer containers translate into fewer serialized structures and more efficient export operations.
Internal metrics for monitoring the processor
The processor emits internal metrics through the Collector's self monitoring
system under the otelcol_processor_groupbyattrs namespace. These metrics allow
you to observe how the processor behaves in production pipelines and verify that
grouping or compaction is occurring as expected.
The most direct indicators are the num_grouped_* and num_non_grouped_*
counters. These track how often the processor finds the configured grouping
attributes in incoming telemetry.
For logs, num_grouped_logs increments when a log record contains at least one
configured key and participates in grouping, while num_non_grouped_logs
increments when a record does not contain any of the configured keys and
therefore passes through unchanged.
Equivalent counters exist for spans (num_grouped_spans and
num_non_grouped_spans) and metric data points (num_grouped_metrics and
num_non_grouped_metrics).
Comparing these counters provides a quick signal about configuration accuracy.
If the non grouped counters dominate, the processor is rarely finding the
attributes you expected. In practice, this means the list of keys does not
match the attribute names produced by the upstream receiver or instrumentation.
The processor also reports histogram metrics describing how many resource groups
it produces for each processed batch. For log pipelines, the log_groups
histogram records the distribution of Resource groups created after processing
each batch. A consistently high value typically reflects either high cardinality
grouping keys or telemetry arriving from many independent sources.
The same pattern exists for traces and metrics through the span_groups and
metric_groups histograms.
To collect these metrics, enable the Collector's telemetry endpoint.
123456789service:telemetry:metrics:readers:- pull:exporter:prometheus:host: "0.0.0.0"port: 8888
Once exposed, the metrics can be scraped with Prometheus or any compatible backend. When you ingest Collector telemetry alongside your application data, you can directly correlate processor behavior with incoming traffic patterns and pipeline configuration changes.
How groupbyattrs compares to related processors
Several OpenTelemetry Collector processors manipulate attributes, but they
operate at different layers of the data model. Understanding the distinction
helps you decide when groupbyattrs is the right tool.
-
The resource processor modifies attributes that already exist at the
Resource*level. It can add, update, or delete resource attributes using static values, but it cannot promote attributes from spans, logs, or metric data points. A common pattern is to rungroupbyattrsfirst to promote attributes, and then use the resource processor to rename or normalize them. -
The attributes processor works exclusively at the record level. It allows you to insert, update, hash, or remove attributes on spans, log records, and metric data points, but it has no ability to move data into the Resource context. In practice this makes it complementary to
groupbyattrs, since the two processors operate on different layers of the OTLP hierarchy. -
The transform processor provides the most flexibility. Using the OpenTelemetry Transformation Language (OTTL), you can write expressions that read and modify data across different contexts. While it's technically possible to reproduce parts of
groupbyattrsbehavior with OTTL, the dedicated processor is both simpler and more efficient for reorganizing telemetry by resource identity. -
The groupbytrace processor often appears alongside
groupbyattrsin real pipelines but serves a completely different purpose. It groups spans by trace ID using stateful buffering so that complete traces can be exported together. Because this reassembly step can produce duplicate Resource containers,groupbyattrsis frequently used afterward to compact the resulting output.
The groupbyattrs processor fills a unique role in the Collector ecosystem. It's the only processor designed to restructure the OTLP hierarchy itself by
creating new Resource containers and moving attributes between levels. This
capability makes it essential when ingesting flat telemetry streams from sources
such as file based log collectors or Fluent Bit.
Final thoughts
The groupbyattrs processor addresses a fundamental structural problem in
OpenTelemetry pipelines: the mismatch between flat data sources and the OTLP
hierarchy. Its two modes (attribute promotion and compaction) handle the two
most common manifestations of this problem, namely misplaced attributes and
fragmented resources.
Despite its small configuration surface, the processor has significant effects on how telemetry flows through a pipeline. Once attributes are promoted they are removed from the individual records, and grouping decisions depend entirely on the configured keys. Therefore, it's worth validating the behavior using the debug exporter or the processor's internal metrics before deploying the configuration broadly.
Whenever you ingest flat log streams, handle syslog style data, or encounter
fragmented resources after other processors have reorganized telemetry,
groupbyattrs becomes a critical step in restoring semantic structure.
When this structure is preserved end to end, observability platforms can reliably associate telemetry with the services, hosts, and environments that generated it. That context is what ultimately allows logs, metrics, and traces to form a coherent view of how your systems behave in production.
Try Dash0 today to see how properly structured OTLP resources unlock service maps, cross-signal correlation, and per-service alerting out of the box.
