Last updated: April 19, 2026
Python Logging with Loguru: From Setup to Production
Logs are often the first place you look when something goes wrong in production. They're your running commentary of what the application is doing and why, and when it fails to do what it's supposed to.
While the
standard logging module
can be configured to produce high-quality telemetry, achieving this requires
significant boilerplate: custom formatters, filters, handlers, and complex YAML
configurations. It's powerful, but it's not simple.
So what if you could achieve the same structured, contextual, and production-ready logging with a fraction of the complexity?
This is the promise of Loguru. It's a logging library designed from the ground up to replace the cumbersome setup of the standard library with a simple, unified API that supports modern observability practices.
This guide will directly address the patterns and pain points of the standard logging module and show how Loguru simplifies them without compromising on effectiveness and flexibility.
By the end, you'll have a lean, modern logging setup that feels natural to use and is ready for production.
Let's get started!
Understanding the Loguru philosophy
With Python's built-in logging module, the common pattern is to configure
everything once by setting up your handlers, formatters, and filters, and then,
in each module, grab a namespaced logger with logging.getLogger(__name__).
It's a solid system, but the initial configuration can feel heavy: multiple
objects to wire together, YAML or dictConfig to maintain, and a lot of moving
parts if you just want to get clean logs quickly.
Loguru takes a far simpler approach. Instead of asking you to set up a hierarchy of loggers, it gives you one ready-to-go logger that you just import (after you install it first):
123from loguru import loggerlogger.info("Hello, Loguru!")
That's it. The logger you imported is configured to print colorized messages
to the stderr, complete with timestamps, log levels, module names, and line
numbers:
12025-09-02 13:53:03.686 | INFO | __main__:<module>:3 - Hello, Loguru!
While this is great for local development and is easy to read at a glance, especially with the colors, you'll want something more machine-friendly in production environments such as JSON.
Start by removing the default stderr handler so you can make a fresh start:
123from loguru import loggerlogger.remove() # remove the default configuration
Then add your own sink with the exact behavior you want. In Loguru, a sink is simply a destination for your logs. It could be the standard output, a file path, a custom function, or even a logging.Handler from the standard library.
Instead of wiring up separate handlers, formatters, and filters, you'll
configure everything in one place with a single call to logger.add():
1logger.add(sys.stdout, level="INFO", serialize=True)
That single add() call completely defines the sink: where logs go, how they're
formatted, and which levels get through. The serialize argument is what causes
the output to be formatted as a JSON object, which looks something like this:
123456789101112131415161718192021222324{"text": "2025-09-02 17:08:04.498 | INFO | __main__:<module>:8 - Application started\n","record": {"elapsed": { "repr": "0:00:00.004885", "seconds": 0.004885 },"exception": null,"extra": {},"file": {"name": "main.py","path": "/Users/ayo/dev/dash0/demo/loguru-demo/main.py"},"function": "<module>","level": { "icon": "ℹ", "name": "INFO", "no": 20 },"line": 8,"message": "Application started","module": "main","name": "__main__","process": { "id": 65239, "name": "MainProcess" },"thread": { "id": 8437194496, "name": "MainThread" },"time": {"repr": "2025-09-02 17:08:04.498902+02:00","timestamp": 1756825684.498902}}}
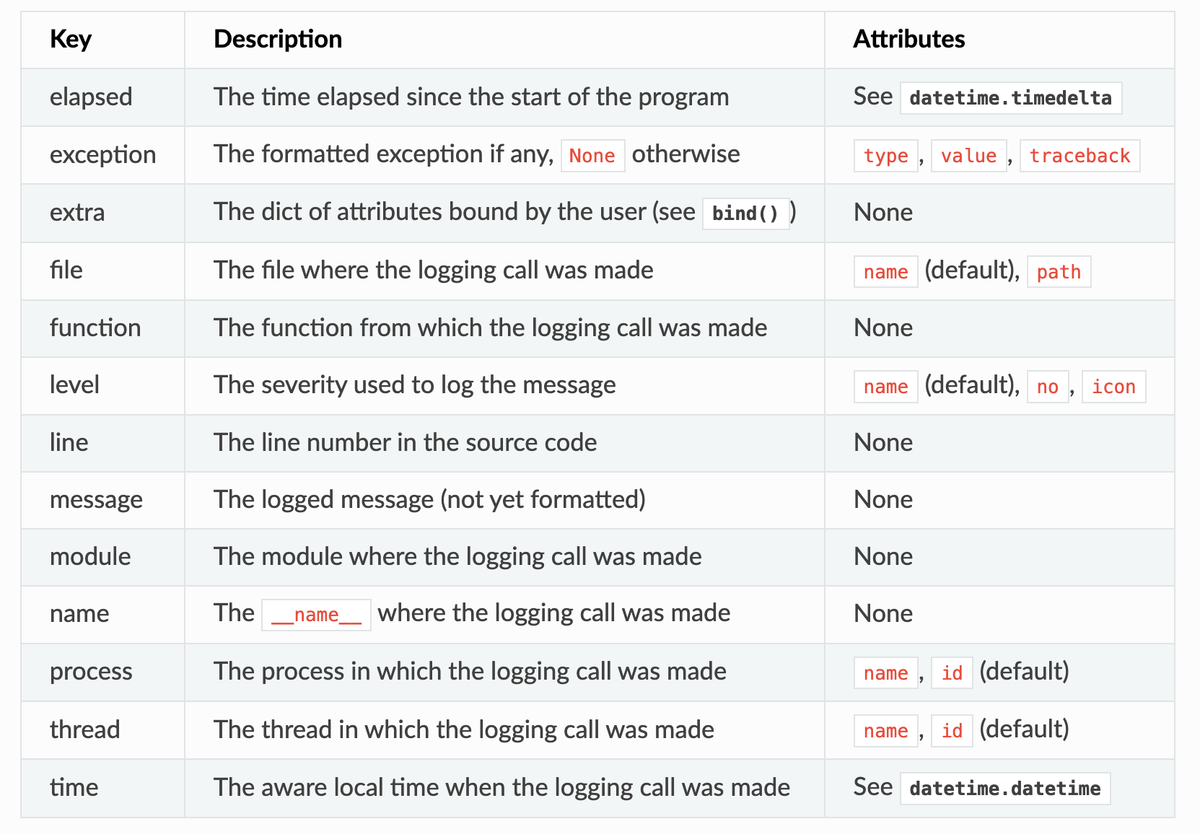
This structure is deliberately rich, and it includes everything Loguru knows about the log event, including timestamps, process and thread IDs, the module and line number, even elapsed time since the program started.
If that feels too heavy for your needs, you don't have to stick with the default. Loguru lets you provide a custom serializer function to control exactly how log records are turned into JSON. That way, you can keep the fields that matter and drop the rest.
To do this reliably, you need a two-step process to avoid conflicts with
Loguru's internal formatter. First, you'll define a function that serializes
your log record into the desired JSON format. Second, you'll use Loguru's
patch() method to add this JSON string as a new field to the record. Finally,
you'll tell the sink to only output that new field through format:
1234567891011121314151617181920212223242526272829303132333435import sysimport jsonfrom loguru import loggerimport tracebacklogger.remove()def serialize(record):subset = {"time": record["time"].isoformat(),"level": record["level"].name,"message": record["message"],}# Merge extra fields directly into the top-level dictif record["extra"]:subset.update(record["extra"])if record["exception"]:exc = record["exception"]subset["exception"] = {"type": exc.type.__name__,"value": str(exc.value),"traceback": traceback.format_exception(exc.type, exc.value, exc.traceback),}return json.dumps(subset)def patching(record):record["serialized"] = serialize(record)logger = logger.patch(patching)logger.add(sys.stdout, level="INFO", format="{serialized}")logger.info("Application started")
This produces a much slimmer JSON log:
12345{"time": "2025-09-02T17:58:09.538713+02:00","level": "INFO","message": "Application started"}
Note that all following examples in this guide will assume that you're using
this custom serializer. For further customization, you can find all the
available record fields in the
Loguru documentation.
How log levels work in Loguru
Just like the standard logging module, Loguru uses
log levels to annotate the
severity and control the verbosity of your logs. Levels let you decide which
messages are worth keeping and which ones to ignore, especially once your
application is running in production.
Out of the box, Loguru supports the familiar set of levels:
| Level | Numeric value | Typical use case |
|---|---|---|
TRACE | 5 | Ultra-verbose debugging (finer than DEBUG). |
DEBUG | 10 | Detailed diagnostics for developers. |
INFO | 20 | Normal application events. |
SUCCESS | 25 | A Loguru-specific level, for happy paths. |
WARNING | 30 | Potential problems worth attention. |
ERROR | 40 | An operation failed. |
CRITICAL | 50 | Severe failures, system at risk. |
Notice that Loguru adds two extra levels compared to the standard library:
TRACEfor when evenDEBUGisn't enough.SUCCESSas a positive counterpart toWARNINGor which could be handy for marking milestones.
You can log at these levels using corresponding methods on the logger:
1234567logger.trace("Function entered")logger.debug("Fetching user details")logger.info("Application started")logger.success("Background job completed")logger.warning("Cache miss")logger.error("Database update failed")logger.critical("Out of memory!")
If you ever need to create a custom level, you can do so with the level() method:
1logger.level("FATAL", no=60, color="<red><bold>", icon="!!!")
Then you can use the generic log() method and provide the custom level's name:
1logger.log("FATAL", "Out of memory!")
Controlling which logs appear
Every sink that's added with logger.add() can be given a minimum level.
Messages below that threshold are dropped before they're written. For example:
12345678910import sysfrom loguru import loggerlogger.remove()logger.add(sys.stdout, level="WARNING")logger.debug("Debug message") # ignoredlogger.info("Informational") # ignoredlogger.warning("A warning") # loggedlogger.error("An error") # logged
A common pattern is using environment variables to set the level so you can bump verbosity up or down without touching the code.
Loguru doesn't read environment variables automatically, but you can grab the
value yourself (with os.getenv) and feed it into logger.add():
12345import oslog_level = os.getenv("LOG_LEVEL", "INFO").upper()logger.add(sys.stdout, level=log_level)
Now you can control logging through the LOG_LEVEL variable:
1LOG_LEVEL=WARNING python main.py
Effortless contextual logging
A common pain point with logging is the lack of context. A message like “Failed to update record” doesn't tell you much on its own. Which record? For which user? During which request? Without those details, you're left guessing.
With Loguru, you don't have to cram all of that context into the message string itself. Every logging call can include extra key–value pairs, and they'll automatically be attached to the record.
1logger.error("Failed to update record", user_id="usr-1234", record_id="rec-9876")
Assuming you're using the custom JSON serializer shown earlier, you will observe the following output:
1234567{"time": "2025-09-02T19:23:17.150211+02:00","level": "ERROR","message": "Failed to update record","user_id": "usr-1234","record_id": "rec-9876"}
This approach works fine for adding one-off contextual fields to a log record. But if you need certain dynamic per-request fields (like a correlation ID) to appear across multiple fields, it would be tedious to pass this information around manually.
That's where Loguru's bind() method comes in. With it, you can attach context
to a logger once, and it will automatically carry through to every log call that
uses it.
Here's an example:
1234request_logger = logger.bind(request_id="req-42", user_id="usr-1234")request_logger.info("Fetching user profile")request_logger.error("Failed to update record")
Both of the resulting log entries will include the request_id and user_id
without you having to repeat them each time:
12{"time": "2025-09-02T20:26:37.400265+02:00", "level": "INFO", "message": "Fetching user profile", "request_id": "req-42", "user_id": "usr-1234"}{"time": "2025-09-02T20:26:37.400330+02:00", "level": "ERROR", "message": "Failed to update record", "request_id": "req-42", "user_id": "usr-1234"}
While bind() works well for adding context to logs in the same scope, it's
often more useful to attach context for the duration of a block of code, such as
the lifetime of an HTTP request in a web app.
That's where logger.contextualize() comes in. It's a context manager that
pushes values into the logging context when you enter the block, and
automatically removes them when you exit.
123456789101112131415161718192021222324252627282930313233343536373839404142434445464748495051525354555657585960616263646566676869import sysimport jsonfrom loguru import loggerimport osfrom fastapi import FastAPI, Requestimport uuidimport time# ...existing logging configurationapp = FastAPI()@app.middleware("http")async def add_request_context(request: Request, call_next):start_time = time.monotonic()request_id = request.headers.get("X-Request-ID", str(uuid.uuid4()))client_ip = request.headers.get("X-Forwarded-For", request.client.host)user_agent = request.headers.get("user-agent", "-")with logger.contextualize(request_id=request_id):logger.info("Incoming {method} request to {path}",method=request.method,path=request.url.path,client_ip=client_ip,user_agent=user_agent,)response = await call_next(request)duration_ms = (time.monotonic() - start_time) * 1000log_level = "INFO"if response.status_code >= 500:log_level = "ERROR"elif response.status_code >= 400:log_level = "WARNING"logger.log(log_level,"{method} {path} completed with status {status} in {duration:.2f} ms",method=request.method,path=request.url.path,status=response.status_code,duration=duration_ms,)return response@app.get("/users/{user_id}")async def get_user(user_id: str):with logger.contextualize(user_id=user_id):logger.info("User profile request received.")return {"user_id": user_id}if __name__ == "__main__":import uvicornuvicorn.run("main:app",host="0.0.0.0",port=8000,reload=False,access_log=False,)
With contextualize(), you only need to declare the context once at the start of the request. The middleware guarantees that every log line for that request will have the right identifying fields, and they'll disappear as soon as the request finishes.
The result is clean, consistent, and scoped contextual logging which is exactly what you need to correlate events in production without cluttering your log calls.
Once you send some requests to that route, you'll notice how each log includes the same request_id:
123{..., "message": "Incoming GET request to /users/12", "request_id": "598e2e5f-e33d-4f05-a658-0a8287d766a6", "method": "GET", "path": "/users/12", "client_ip": "127.0.0.1", "user_agent": "curl/8.7.1"}{..., "message": "User profile request received.", "request_id": "598e2e5f-e33d-4f05-a658-0a8287d766a6", "user_id": "12"}{..., "message": "GET /users/12 completed with status 200 in 1.80 ms", "request_id": "598e2e5f-e33d-4f05-a658-0a8287d766a6", "method": "GET", "path": "/users/12", "status": 200, "duration": 1.7961669946089387}
Error and exception logging with Loguru
The simplest way to capture errors in Loguru is by calling logger.error() and
including the exception details if you're in an except block:
123456from loguru import loggertry:1 / 0except Exception as e:logger.error("Something went wrong: {}", e)
This will log the error message (division by zero), but not the full traceback which is a crucial piece of context that'll help you debug the issue.
To capture the full exception, you'll need to use the logger.exception()
method. It exposes a richer record["exception"] object which includes the
error type, value, and complete Python traceback object:
1234try:1 / 0except Exception as e:logger.exception("Something went wrong: {}", e)
This logs the message at ERROR level and includes the full traceback. If
you're using our custom JSON serializer, you'll see the fields in a structured
form:
1234567891011121314{"time": "2025-09-03T07:55:37.157368+02:00","level": "ERROR","message": "Something went wrong: division by zero","exception": {"type": "ZeroDivisionError","value": "division by zero","traceback": ["Traceback (most recent call last):\n"," File \"/Users/ayo/dev/dash0/demo/loguru-demo/main.py\", line 50, in <module>\n 1 / 0\n ~~^~~\n","ZeroDivisionError: division by zero\n"]}}
You might also see a colorized traceback in your terminal as follows despite serializing to JSON:
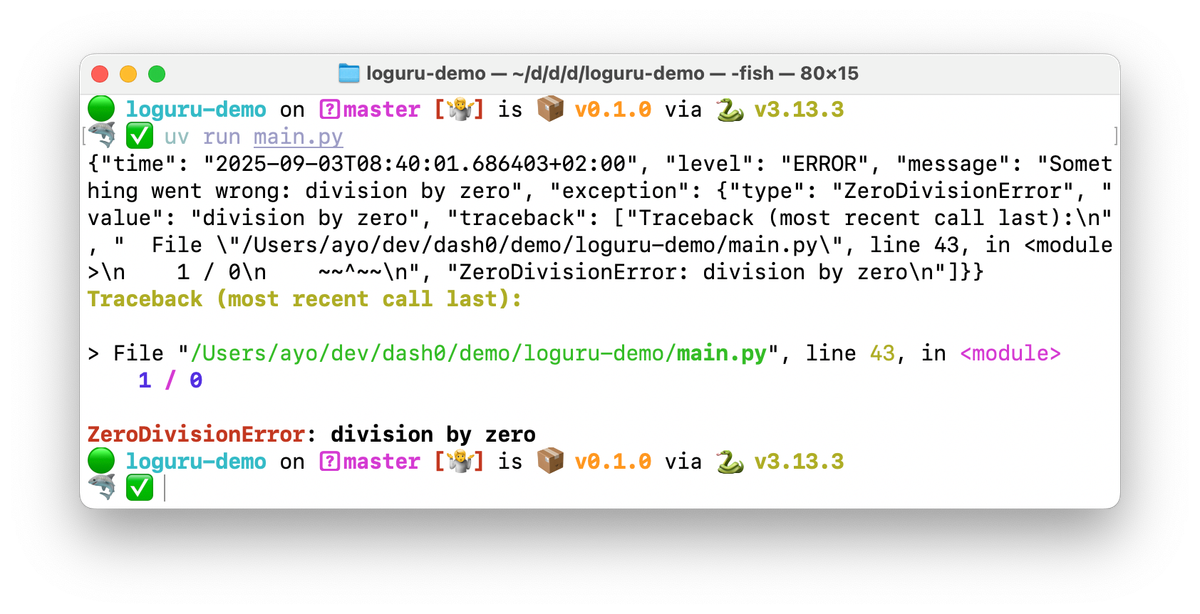
This happens because Loguru tries to be helpful: if a log record contains an
exception but the sink's format string doesn't explicitly handle it (with
{exception}), Loguru appends the formatted traceback by default.
To fix this, you can use a custom function to define the format of the logs as follows:
1234def custom_formatter(record):return "{serialized}\n"logger.add(sys.stdout, level="INFO", format=custom_formatter)
Even though we're simply returning the same {serialized} format, using the
custom_formatter() function tells Loguru to output exactly and only the
content of our pre-formatted JSON string, so that the colorized error log will
no longer appear in the console.
Using the catch() decorator
For handled or unhandled exceptions, you can use the
@logger.catch decorator
or with logger.catch(): context manager. It automatically catches any
exception, logs it with a full stack trace, and then re-raises it:
1234567from loguru import logger@logger.catchdef divide(a, b):return a / bdivide(1, 0)
This produces a formatted and informative traceback as before:
123456789101112131415{"time": "2025-09-03T08:48:20.779242+02:00","level": "ERROR","message": "An error has been caught in function '<module>', process 'MainProcess' (34502), thread 'MainThread' (8437194496):","exception": {"type": "ZeroDivisionError","value": "division by zero","traceback": ["Traceback (most recent call last):\n"," File \"/Users/ayo/dev/dash0/demo/loguru-demo/.venv/lib/python3.13/site-packages/loguru/_logger.py\", line 1297, in catch_wrapper\n return function(*args, **kwargs)\n"," File \"/Users/ayo/dev/dash0/demo/loguru-demo/main.py\", line 44, in divide\n return a / b\n ~~^~~\n","ZeroDivisionError: division by zero\n"]}}
The diagnose and backtrace parameters
One of Loguru’s most powerful debugging features is its ability to show the
values of local variables directly inside the stack trace. Enabling
diagnose=True when adding a sink tells Loguru to include this extra detail,
making it far easier to understand why a line of code failed.
This feature is fantastic during development but should never be used in
production. With diagnose=True,
sensitive information such as passwords, tokens, or personal data
can easily end up in your logs. Always disable it in production by setting
diagnose=False.
For production you’ll also want to keep tracebacks focused on your own code.
Setting backtrace=False trims away the noise from deep library internals,
leaving you with a concise and readable stack trace.
1234567logger.add(sys.stdout,level="INFO",serialize=True,diagnose=False, # Avoid leaking sensitive databacktrace=False # Show only relevant frames)
Improving logging performance
Writing to files or sending logs over the network is I/O-heavy, and every call to log forces the calling thread to wait until the operation completes. Multiply that across many threads, and those small pauses can add up to real slowdowns.
Loguru ensures that messages stay clean and consistent even in these scenarios. All sinks are thread-safe by default so that when multiple threads log to the same resource, Loguru uses internal locks so that each message is written fully before the next begins. This prevents overlapping or corrupted log lines without any extra work on your part.
If you want to remove even that small blocking cost, the fix is to make logging asynchronous. Instead of writing directly, worker threads push log records into an in-memory queue and continue immediately. A background thread pulls from the queue and performs the slow I/O, so your main application is never delayed.
Loguru makes this pattern effortless. Just pass enqueue=True when you add a
sink, and it automatically sets up the queue and background worker for you:
1234567from loguru import loggerlogger.add("file.log",level="INFO",enqueue=True # non-blocking and safe across threads/processes)
But when your application is shutting down, there may still be messages sitting in that queue that haven't been written yet. If the program exits immediately, those messages will be lost.
That's where
logger.complete()
comes in. It flushes the queue by waiting until all enqueued log records are
processed, and then stops the background worker cleanly.
It can be called from both synchronous or asynchronous code (with await). The
typical use case is at shutdown, or right before your process exits, when you
want to make sure that all logs have been written out:
12345678from fastapi import FastAPIfrom loguru import loggerapp = FastAPI()@app.on_event("shutdown")async def shutdown_event():await logger.complete()
Lazy evaluation of expensive functions
Sometimes you want to log verbose or expensive details in development, but avoid
paying the cost of computing them in production.
Loguru’s opt(lazy=True) method
makes this possible by only evaluating values if the log message actually passes
the sink’s level filter:
123456def expensive_function():# Simulate something costlytime.sleep(2)return 42logger.opt(lazy=True).debug("Expensive result: {x}", x=lambda: expensive_function())
Here, if the configured sink is set to INFO or higher, expensive_function()
is never called. The purpose of the lambda is to defer execution, so that
Loguru can decide at runtime whether to actually evaluate it.
Beyond lazy evaluation, opt() also provides other per-message tweaks for
handling stack traces, formatting, and context when you need them.
Writing logs to files
While the 12-Factor App methodology
recommends logging to standard output, many
deployments do require file-based logging. Loguru has powerful, built-in
rotation and retention mechanisms
that are trivial to configure:
12345678logger.add("my_app.log",rotation="50 MB", # Rotates when the file reaches 50 MBretention="5 days", # Keeps logs for 5 dayscompression="zip", # Compresses old log fileslevel="INFO",enqueue=True)
However, it is often a better practice to offload log rotation to a dedicated
system utility like
logrotate so that
application concerns are cleanly separated from operational concerns. This means you would simply log to a file and let logrotate handle the rest.
Disabling Loguru in tests
When running automated tests, logs are often more distracting than helpful as they clutter the output, and make failures harder to read. Most of the time you either want logging completely disabled or reduced to only critical errors.
Because all logging goes through sinks, you can control output globally by adding or removing them in your test configuration. The most straightforward approach is to remove all sinks at the start of your tests. For example:
1234567import pytestfrom loguru import logger@pytest.fixture(autouse=True)def disable_loguru():# Remove all configured sinks so nothing is printed during testslogger.remove()
With this fixture, every test runs with Loguru disabled by default. If you’d rather keep Loguru active but silence its output by redirecting logs to an in-memory buffer instead of the console or a file, you can use the following instead:
1234567import iofrom loguru import logger@pytest.fixture(autouse=True)def swallow_loguru():logger.remove()logger.add(io.StringIO()) # Logs go here but never reach stdout
Redirecting standard logging into Loguru
Frameworks, libraries, and dependencies all bring their own loggers, and nearly
all of them use Python's standard logging module. The result is a flood of
messages that don't match your application's formatting, don't benefit from your
structured JSON output, and can quickly overwhelm you with noise unless
carefully managed.
Instead of configuring dozens of different loggers by hand, you can redirect
every standard logging call into your Loguru pipeline. You do this by
configuring an InterceptHandler:
123456789101112131415161718192021222324import logging# [...your existing Loguru configuration]class InterceptHandler(logging.Handler):def emit(self, record):# Get corresponding Loguru level if it existstry:level = logger.level(record.levelname).nameexcept ValueError:level = record.levelno# Find caller from where originated the logged messageframe, depth = logging.currentframe(), 2while frame and frame.f_code.co_filename == logging.__file__:frame = frame.f_backdepth += 1logger.opt(depth=depth, exception=record.exc_info).log(level, record.getMessage())# This line intercepts all logs from the standard logging modulelogging.basicConfig(handlers=[InterceptHandler()], level=0, force=True)logging.info("Standard library logging intercepted. All logs will now be handled by Loguru.")
With this handler in place, logs from the logging module will be captured by
Loguru and formatted just like your application's own logs:
12345{"time": "2025-09-03T11:27:43.693500+02:00","level": "INFO","message": "Standard library logging intercepted. All logs will now be handled by Loguru."}
For a comprehensive guide on switching from the standard logging module, see
the
Loguru migration documentation.
Bringing your Python logs into an observability pipeline
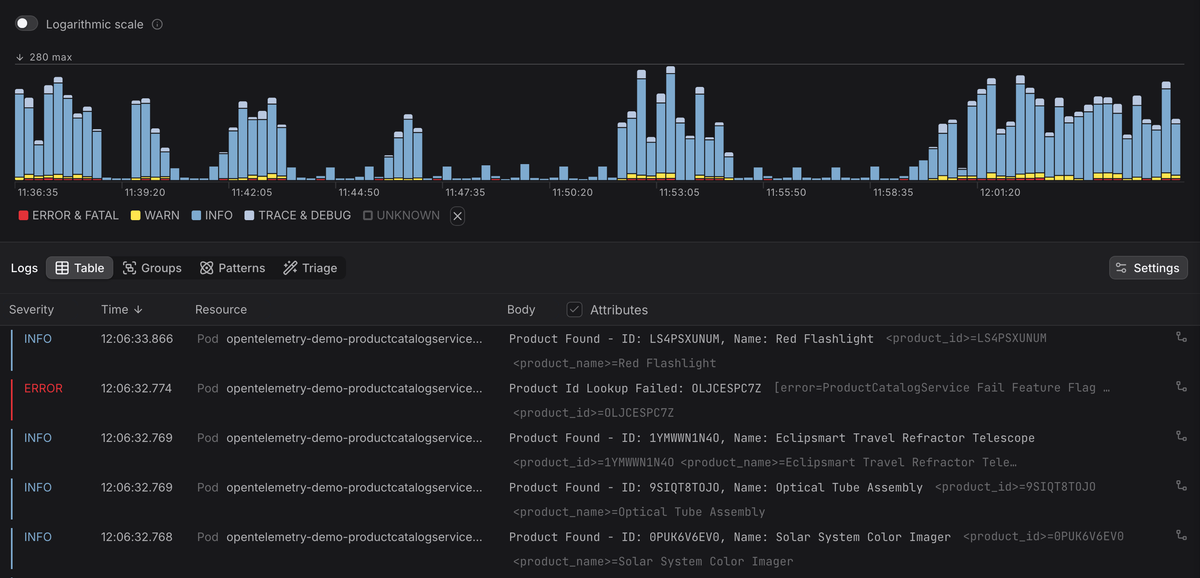
Once your Python services are emitting well structured and context-rich logs with Loguru, the next step is to move them beyond local storage, and into a centralized observability pipeline.
Centralizing your logs lets you search across services, build dashboards, and trigger alerts. Even more importantly, they can be correlated with other signals like metrics and traces to give you a complete picture of your system's health and behavior.
Modern observability platforms like Dash0 can ingest the JSON output you configure with Loguru's custom serializer. Once ingested, those logs can be filtered, aggregated, and visualized just like any other telemetry stream.
What about OpenTelemetry?
This is where we must address a significant trade-off with Loguru. Unlike the
standard logging module, Loguru does not have an official, first-party
integration with OpenTelemetry. This means that trace context (if available) is not propagated
into your logs automatically.
However, you can build this bridge manually. The correct approach is to access the active trace context from OpenTelemetry within your application and inject it into the Loguru logger. This gives you the correlation you need for true observability.
Here is a practical example using a FastAPI middleware. This middleware will
automatically grab the current trace_id and span_id and add them to the
logging context for the duration of the request.
First, ensure you have the necessary OpenTelemetry packages:
1pip install opentelemetry-api opentelemetry-sdk
Then update your application code as follows:
123456789101112131415161718192021222324252627282930313233343536373839404142434445464748495051525354555657585960616263646566676869707172737475767778798081import sysimport jsonimport tracebackfrom loguru import loggerfrom fastapi import FastAPI, Requestfrom opentelemetry import tracefrom opentelemetry.sdk.trace import TracerProviderfrom opentelemetry.sdk.trace.export import ConsoleSpanExporter, SimpleSpanProcessortrace.set_tracer_provider(TracerProvider())tracer = trace.get_tracer(__name__)trace.get_tracer_provider().add_span_processor(SimpleSpanProcessor(ConsoleSpanExporter()))logger.remove()def serialize(record):subset = {"time": record["time"].isoformat(),"level": record["level"].name,"message": record["message"],}# Merge extra fields directly into the top-level dictif record["extra"]:subset.update(record["extra"])if record["exception"]:exc = record["exception"]subset["exception"] = {"type": exc.type.__name__,"value": str(exc.value),"traceback": traceback.format_exception(exc.type, exc.value, exc.traceback),}return json.dumps(subset)def patching(record):record["serialized"] = serialize(record)logger = logger.patch(patching)def custom_formatter(record):return "{serialized}\n"logger.add(sys.stdout, level="INFO", format=custom_formatter)app = FastAPI()@app.middleware("http")async def otel_logging_middleware(request: Request, call_next):# Start a new span for the incoming requestwith tracer.start_as_current_span("http_request") as span:# Get the current trace and span IDsspan_context = span.get_span_context()trace_id = f'{span_context.trace_id:032x}'span_id = f'{span_context.span_id:016x}'# Add IDs to the logging context for the duration of the requestwith logger.contextualize(trace_id=trace_id, span_id=span_id):logger.info("Request started")response = await call_next(request)logger.info("Request finished")return response@app.get("/users/{user_id}")async def get_user(user_id: str):logger.info("Fetching user profile for {user_id}", user_id=user_id)return {"user_id": user_id, "message": "Hello from Kigali!"}if __name__ == "__main__":import uvicornuvicorn.run(app,host="0.0.0.0",port=8000,reload=False,access_log=False,)
Now, when you run this application and make a request to /users/123, every log
message generated during that request will automatically be enriched with the
trace_id and span_id:
123{"time": "2025-09-03T14:05:25.853738+02:00", "level": "INFO", "message": "Request started", "trace_id": "14a89eba2e2232303a467ff70d8dc584", "span_id": "53550a871addc2b5"}{"time": "2025-09-03T14:05:25.854829+02:00", "level": "INFO", "message": "Fetching user profile for 12", "trace_id": "14a89eba2e2232303a467ff70d8dc584", "span_id": "53550a871addc2b5", "user_id": "12"}{"time": "2025-09-03T14:05:25.855016+02:00", "level": "INFO", "message": "Request finished", "trace_id": "14a89eba2e2232303a467ff70d8dc584", "span_id": "53550a871addc2b5"}
While this manual setup requires more boilerplate than using a library with native OTel support, it is a robust pattern that makes your Loguru logs truly production-grade and fully integrated into a modern observability stack.
Final thoughts
Logging is often treated as an afterthought, but in production it is one of the most important windows into what your services are really doing.
Python's standard library logging module is flexible but requires layers of handlers, formatters, and filters before it produces something useful.
By collapsing that complexity into a single logger object with the powerful add() method, Loguru makes modern logging practices more accessible with just a few lines of code.
Of course, Loguru isn’t a silver bullet. It currently lacks first-class OpenTelemetry support, and you may still need to bridge with the standard logging module to capture logs from third-party libraries. Even so, its simplicity and flexibility make it an excellent choice for modern Python applications.
Thanks for reading!
