Last updated: February 19, 2026
Fixing Noisy Logs with OpenTelemetry Log Deduplication
If you've ever experienced a service failure in production, you already know the sound of a log storm. One thing fails, and suddenly your observability pipeline is flooded with thousands of identical error messages.
This surge doesn't just inflate your storage costs; it also buries the critical details you need to actually fix the problem under a mountain of noise.
The OpenTelemetry Log Deduplication Processor is designed to deal with this exact failure mode. Instead of shipping every duplicate entry, it groups identical logs over a configurable time window and emits a single record that captures both the error and how often it occurred.
The result is logs that preserve the full context of the incident without blowing up your observability costs.
Quick start: seeing log deduplication in action
The fastest way to understand the log deduplication processor is to generate a small log storm and watch the Collector collapse it into a single record.
This example uses telemetrygen to simulate a noisy service emitting the same error repeatedly.
Start with a minimal logs pipeline that receives logs over
OTLP and prints the
result to stdout using the
debug exporter:
123456789101112131415161718# otelcol.yamlreceivers:otlp:protocols:grpc:endpoint: 0.0.0.0:4317ports:- 4317:4317exporters:debug:verbosity: detailedservice:pipelines:logs:receivers: [otlp]exporters: [debug]
Next, create a simple Docker Compose file to run the Collector:
12345678# docker-compose.ymlservices:otelcol:image: otel/opentelemetry-collector-contrib:0.144.0volumes:- ./otelcol.yaml:/etc/otelcol-contrib/config.yamlports:- 4317:4317
Start the Collector in the background with:
1docker compose up -d
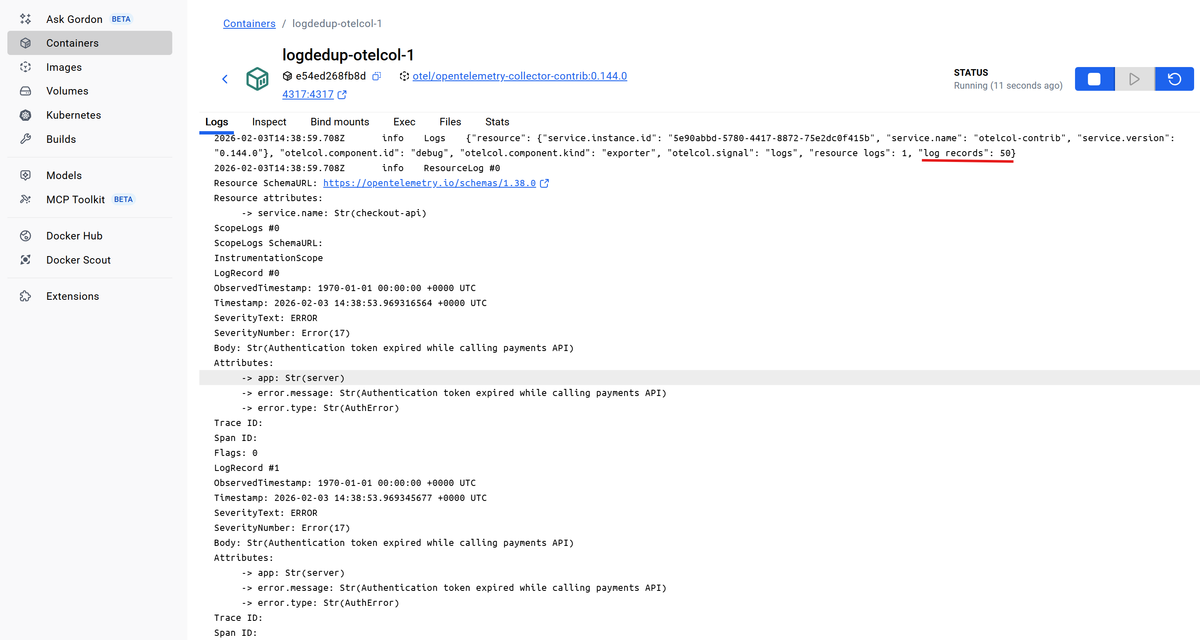
Now send a burst of 50 identical error logs with telemetrygen:
12345678910telemetrygen logs \--otlp-insecure \--logs 50 \--rate 10 \--severity-text ERROR \--severity-number 17 \--body "Authentication token expired while calling payments API" \--otlp-attributes 'service.name="checkout-api"' \--telemetry-attributes 'error.message="Authentication token expired while calling payments API"' \--telemetry-attributes 'error.type="AuthError"'
In the Collector output, you should see that all 50 logs were received and printed by the debug exporter:
Now add logdedup to the pipeline and run the exact same test again. Update
your otelcol.yaml file first to include the processor:
1234567891011121314151617181920# otelcol.yamlreceivers:otlp:protocols:grpc:endpoint: 0.0.0.0:4317processors:logdedup:exporters:debug:verbosity: detailedservice:pipelines:logs:receivers: [otlp]processors: [logdedup] # also add thisexporters: [debug]
Then restart the Collector so it picks up the new configuration:
1docker compose up -d --force-recreate
After rerunning the telemetrygen command, the output changes. Instead of
printing every log, the Collector emits a single aggregated record for the
interval:
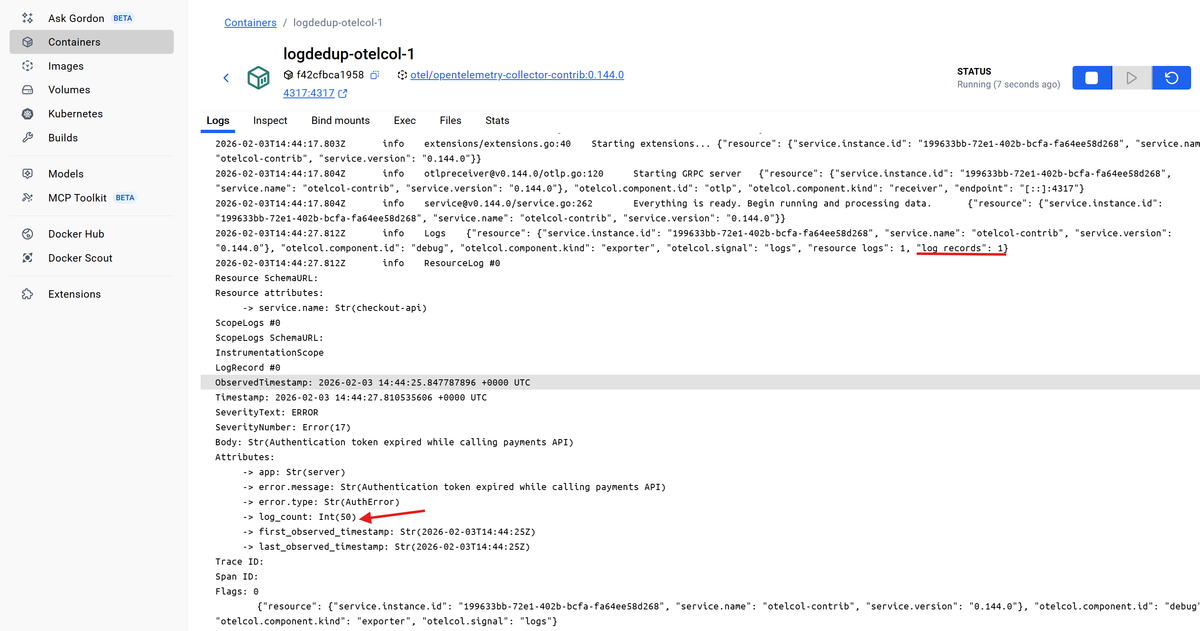
12345678910111213141516LogRecord #0ObservedTimestamp: 2026-02-03 14:44:25.847787896 +0000 UTCTimestamp: 2026-02-03 14:44:27.810535606 +0000 UTCSeverityText: ERRORSeverityNumber: Error(17)Body: Str(Authentication token expired while calling payments API)Attributes:-> app: Str(server)-> error.message: Str(Authentication token expired while calling payments API)-> error.type: Str(AuthError)-> log_count: Int(50)-> first_observed_timestamp: Str(2026-02-03T14:44:25Z)-> last_observed_timestamp: Str(2026-02-03T14:44:25Z)Trace ID:Span ID:Flags: 0
This single LogRecord summarizes the entire burst. The original error details
are preserved, while log_count shows how many times it occurred and the
first_observed_timestamp and last_observed_timestamp entries show when the
burst started and ended respectively.
Without deduplication, your backend sees 50 copies of the same failure. With
logdedup, you keep the signal and the frequency, but drop the noise.
How log deduplication actually works
When a log record enters the pipeline, the logdedup processor has to decide
whether it belongs to an existing group or starts a new one. That decision is
fully deterministic and predictable once you understand the rules.
Here's the processor’s default configuration:
| Field | Default | Description |
|---|---|---|
interval | 10s | Time window for aggregation |
conditions | [] | OTTL expressions that gate deduplication |
log_count_attribute | log_count | Attribute added with deduplicated count |
include_fields | [] | Fields used to define identity |
exclude_fields | [] | Fields ignored during comparison |
timezone | UTC | Timezone for generated timestamps |
By default, all logs are eligible for deduplication. If you don't configure
any conditions, every log that passes through the processor is considered
eligible.
For eligible logs, the processor checks whether the log is identical to one it has already seen within the current time window. Two logs are considered identical only if all of the following match exactly:
- The log body
- The severity
- All log attributes
- All resource attributes
This matching is intentionally strict. If even one attribute differs, such as a pod name, instance ID, or request ID, the logs are treated as different and will not be grouped together.
Matching logs are buffered for the duration of the aggregation interval, which
defaults to ten seconds. During that window, the processor counts occurrences
instead of forwarding every copy.
When the interval expires, the processor emits a single log record per group. That record contains the original log data plus metadata describing how many times the log occurred and when the burst started and ended as you saw earlier.
In short, the default behavior ensures that only logs that are truly identical in every observable way are grouped and deduplicated.
Customizing what counts as a duplicate log
If you leave the defaults untouched, many logs that engineers would consider
duplicates will never be collapsed. So customizing logdedup is about answering
one question clearly: what does a duplicate log mean in your system?.
A common and safe definition looks like this:
- Severity is the same, such as
ERROR - The error itself is the same
- The log comes from the same service
In other words, if the same error keeps appearing in the same service within a short time window, treat it as noise and collapse it into a single record.
Let's look at the available tuning options below.
Narrowing eligibility with conditions
The conditions field helps you control which logs are considered for
deduplication in the first place. It uses
OpenTelemetry Transform Language (OTTL) expressions
to keep the logdedup processor from touching unrelated logs.
For example, you can restrict deduplication to error-level logs alone:
12345processors:logdedup:conditions:# Only consider error logs and above for deduplication- severity_number >= SEVERITY_NUMBER_ERROR
This does not mark duplicate logs; it only defines which logs are allowed to be grouped and evaluated.
In practice, you may need to combine several conditions to scope deduplication to known noisy patterns:
123456processors:logdedup:conditions:# Only consider errors from `payment-processor` service where the body# contains 'Connection refused'- severity_number >= SEVERITY_NUMBER_ERROR and resource.attributes["service.name"] == "payment-processor" and IsMatch(body, "Connection refused")
You can also combine unrelated conditions using logical OR by listing multiple
conditions. A log is eligible if any expression evaluates to true:
1234567processors:logdedup:conditions:# Only deduplicate logs if at least one condition is true- IsMatch(body, "token expired")- IsMatch(body, "authentication failed")- IsMatch(body, "connection refused")
Any log record that does not meet the specified conditions is passed to the
next component in the pipeline unchanged.
Defining identity with include_fields
Next, you'll want to define what makes two eligible logs identical and suited for deduplication. By default, the body, severity, log attributes, and resource attributes must match exactly for a log to be considered duplicate.
In real systems, that is usually too strict, because logs often carry other contextual fields that vary per request or instance. The log is the same, but one changing attribute is enough to split the stream and prevent deduplication.
Using include_fields lets you tighten the matching logic around the parts that
actually define a duplicate log, instead of everything the system happens to
attach.
For example, if your error logs populate error.message and error.type, you
can deduplicate based on those fields for a specific service:
1234567processors:logdedup:conditions:- severity_number >= SEVERITY_NUMBER_ERROR and resource.attributes["service.name"] == "checkout-api"include_fields:- attributes.error\.message- attributes.error\.type
With this configuration:
- Only errors from the
checkout-apiservice qualify. - Logs are grouped by error message and error type.
- Differences in the body and other log attributes are ignored.
To see the impact of include_fields, generate logs where only a single
attribute varies per event. A unique request ID is a realistic example.
1234567891011121314151617# telemetrygen.sh#!/bin/bashfor i in $(seq 1 10); dorid="$(uuidgen 2>/dev/null || cat /proc/sys/kernel/random/uuid)"telemetrygen logs \--otlp-endpoint localhost:4317 \--otlp-insecure \--logs 1 \--severity-text ERROR \--severity-number 17 \--body "Authentication token expired while calling payments API" \--otlp-attributes 'service.name="checkout-api"' \--telemetry-attributes 'error.message="Authentication token expired while calling payments API"' \--telemetry-attributes 'error.type="AuthError"' \--telemetry-attributes "request_id=\"${rid}\""done
Each telemetrygen exection will generate one log, for a total of 10 error
logs. They differ only by the dynamic request_id attribute, which is exactly
the kind of field that normally blocks deduplication.
Execute the script with:
1./telemetrygen.sh
With the default identity rules, you will see 10 separate records. But with
include_fields set to error.message and error.type, the processor
collapses the burst into a single aggregate with log_count: 10:
1234567891011121314151617LogRecord #0ObservedTimestamp: 2026-02-03 13:01:50.848825323 +0000 UTCTimestamp: 2026-02-03 13:01:54.36105457 +0000 UTCSeverityText: ERRORSeverityNumber: Error(17)Body: Str(Authentication token expired while calling payments API)Attributes:-> app: Str(server)-> error.message: Str(Authentication token expired while calling payments API)-> error.type: Str(AuthError)-> request_id: Str(0f467078-0229-4052-965c-6ac4afe7c06b)-> log_count: Int(10)-> first_observed_timestamp: Str(2026-02-03T13:01:50Z)-> last_observed_timestamp: Str(2026-02-03T13:01:52Z)Trace ID:Span ID:Flags: 0
When to exclude fields instead
In some cases, it's simpler to keep the default matching behavior and explicitly ignore a small number of fields that should not affect deduplication.
You can tell logdedup to ignore those fields using exclude_fields:
123456processors:logdedup:conditions:- severity_number >= SEVERITY_NUMBER_ERROR and resource.attributes["service.name"] == "checkout-api"exclude_fields:- attributes.request_id
With this configuration, everything about the log still has to match except for
the excluded fields. If request_id was the only difference between eligible
events, they will now be grouped and deduplicated.
Choosing the right approach
Note that include_fields and exclude_fields are mutually exclusive in the
same logdedup instance. Both options solve the same problem, but from
different angles:
-
Use
include_fieldswhen you want to define, very explicitly, what a duplicate log means. -
Use
exclude_fieldswhen you want to treat all eligible logs as identical except for a few known fields. -
Always use
conditionsto limit deduplication to logs that are safe to group in the first place.
Notes on resource attributes and matching behavior
Two details are worth calling out before you include logdedup in your
production pipelines:
1. Resource attributes still matter
Even when you use include_fields or exclude_fields, logs are still grouped
by their specified
Resource. If
instance-level resource attributes differ, such as service.instance.id or
k8s.pod.name, deduplication happens per resource.
The screenshot below shows a burst of 50 identical error logs that differ only
by service.instance.id (instance-a and instance-b). Instead of collapsing
into a single record with log_count: 50, they are collapsed into one record
per instance, each with log_count: 25:
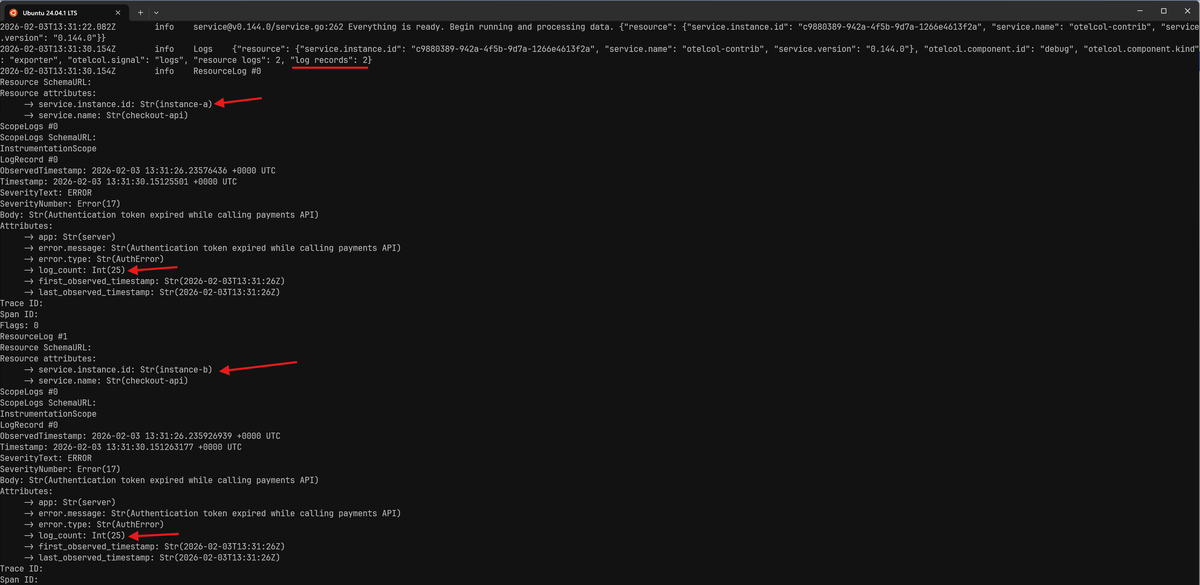
This behavior is intentional and generally desirable. You get the benefits of deduplicating noisy repeats without misleading yourself into thinking an error only occurred in a single instance when it did not.
2. You cannot match on the full body directly
Both include_fields and exclude_fields operate on fields, not on the raw log
record as a whole. They can reference attributes, or fields inside a
structured body, but they cannot target an unstructured string body directly.
That means this configuration is invalid when the body is a plain string:
123456processors:logdedup:conditions:- severity_number >= SEVERITY_NUMBER_ERRORinclude_fields:- body
1Error: invalid configuration: processors::logdedup: cannot include the entire body
In practice, this is usually a non-issue since most deduplication strategies rely on stable attributes that describe the log.
If you do want to deduplicate based on a string body, you need to copy it into an attribute first and match on that attribute instead:
1234567891011121314151617processors:transform/copy_body:log_statements:- context: logstatements:- set(attributes["dedup.body"], body)logdedup:conditions:- severity_number >= SEVERITY_NUMBER_ERRORinclude_fields:- attributes.dedup\.bodyservice:pipelines:logs:processors: [transform/copy_body, logdedup]
This makes the body available as a stable field that logdedup can now safely
use for identity matching.
Adjusting the deduplication interval
The interval setting controls how long logdedup waits before emitting an
aggregated log. It's the main lever you have to balance delivery timeliness
against noise reduction.
A shorter interval means logs are forwarded more quickly, but with less aggregation. A longer interval increases the chance that repeated logs are collapsed, but delays when you see the summarized result.
123processors:logdedup:interval: 10s # the default
Reducing noisy telemetry at every stage
There's no single correct place to handle noisy telemetry. The most efficient observability pipelines treat noise reduction as a multi-stage responsibility, filtering and refining data at every hop from generation to storage.
The most cost-effective way to handle noise is to prevent it from being created in the first place. If your logging framework supports sampling or deduplication, that's always the cheapest and cleanest option. Telemetry that's never emitted saves CPU cycles, network bandwidth, and processing overhead downstream.
Once logs are in flight, the Collector is the right place to collapse repetition as you've seen here. The filter and sampling processors play a similar role by removing low-value telemetry or reducing volume while maintaining statistical significance.

Dash0 is also built around the idea that not all telemetry is worth storing or paying for. By applying spam filters and dropping low-value data at ingestion time, you'll extend your noise-reduction strategy into the backend itself. This ensures your budget is spent on actionable insights rather than storing redundant text.
Final thoughts
The goal of any observability pipeline is not just to move data from point A to B; it's to refine that data so that it's useful when it arrives.
The Log DeDuplication processor is one of the most powerful tactical tools you have for this purpose. By converting thousands of log lines into a single record with a count, you preserve the evidence of an incident without letting the noise paralyze your team or your budget.
When noise is reduced deliberately and context is preserved end to end, telemetry becomes an asset that enables observability instead of a liability that hinders it.
To see what a modern, OpenTelemetry-native observability experience looks like, try Dash0 today and connect it to your existing Collector setup.
