Last updated: September 17, 2025
Mastering the OpenTelemetry Filter Processor
In observability, more data doesn't always mean better insight. Collecting everything can drive up costs, bury important signals in noise, and slow down your ability to spot what actually matters.
That's where the OpenTelemetry Collector's filter processor comes in. You can think of it as the bouncer of your data pipeline, that gives you fine-grained control over which telemetry gets through and which doesn't.
At the heart of the filter processor is the OpenTelemetry Transformation Language (OTTL). Unlike simple attribute-based filters, OTTL lets you write conditional logic to selectively drop traces, metrics, and logs with precision. The payoff is cleaner, more efficient pipelines that cut out the noise without losing the context you need.
In this guide, we'll walk through how to use the filter processor to make your observability pipelines leaner, cheaper, and more effective.
Let's dive in.
When to use the filter processor
The filter processor is the right tool whenever you need to permanently remove telemetry data before it moves deeper into your pipeline. It isn't just a cost-cutting tool, it's a way to shape your observability strategy so that you only keep the data that matters most.
By applying rules at the collection layer, you prevent irrelevant or risky signals from ever reaching your backend, which means lower bills, faster queries, and dashboards that surface real insights instead of noise.
Here are some of the most impactful ways to use it:
-
Reducing observability costs: One of the top reasons to use the filter processor is to drop high-volume, low-signal data that bloats ingest and storage bills. Think health checks that fire every few seconds, polling endpoints, or chatty debug logs.
-
Dialing down the noise: Dashboards are only as useful as the signals they highlight. By filtering out routine 200 OK calls or ultra-fast requests, you can zero in on the failures and slow responses that actually matter for troubleshooting.
-
Protecting sensitive data: Accidentally sending PII, credentials, or other confidential details downstream is a compliance nightmare. With the filter processor, you can detect and drop those records before they ever leave the pipeline.
-
Keeping environments clean: Production signals often get drowned out by telemetry from dev, test, or staging systems. Dropping that non-prod data early ensures your main observability backend only reflects what's happening in production.
-
Controlling Metric Cardinality: In some cases, certain attribute values can cause a "cardinality explosion", creating thousands of unique time series and driving up costs. The filter processor can drop metric data points that match specific high-cardinality attributes.
Filter processor vs other processors
Knowing when to use the filter processor (and when not to) can save you headaches. It overlaps a bit with other processors, but the key differences come down to flexibility and intent.
Filter vs redaction processor
The redaction processor is designed to remove or mask sensitive fields within telemetry records while keeping the rest of the data intact. This makes it a great choice when you want to preserve the signal but strip out values like PII, credentials, or tokens.
The filter processor, on the other hand, takes a stricter approach. If a condition matches, the entire span, log, or metric is dropped. Use it when the whole record is unnecessary or unsafe to keep.
Filter vs tailsampling processor
The tailsampling processor is used for probabilistic or policy-based sampling (e.g., "keep 10% of all traces" or "keep all traces with errors"). The filter processor, by contrast, is fully deterministic; a piece of telemetry either matches a condition and is dropped, or it doesn't.
Quick start: dropping health checks
One of the most common filtering tasks is removing health check spans. They're critical for monitoring service uptime, but they rarely tell you much about performance—and they often make up a surprising chunk of trace volume.
Here's how you can strip them out with the filter processor. Just add it to
your config and reference it in your traces pipeline:
1234567891011121314processors:filter:traces:span:- attributes["url.path"] == "/healthz"- attributes["url.path"] == "/readyz"- IsMatch(name, ".*health.*")service:pipelines:traces:receivers: [otlp]processors: [filter] # Add filter to your pipelineexporters: [debug]
In this example, any incoming span will be checked against the three conditions.
If its http.target attribute is exactly /healthz or /readyz, or if its
name matches the regex .*health.*, it will be dropped immediately. All other
spans will pass through to the exporter.
Understanding the OTTL configuration
The filter processor's power comes from OTTL, which allows you to write flexible expressions that apply at different layers of your telemetry.
The configuration is structured by signal type (traces, metrics, logs) and
by context, allowing you to define filtering logic at different
granularities.
| Config Section | OTTL Context | Scope |
|---|---|---|
traces.span | span | The entire span. Dropping this drops its events too. |
traces.spanevent | spanevent | A single event within a span. |
metrics.metric | metric | A whole metric stream. Dropping this drops its datapoints. |
metrics.datapoint | datapoint | A single data point within a metric. |
logs.log_record | log_record | An individual log record. |
Within each context, you'll need to provide a list of OTTL boolean expressions.
The rules are evaluated with OR logic so that if any condition is true, the
item is dropped. This makes it easy to layer on multiple rules without having to
build a single giant expression.
1234567processors:filter:logs:log_record:# Drop any log with severity DEBUG or lower, or whose body text contains "debug" or "trace"- attributes["severity_number"] <= SEVERITY_NUMBER_DEBUG4- 'IsMatch(body, "(?i)(debug|trace)")'
Error handling
Like any expression language, OTTL isn't immune to runtime errors. For example,
if you try to access a map key that doesn't exist without checking for nil,
the statement can fail. How the filter processor responds is controlled by the
error_mode setting:
-
propagate(default): The error bubbles up and usually causes the entire batch of data to be dropped. That's almost never what you want in production. -
ignore: The error gets logged, but the condition simply evaluates tofalseso that the data isn't dropped. This strikes the right balance for most real-world setups. -
silent: The error is swallowed completely and nothing is logged. This is useful if you expect certain expressions to fail and don't want your logs flooded.
As a best practice, you should always set error_mode explicitly. In most
cases, ignore is the safest and most predictable option:
1234processors:filter:error_mode: ignore# ... your filter rules go here
Practical recipes for common filtering tasks
Let's explore some real-world scenarios to see how you can leverage OTTL for powerful filtering.
1. Drop fast, successful spans
To focus on problematic requests alone, you can drop all spans that represent
fast, successful HTTP requests. This requires combining multiple conditions with
and:
1234567processors:filter:error_mode: ignoretraces:span:# Drop spans that have a 2xx status code AND took less than 500ms- status.code == STATUS_CODE_OK and (end_time - start_time) < Duration("500ms")
2. Drop noisy debug logs from production
Verbose DEBUG logs
are useful in development, but they're usually just noise in production—and they
can drive up costs fast.
With the filter processor, you can target them precisely by combining a resource attribute (to scope the rule to production) with the log's severity level:
1234567processors:filter:error_mode: ignorelogs:log_record:# Drop if the environment is 'production' AND severity is DEBUG or lower- resource.attributes["deployment.environment.name"] == "production" and severity_number <= SEVERITY_NUMBER_DEBUG4
3. Dropping logs with sensitive information
Sometimes logs capture more than they should: PII, credentials, or tokens that you don't want leaving your system. To handle this, you can use IsMatch() with a regular expression to detect and drop any log records that match sensitive patterns:
1234567processors:filter:error_mode: ignorelogs:log_record:# Regex to find patterns like "email=..." or "password=..."- 'IsMatch(body, "(?i)\\b(email|password|ssn|auth_token)\\b\\s*[:=]\\s*\\S+")'
In this example, any log body that contains one of the listed keywords followed by a value is dropped immediately.
If your goal is not to drop the entire log but only to remove or mask the sensitive value, you should instead reach for the redaction processor or the transform processor.
These let you surgically replace, mask, or delete fields while keeping the rest of the record intact.
3. Drop high-cardinality metric data points
High-cardinality metric attributes can wreak havoc on your observability costs and query performance. A common culprit is metrics that accidentally include user IDs, session IDs, or other unique identifiers.
Take http.server.request.duration as an example. If the http.route attribute
contains user IDs, each unique ID creates a new time series which leads to a
cardinality explosion. You can use the filter processor to drop only those
problematic data points while keeping the rest:
123456processors:filter:error_mode: ignoremetrics:datapoint:- metric.name == "http.server.request.duration" and IsMatch(attributes["http.route"], "^/users/\d+/.*")
This way, you still retain valuable http.server.request.duration metrics, but
without the runaway cardinality caused by embedding unique IDs in attribute
values.
4. Drop a metric based on an attribute on any of its data points
Sometimes you want to eliminate an entire metric stream if any of its data points carry a certain attribute. A common use case is filtering out synthetic or test data before it clutters your backend.
The filter processor supports custom OTTL functions for this, including the
HasAttrOnDatapoint,
which makes it easy to evaluate all data points in a metric:
1234567processors:filter:error_mode: ignoremetrics:metric:# Drop the entire metric if any data point has the attribute `testing.user` set to `true`- HasAttrOnDatapoint("testing.user", "true")
Verifying filters with chained pipelines
How can you be sure your filter is working correctly without accidentally dropping the wrong data? The safest way is to compare what your pipeline looks like before and after the filter runs. You can do this by chaining two pipelines together and using the debug` exporter at both stages.
The setup works like this:
-
A "raw" pipeline logs incoming data as-is, with no processors applied.
-
That same data is forwarded into a "processed" pipeline, where your filter is applied and logged again.
Here's an example configuration:
1234567891011121314151617181920212223242526272829303132333435363738394041receivers:otlp: # Receives from your appsprotocols:grpc:endpoint: 0.0.0.0:4317otlp/internal: # Receives from the 'raw' pipelineprotocols:grpc:endpoint: 0.0.0.0:4316 # Internal communication portprocessors:filter/drop_debug_logs:error_mode: ignorelogs:log_record:- severity_number <= SEVERITY_NUMBER_DEBUGexporters:debug/raw:verbosity: normal # Show data before filteringdebug/processed:verbosity: normal # Show data after filteringotlp/internal: # Forwards data from 'raw' to 'processed'endpoint: 127.0.0.1:4316tls:insecure: trueservice:pipelines:logs/raw:receivers: [otlp]processors: [] # No processors hereexporters: [debug/raw, otlp/internal] # Log raw data and forward itlogs/processed:receivers: [otlp/internal] # Receive from the raw pipelineprocessors: [filter/drop_debug_logs] # Apply the filterexporters: [debug/processed] # Log the final result
When you run this, your Collector logs will show two entries for each batch.
Output from debug/raw (before filtering):
12345... "otelcol.component.id": "debug/raw" ......Log 0: Info phase: processing ...Log 1: Debug phase: start ...Log 2: Info phase: completed ...
Here you can see that both the Info and Debug logs coming through as
expected.
Output from debug/processed (after filtering):
1234... "otelcol.component.id": "debug/processed" ......Log 0: Info phase: processing ...Log 2: Info phase: completed ...
The Debug log is now gone, confirming the filter worked exactly as intended.
If you need an easier way to distinguish between the "raw" and "processed" pipelines, see our article on the debug exporter.
Filter processor tips and best practices
-
Don't rely on filtering as a crutch: The best practice is to avoid generating unnecessary telemetry in the first place. If you can tune your application, SDK, or instrumentation library to skip emitting low-value signals, that's almost always more efficient than filtering them out downstream.
-
Set
error_mode: ignoreby default: Unless you have a very specific reason to stop processing on errors, this is the most reliable setting. It keeps your pipeline resilient without silently swallowing problems. -
Know the hierarchy: Dropping a parent (like a span or a metric) automatically drops its children (events or data points). You don't need to filter at both levels.
-
Avoid orphaned telemetry: If you drop a parent span, its children might show up without context and break trace integrity. The same goes for logs or metrics tied to a dropped span. Think carefully about what you remove and what that leaves behind.
-
Write precise rules: Broad conditions can lead to surprises. Combining multiple attributes with and makes filters safer and easier to reason about than a single, catch-all statement.
-
Watch performance with regex: OTTL runs fast, but heavy regex patterns—especially on high-volume fields like log bodies—can burn CPU. Test your filters under load before rolling them out widely.
Final thoughts
The OpenTelemetry Collector's filter processor is a powerful way to keep your pipelines efficient, your costs under control, and your telemetry focused on what matters most.
By dropping unnecessary data at the edge, you'll improve signal quality and avoid drowning in noise. And with OTTL, you have many expressive rules to shape your data flow with confidence.
But you don't always need to manage that complexity by hand. Dash0 was built on the belief that observability tools should be OpenTelemetry-native and make it easy for teams to balance cost with visibility.
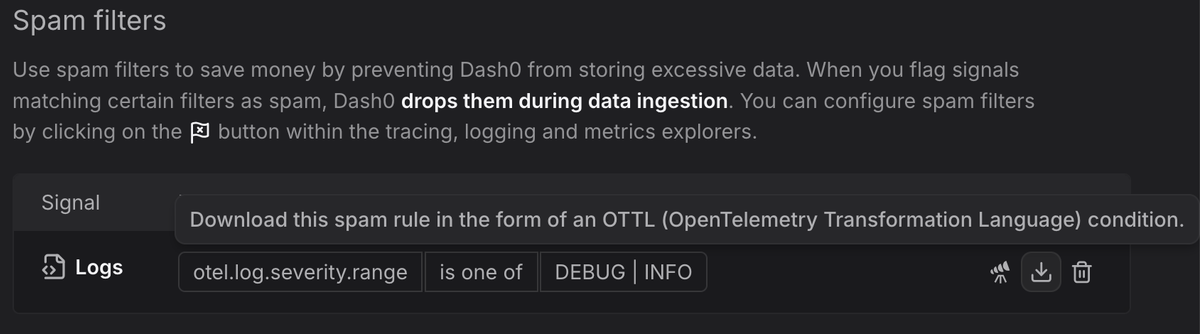
Features like Spam Filters bring the same filtering capabilities you'd configure by hand—only with a point-and-click interface that lets you flag unwanted spans, logs, or metrics in just a couple of clicks.
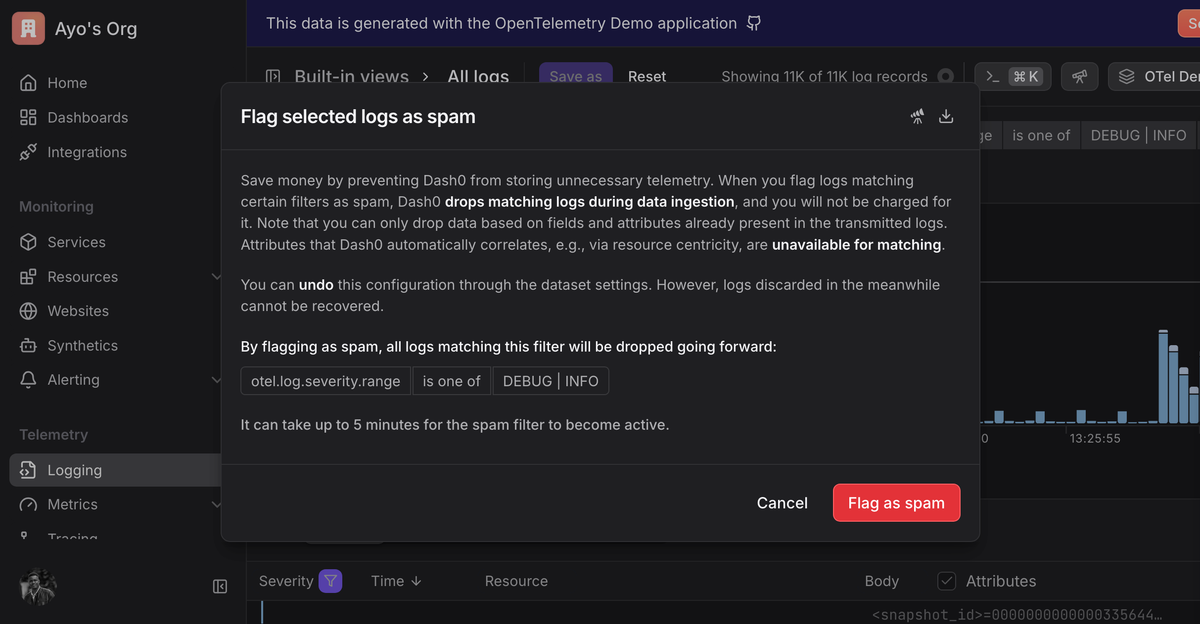
Behind the scenes, Dash0 still plays by OpenTelemetry's rules, so you can always see and replicate the equivalent Collector configuration if you need to.
If you want the precision of OpenTelemetry with the simplicity of a clean, intuitive workflow, Dash0 gives you both, helping you stay in control of your observability strategy without end of the month surprises. Give it a try by starting your free trial today.
