Last updated: November 24, 2025
Configuring PostgreSQL Logs: A Practical Guide
PostgreSQL logs play three core roles within any operational setup:
- Debugging and troubleshooting: Exposing slow queries, deadlocks, and connection issues.
- Performance optimization: Revealing bottlenecks, lock contention, or inefficient query patterns.
- Auditing and compliance: Recording who accessed what, when, and from where for accountability and security reviews.
In modern distributed systems, these logs also make it possible to connect telemetry data across layers such as linking a trace from an API call to the exact SQL query it triggered and to the infrastructure event that caused latency to spike.
The challenge is that most production environments still get logging wrong. Some log everything, generating so much data that it becomes useless. Others log almost nothing, leaving critical gaps when performance degrades or an outage occurs.
This guide focuses on finding the right balance: configuring PostgreSQL to capture meaningful events, keeping logs lean and efficient, and laying the groundwork for seamless integration with modern observability frameworks such as OpenTelemetry.
Finding the PostgreSQL logs location
Let's start by understanding where PostgreSQL actually writes its logs, how that behavior changes based on configuration and environment, and how to confirm the active log location on your system.
PostgreSQL uses a background process known as the logging collector, which
is responsible for capturing log messages sent to stderr and redirecting them
into rotating log files on disk.
This process centralizes logging within PostgreSQL itself, ensuring that log entries are safely stored and consistently formatted regardless of the system's service manager or runtime environment.
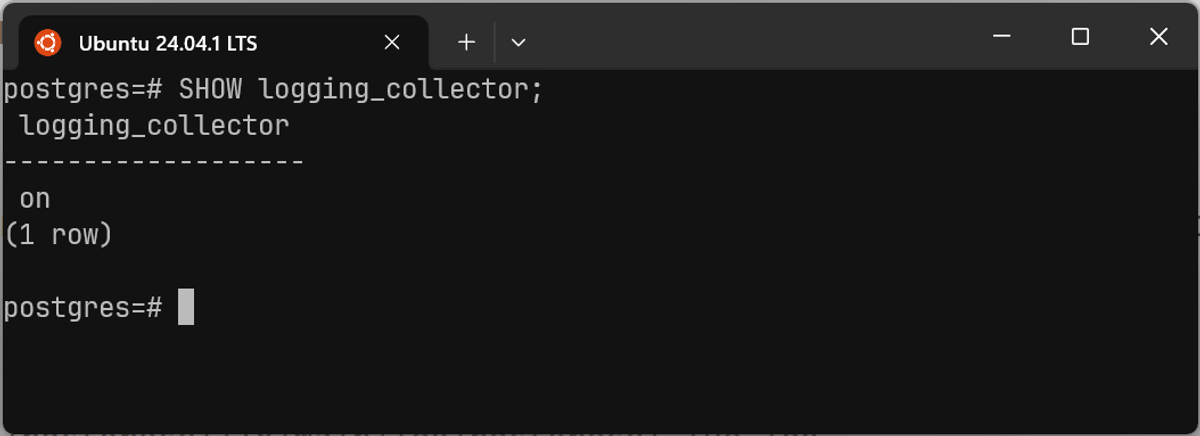
You can check whether the collector is active by executing the following through
psql:
1SHOW logging_collector;
It's typically disabled by default:
1234logging_collector-------------------off(1 row)
When logging_collector is off, PostgreSQL does not write log files directly.
Instead, all output sent to stderr is handled by the operating system or
service manager. Depending on your setup, this may mean:
- Logs are
captured by Systemd
and viewable with
journalctl. - In Docker environments, they are automatically captured and accessible through
docker logs.
On Ubuntu/Debian, the PostgreSQL service is configured to redirect stderr to a
dedicated file rather than passing it through to the system journal.
As a result, running journalctl -u postgresql typically shows no log output,
even though logging is functioning correctly.
You can verify the active log file location using:
1pg_lsclusters # Ubuntu/Debian
The Log file column then shows where PostgreSQL is currently writing its output:
12Ver Cluster Port Status Owner Data directory Log file18 main 5432 online postgres /var/lib/postgresql/18/main /var/log/postgresql/postgresql-18-main.log
When the logging collector is on
When the logging collector is enabled, PostgreSQL takes direct responsibility for writing and rotating its own log files rather than relying on its operating environment.
You might see the following log messages when the PostgreSQL process starts up:
1234PostgreSQL Database directory appears to contain a database; Skipping initialization2025-10-23 03:26:39.597 GMT [1] LOG: redirecting log output to logging collector process2025-10-23 03:26:39.597 GMT [1] HINT: Future log output will appear in directory "log".
Then you can identify the active log file by executing the following query in
psql:
1SELECT pg_current_logfile();
The value returned is relative to the PostgreSQL data_directory:
1234pg_current_logfile--------------------------------------log/postgresql-2025-10-21_170819.log(1 row)
To determine the full path, check the data directory location:
1SHOW data_directory;
This produces:
1234data_directory-----------------------------/var/lib/postgresql/18/main(1 row)
By combining these values, you can construct the absolute path to the active log file:
1/var/lib/postgresql/18/main/log/postgresql-2025-10-21_170819.log
You can inspect the directory to view all existing log files created by the collector:
1sudo ls -l /var/lib/postgresql/18/main/log/
Typical output includes one log file per rotation interval (for example, per day or per size threshold):
1postgresql-2025-10-21_170819.log postgresql-2025-10-21_172920.log
These filenames and rotation patterns are controlled by parameters such as
log_filename, log_rotation_age, and log_rotation_size:
123log_filename = 'postgresql-%Y-%m-%d_%H%M%S.log'log_rotation_age = 1dlog_rotation_size = 10MB
For more advanced rotation, compression, and archival, it's better to rely on a dedicated tool like logrotate.
Types of PostgreSQL logs
PostgreSQL generates several categories of log messages, each representing a different aspect of server operation and database activity. Understanding these categories helps you identify what is happening within the system and where to focus your analysis when diagnosing performance or reliability issues.
1. Startup and shutdown logs
Startup and shutdown messages record the lifecycle of the PostgreSQL server. They appear each time the instance starts, restarts, or stops, and they provide a clear view of availability events such as restarts, crashes, or planned maintenance.
1234562025-10-12 16:11:39.962 UTC [1] LOG: starting PostgreSQL 18.0 (Debian 18.0-1.pgdg12+3) on x86_64-pc-linux-gnu, compiled by gcc (Debian 12.2.0-14+deb12u1) 12.2.0, 64-bit2025-10-12 16:11:39.962 UTC [1] LOG: listening on IPv4 address "0.0.0.0", port 54322025-10-12 16:11:39.962 UTC [1] LOG: listening on IPv6 address "::", port 54322025-10-12 16:11:39.977 UTC [1] LOG: listening on Unix socket "/var/run/postgresql/.s.PGSQL.5432"2025-10-12 16:11:39.992 UTC [32] LOG: database system was shut down at 2025-10-12 16:11:38 UTC2025-10-12 16:11:40.003 UTC [1] LOG: database system is ready to accept connections
These entries mark key transitions in the database's operational state. By tracking them, you can confirm when the database became available, detect unplanned restarts, and correlate these events with system-level activities such as operating system updates, configuration changes, or service restarts.
2. Query execution logs
Query execution logs capture the SQL statements that are run against the
database. The extent of this logging is determined by the log_statement
parameter, which can be configured to one of four values:
none(default): disables query logging entirely.ddl: logs schema changes such asCREATE,ALTER, andDROPstatements.mod: logs bothddlstatements and data modification commands (INSERT,UPDATE,DELETE).all: logs every SQL statement executed, includingSELECTqueries.
12025-10-12 16:12:15.310 UTC [42] STATEMENT: INSERT INTO artist (artistid, name) VALUES (16, N'Caetano Veloso');
3. Query duration logs
Query duration logs capture how long each SQL statement takes to execute, which helps with diagnosing performance issues, identifying inefficient queries, and verifying that indexes and query plans are performing as expected.
12025-10-12 16:16:39.205 UTC [30] LOG: duration: 45.322 ms statement: SELECT * FROM track WHERE milliseconds > 500000;
4. Error logs
Error logs capture conditions that interrupt query execution or signal an
operational issue. They often include supplementary entries such as DETAIL,
HINT, or STATEMENT for greater diagnostic context:
1232025-10-12 16:12:19.750 UTC [42] ERROR: duplicate key value violates unique constraint "pk_playlisttrack"2025-10-12 16:12:19.750 UTC [42] DETAIL: Key (playlistid, trackid)=(18, 597) already exists.2025-10-12 16:12:19.750 UTC [42] STATEMENT: INSERT INTO playlisttrack (playlistid, trackid) VALUES (18, 597);
5. Connection and disconnection logs
Connection logs record when clients establish or terminate sessions with the database, including details such as the username, database name, host, and session duration.
These logs are valuable for understanding how your services interact with the database over time, and for diagnosing issues like excessive reconnections, short-lived sessions, authentication failures, or connection pool misconfiguration.
123LOG: connection received: host=[local]LOG: connection authorized: user=postgres database=chinook application_name=psqlLOG: disconnection: session time: 0:00:08.602 user=postgres database=chinook host=[local]
They are controlled by the log_connections and log_disconnections settings.
When both are enabled, PostgreSQL will log every client connection and
disconnection event, providing a complete record of session lifecycle activity.
6. Checkpoint and Write-Ahead Logs (WAL)
PostgreSQL periodically emits checkpoint and WAL-related log entries to record when modified pages are flushed from shared memory to disk. These events are central to the database's durability and crash recovery mechanisms.
122025-10-12 16:16:39.205 UTC [30] LOG: checkpoint starting: time2025-10-12 16:17:18.720 UTC [30] LOG: checkpoint complete: wrote 405 buffers (2.5%), wrote 18 SLRU buffers; 0 WAL file(s) added, 0 removed, 1 recycled; write=39.460 s, sync=0.041 s, total=39.516 s; sync files=97, longest=0.003 s, average=0.001 s; distance=9530 kB, estimate=9530 kB; lsn=0/252BA28, redo lsn=0/252B998
Switching PostgreSQL logs to structured JSON
PostgreSQL's log format is controlled by the log_destination parameter whose
default value is stderr.
This means each log entry is emitted as a plain text line that typically includes a timestamp, process ID, and log level, followed by the actual message.
12025-10-12 16:22:10.502 UTC [94] LOG: statement: SELECT * FROM album WHERE artistid = 2;
The format of these lines is controlled by the log_line_prefix parameter in
the PostgreSQL configuration file.
By default, the prefix looks like this:
1log_line_prefix = '%m [%p] '
Here, %m is the timestamp (with milliseconds) and %p is the process ID of
the backend process that generated the log entry. You can find many other escape
codes in the
documentation
The part after the prefix (LOG: statement: ...) is automatically added by
PostgreSQL and includes the log level (LOG, ERROR, WARNING, etc.) followed
by the message text.
Since observability relies on structured logs that can be parsed and correlated automatically across systems, PostgreSQL added native support for structured logging in the version 15 release, allowing logs to be written directly in JSON format for easy ingestion by modern tools:
1log_destination = 'jsonlog'
It requires that logging_collector be turned on as well:
1logging_collector = on
With these two settings, you'll start seeing JSON logs in the previously
examined log directory (with a .json extension):
123456789101112{"timestamp": "2025-10-23 04:27:32.178 GMT","pid": 1,"session_id": "68f9aeb4.1","line_num": 6,"session_start": "2025-10-23 04:27:32 GMT","txid": 0,"error_severity": "LOG","message": "database system is ready to accept connections","backend_type": "postmaster","query_id": 0}
Unlike the stderr format where you can decide what to include in the logs
through the log_line_prefix, using jsonlog includes
all available fields
for the log type, except those with null values.
All subsequent examples in this guide will continue using the jsonlog format.
Controlling the log severity level
As we've discussed earlier, PostgreSQL produces a lot of logs. A well-tuned configuration filters out routine noise while keeping visibility into meaningful events such as slow queries, failed transactions, or system errors.
Every PostgreSQL log entry includes a severity level that indicates how critical the event is. Adjusting the threshold helps control how much information is recorded and what types of messages are ignored.
| Severity | Usage |
|---|---|
| DEBUG1 .. DEBUG5 | Progressively more detailed diagnostic output intended for low-level debugging |
| INFO | Routine messages that are implicitly requested by users |
| NOTICE | Noteworthy events that should be noticed by users |
| WARNING | Potential issues that may not stop execution |
| ERROR | Errors that caused the current query to fail |
| LOG | General database activity of interest to administrators |
| FATAL | Errors that terminate the current session although the server continues running |
| PANIC | Severe internal errors that forces all database sessions to quit |
Here's some examples of what the different error_severity values look like:
1234{...,"error_severity":"DEBUG","message":"client backend (PID 111) exited with exit code 0",...}{...,"error_severity":"ERROR","state_code":"0A000","message":"cross-database references are not implemented: ...",...}{...,"error_severity":"LOG","message":"checkpoint complete: wrote 6 buffers (0.0%) [...]",...}{...,"error_severity":"WARNING","state_code":"25P01","message":"SET LOCAL can only be used in transaction blocks",...}
You can control the minimum severity of messages written to the log using the
log_min_messages parameter:
1log_min_messages = warning # default
This tells PostgreSQL to log only WARNING-level events and above.
Understanding log_min_error_statement
The log_min_error_statement parameter controls whether PostgreSQL logs the SQL
text of a failed statement alongside its corresponding error message. It
determines at which severity level PostgreSQL should include the full query text
in the logs.
With the default configuration, the full SQL query for all messages with a
severity of ERROR or higher are recorded. If you execute a failing query such
as:
1SELECT * FROM does_not_exist;
You will see the following ERROR entry with a statement field:
12345678{[...],"error_severity": "ERROR","state_code": "42P01","message": "relation \"does_not_exist\" does not exist","statement": "SELECT * FROM does_not_exist;",[...]}
Since log_min_error_statement = error, PostgreSQL includes the original
statement field in the ERROR event itself.
If you raise the threshold to only log statements that cause more severe conditions:
1SET log_min_error_statement = fatal;
Then run the same failing query against
1SELECT * FROM does_not_exist;
The log output no longer includes a statement field:
1234567{[...],"error_severity": "ERROR","state_code": "42P01","message": "relation \"does_not_exist\" does not exist",[...]}
Here, the query text is omitted because the event's severity (ERROR) is below
the configured threshold (FATAL). The database still logs the error message,
but it does not include the SQL text that caused it.
The presence of query text in your logs also depends on the log_statement
parameter. If it's set to something other than none, you may see a
separate LOG record showing the relevant SQL query (regardless of the
log_min_error_statement value):
123456{[...],"error_severity": "LOG","message": "statement: SELECT * FROM does_not_exist;",[...]}
In general, keeping the default log_min_error_statement = error is recommended
in most environments so that you can see what SQL statements are associated with
errors. In development or staging, you may lower it even further maximum
visibility into query behavior.
However, if privacy or compliance requirements restrict SQL text from appearing
in logs, you can raise it to panic to effectively turn it off.
Controlling the log verbosity
PostgreSQL also lets you control how much detail is included in each log entry
through the log_error_verbosity parameter. This determines whether fields such
as detail, hint, and source file locations appear in the logs.
1log_error_verbosity = default
The available options are:
terse: Minimal output, showing only the basic error message.default: Includes supplementary context likedetailandhintfields.verbose: Adds the source file name, function name, and line number where the message originated which is useful for troubleshooting PostgreSQL itself.
Here's an example output with the default setting:
12345678910{[...],"error_severity": "ERROR","state_code": "2BP01","message": "cannot drop table album because other objects depend on it","detail": "constraint fk_trackalbumid on table track depends on table album","hint": "Use DROP ... CASCADE to drop the dependent objects too.","statement": "DROP table album;",[...]}
Setting it to verbose will include the following additional fields:
1234567{[...],"func_name": "reportDependentObjects","file_name": "dependency.c","file_line_num": 1148,[...]}
Logging SQL queries in PostgreSQL
PostgreSQL provides fine-grained control over which SQL statements are written
to the server log through the log_statement parameter:
1log_statement = 'ddl' # Options: none | ddl | mod | all
Each level builds upon the previous one:
none: Disables statement logging entirely (the default).ddl: Logs only Data Definition Language (DDL) commands, such asCREATE TABLE,ALTER TABLE,DROP INDEX, and other schema-related operations. It is ideal for tracking database structure changes without including routine query traffic.mod: Logs DDL statements plus all Data Modification Language (DML) commands (INSERT,UPDATE,DELETE,TRUNCATE). This is useful for auditing changes to data while ignoring pure reads (SELECT).all: Logs every SQL statement executed, including allSELECTqueries. It is extremely detailed, and will significantly degrade performance on busy systems.
With the jsonlog format, these statements will be recorded in the LOG
severity:
123456{[...],"error_severity": "LOG","message": "statement: SELECT * from album limit 1;",[...]}
Note that SQL statements that contain syntax errors will not be logged even if
log_statement is set to all. That's because the log message is emitted only
after basic parsing has been done to determine the statement type.
For example, the following statement yields a syntax error due to the
misspelling of FROM:
1SELECT * FORM users;
In the logs, you won't see a LOG entry with the SQL statement (regardless of
log_statement) since PostgreSQL's parser detects this before query execution
and raises a syntax error immediately.
But an ERROR log will be recorded containing the statement field (assuming
log_min_error_statement is set to ERROR or a less severe level):
12345678{[...],"error_severity": "ERROR","state_code": "42601","message": "syntax error at or near \"FORM\"","statement": "SELECT * FORM album;",[...]}
In this manner, the statement leading to the syntax error is preserved leading to faster resolution.
Logging PostgreSQL query execution times
PostgreSQL can record how long each SQL statement takes to execute, allowing you to identify slow queries, monitor performance trends, and track latency across workloads. It is one of the simplest and most effective ways to detect inefficient queries before they become production issues.
You can enable the log_duration setting to make PostgreSQL record the
execution time of every statement:
1log_duration = on
When enabled, a LOG entry is recorded with its message field set to the
duration of the query:
1{...,"error_severity":"LOG","message":"duration: 2.464 ms",...}
If you also have log_statement set to a level that captures the query, you'll
see a separate LOG entry showing the statement that was actually executed:
1{...,"error_severity":"LOG","message":"statement: TABLE album LIMIT 10;",...}
In production, it often more efficient to focus on slow queries alone rather than logging every statement, so let's look at that next.
Logging only slow queries
PostgreSQL can log statements that only exceed a specific execution time
threshold using the log_min_duration_statement parameter whose value is
specified in milliseconds if no unit is provided:
12log_duration = offlog_min_duration_statement = 1000 # milliseconds
This configuration means any query taking longer than 1000 ms will be written to
the log, and it produces an identical entry to log_duration:
1{...,"error_severity":"LOG","message":"duration: 1006.850 ms",...}
All faster queries are ignored, reducing log noise while still capturing the statements that need tuning or indexing.
One other difference between log_duration and log_min_duration_statement is
that the latter can log not just how long a query took, but the actual SQL text
as well.
When you turn on log_duration, PostgreSQL reports how long each statement took
to run but doesn't include the statement itself as you've already seen.
If log_duration is off and log_min_duration_statement is to 0,
PostgreSQL logs both the execution time and the full query for every statement.
The entries look something like this:
123456{[...],"error_severity": "LOG","message": "duration: 3.324 ms statement: TABLE album limit 1;",[...]}
Finally, using log_duration and setting log_min_duration_statement to a
positive number ensures that all durations are logged, but the statement text
is only included for statements exceeding the threshold.
Sampling query and transaction durations
If log_min_duration_statement is still too coarse for your needs, then
PostgreSQL provides some sampling-based logging options that let you collect
statistically representative query performance data without overwhelming your
observability pipeline:
log_min_duration_samplesets the minimum execution time for statements to be considered for sampling. Only queries running longer than this threshold will be eligible for logging.log_statement_sample_ratedefines the fraction of eligible queries (as a floating-point value between0.0and1.0) that will actually be logged. Sampling is random and independent for each query.log_transaction_sample_ratecontrols how many entire transactions are logged in full, regardless of statement duration. Each transaction has a random chance of being fully logged based on this rate.
Here's an example:
123456log_min_duration_sample = 1000log_statement_sample_rate = 0.1# Ensure other duration parameters are disabled# log_min_duration_statement = -1# log_duration = off;
This means that only about 10% of queries that take at least 1000 ms will be
logged. It produces identical logs to those generated by
log_min_duration_statement, but only for a representative sample.
Combining query duration logs with pg_stat_statements
While logging slow queries is helpful for catching individual problematic events, it's not the best tool for an aggregate view of your database's performance.
For that, using the built-in
pg_stat_statements extension
is the standard approach as it allows you track the planning and execution
statistics of all SQL statements executed by a server.
To enable it, you'd typically add pg_stat_statements to
shared_preload_libraries in postgresql.conf and then run
CREATE EXTENSION IF NOT EXISTS pg_stat_statements;.
Then running a query like the one below will show you the class of query that is your biggest problem performance-wise:
1SELECT * FROM pg_stat_statements ORDER BY total_exec_time DESC LIMIT 10;
You then use your query duration logs (which you've configured with
log_min_duration_statement) to find specific examples of that slow query to
see which parameters are causing the slowness.
Connection and disconnection logs
PostgreSQL 18 introduces more control over connection logging, making it possible to capture only the parts of the connection lifecycle that matter to you.
Previously, log_connections was a simple on/off switch. When enabled,
PostgreSQL would log every stage of a new session: when the connection was
received, when authentication succeeded, and when authorization completed.
This was useful for auditing, but it could generate large amounts of log noise
on busy systems. With PostgreSQL 18, log_connections is now a list of
stages rather than a boolean, allowing for more granular logging.
You can now choose one or more of the following options:
receipt: logs when a connection is received by the server.authentication: logs when authentication completes and includes details about the method used (for example,md5,scram-sha-256, ortrust).authorization: logs when the session is authorized, showing the database name, user, and application name.- an empty string (
'') — disables connection logging entirely.
Here's how you might configure it:
1log_connections = 'authorization';
With this configuration, only the authorization step will appear in the logs:
123456{[...],"error_severity": "LOG","message": "connection authorized: user=postgres database=chinook application_name=pg_isready",[...]}
This is often all you need for auditing purposes or general connection monitoring. If you prefer the legacy behavior that logs all three stages, specify all of them:
1log_connections = 'all';
You'll then see:
123{...,"error_severity":"LOG","message":"connection authenticated: user=\"postgres\" method=trust (/var/lib/postgresql/18/docker/pg_hba.conf:117)",...}{...,"error_severity":"LOG","message":"connection authorized: user=postgres database=chinook application_name=pg_isready",...}{...,"error_severity":"LOG","message":"connection ready: setup total=0.973 ms, fork=0.216 ms, authentication=0.075 ms","application_name":"pg_isready",...}
This change gives you better flexibility to control verbosity and minimize unnecessary noise in high-traffic environments, while still meeting compliance and auditing requirements.
To complement connection logs, you can continue the log_disconnections setting
to record when sessions close and how long they lasted:
1log_disconnections = on
This produces logs that look like this:
123456{[...],"error_severity": "LOG","message": "disconnection: session time: 0:00:00.001 user=postgres database=chinook host=[local]",[...]}
Together, these features make it easier to monitor session lifecycles, audit user access, and feed metrics such as connection churn or session duration into your observability dashboards without the excessive volume that earlier versions produced.
Creating user-defined log records
PostgreSQL isn't limited to system-generated logs; you can also write your own messages directly from SQL or PL/pgSQL code. This is particularly helpful when you want to track business logic, debug application-side issues, or record custom events during triggers and stored procedure execution.
The RAISE statement in PL/pgSQL lets you send messages to the PostgreSQL log
at different severity levels. These messages appear in the same log stream as
normal PostgreSQL logs and follow the same formatting and filtering rules
defined by log_min_messages.
Here's a simple example:
123456CREATE OR REPLACE FUNCTION log_activity()RETURNS void AS $$BEGINRAISE WARNING 'This is a simulated warning message';END;$$ LANGUAGE plpgsql;
When the function is executed, you'll see the following WARNING log:
123456789{[...],"error_severity": "WARNING","state_code": "01000","message": "This is a simulated warning message","context": "PL/pgSQL function log_activity() line 4 at RAISE","statement": "SELECT log_activity();",[...]}
Final thoughts
This guide laid the foundation for an observable PostgreSQL setup. You
configured postgresql.conf, tuned verbosity, and enabled structured JSON
output—turning PostgreSQL’s logs into clean, machine-readable data.
But structured logs alone don't provide observability. They still lack context
about which API request, background job, or trace initiated each query. The next
step is context propagation, where your application passes trace identifiers
such as trace_id and span_id into SQL statements. When PostgreSQL logs those
queries, the trace context travels with them.
Once that link is established, your observability backend can finally connect the dots: a user request in your frontend, the span that handled it, and the exact query that ran in the database. That's when PostgreSQL stops being an isolated component and becomes a fully observable service.
The next article will complete that journey by showing how to map PostgreSQL’s JSON logs to the OpenTelemetry data model, propagate trace context, and integrate your database as a first-class part of your distributed tracing system.
