Last updated: November 27, 2025
Leveling Up Your Python Logs with Structlog
Python’s standard logging module is capable, but shaping it into a system that produces structured, contextual, and queryable logs requires understanding a lot of concepts: hierarchical logging, formatters, filters, handlers, and configuration files. It can be done, but it often feels like you are building infrastructure instead of writing your application.
Structlog takes a different approach. Rather than wrestling with object hierarchies, you simply declare how each event should be processed and enriched. The result is logging that feels natural to write, while producing output that works just as well for humans skimming a console as it does for machines ingesting JSON into an observability platform.
This guide takes a practical look at using Structlog as the foundation for a production-grade logging system. We will cover configuration, contextual data, structured exception handling, and integration with tracing via OpenTelemetry. By the end, you’ll have the patterns you need to turn your application from an opaque box into one that is transparent and easy to understand.
Let's begin!
Understanding the Structlog philosophy
The standard library's logging module is built around a small network of
objects. You create a Logger, attach one or more Handler instances, give
each handler a Formatter, and sometimes add Filters. A LogRecord is
created and handed off to that graph. It works, and it is flexible, but it can
be hard to follow.
Structlog takes a simpler path where each log event moves through a clear,
linear chain of functions called processors. When your code calls something
like logger.info("User logged in", user_id="usr_123"), structlog immediately
builds a mutable dictionary for that event that looks like this:
1{ "event": "User logged in", "user_id": "usr_123" }
That dictionary is then passed to each registered processor in order. A processor is just a function that gets three arguments: the logger, the method name, and the event dictionary. It can read the dictionary, add keys, remove keys, or tweak values.
The last processor is the renderer. Its job is to turn the final dictionary into a string and write it to your chosen destination, such as the console, a file, or a socket.
This declarative model is incredibly powerful because it provides a single source of truth. You can look at your list of processors and know exactly how a log entry is built, step by step. There is no hidden state or complex object interaction. It is a clean, predictable, and easily debuggable flow.
Examining the default configuration
Before diving into custom setups, it is helpful to see what Structlog does out of the box. The library ships with a default configuration that produces development-friendly logs without requiring you to write any setup code.
First, install the library if you haven’t already:
1pip install structlog
Now try the simplest possible logger:
1234567891011import structloglogger = structlog.get_logger()logger.info("User profile updated",user_id="usr_f4b7a1c2",request_id="req_9e8d5c3a-7b1f-4a8e-9c6d-0e2f1a3b4c5d",updated_fields=["email", "last_login"],duration_ms=54.3,status="success")
When you run this, you should see output along the lines of:
12025-09-05 18:13:33 [info ] User profile updated [__main__] duration_ms=54.3 request_id=req_9e8d5c3a-7b1f-4a8e-9c6d-0e2f1a3b4c5d status=success updated_fields=['email', 'last_login'] user_id=usr_f4b7a1c2
What you’re seeing is a nicely formatted and colorized log line with a timestamp, the log level (info), and the message text, and finally the included key/value pairs.
Behind the scenes, Structlog is quietly applying a handful of processors that enrich and format each event before it gets written out. Here's the default configuration:
1234567891011121314structlog.configure(processors=[structlog.contextvars.merge_contextvars,structlog.processors.add_log_level,structlog.processors.StackInfoRenderer(),structlog.dev.set_exc_info,structlog.processors.TimeStamper(fmt="%Y-%m-%d %H:%M:%S", utc=False),structlog.dev.ConsoleRenderer()],wrapper_class=structlog.make_filtering_bound_logger(logging.NOTSET),context_class=dict,logger_factory=structlog.PrintLoggerFactory(),cache_logger_on_first_use=False)
Here, the log event passes through the processors in sequential order. Each
one adds a small piece of structure: merging in any contextual values you’ve set
elsewhere, attaching the log level, making sure exceptions or stack traces are
displayed neatly when they occur, and including a timestamp.
The very last step is the ConsoleRenderer(), which takes the fully enriched
event dictionary and turns it into the formatted, colorized line you see in your
terminal.
The other default behaviors of the Structlog logger are:
-
wrapper_class: This wrapper gives you a logger that can filter messages by log level. WithNOTSET, nothing is filtered out, so every message goes through. In practice, you’d raise this toINFOor higher in production to reduce noise. -
context_class: Structlog needs somewhere to store event data as it flows through the pipeline. By default, it uses a plain Python dictionary to keep things simple and predictable, but you could swap in something else (likeOrderedDict) if you want ordered keys or a custom data structure. -
logger_factory: This determines where your logs are sent, which issys.stdoutby default. You can switch it to the standard error withstructlog.PrintLoggerFactory(sys.stderr). -
cache_logger_on_first_use: By default, Structlog doesn’t cache loggers. That means every call toget_logger()creates a new one, which ensures that if you change the configuration at runtime, the new settings are applied immediately. If performance is critical, you can enable caching for a small speed boost.
Put together, these defaults make Structlog easy to experiment with: nothing gets filtered, logs print straight to your terminal, and you can reconfigure on the fly without restarting your process. It’s a developer-friendly setup that you’ll want to tighten up before going to production.
The production configuration: machine-readable JSON
In a production environment, the requirements are different. Logs are not primarily for humans to read in real-time; they are for machines to ingest, parse, index, and query. The industry standard for this is JSON.
Our production configuration will be similar to the default, but with a few changes:
12345678910111213141516def configure_structlog(log_level=logging.INFO):structlog.configure(processors=[structlog.contextvars.merge_contextvars,structlog.processors.add_log_level,structlog.processors.StackInfoRenderer(),structlog.dev.set_exc_info,structlog.processors.dict_tracebacks,structlog.processors.TimeStamper(fmt="iso"),structlog.processors.JSONRenderer() # must be the last one],wrapper_class=structlog.make_filtering_bound_logger(log_level),context_class=dict,logger_factory=structlog.PrintLoggerFactory(),cache_logger_on_first_use=True)
The changes here include:
- Renderer (
ConsoleRenderer→JSONRenderer): Instead of a pretty, colorized line for humans, each event becomes a single JSON object so that log shippers and observability platforms can ingest it without guessing at formats or using brittle regular expressions. - Timestamp (
fmt="iso"): Timestamps use ISO 8601 format in UTC, which avoids timezone confusion and preserves correct lexicographical ordering, especially across regions. - Dict tracebacks (
dict_tracebacks): Exceptions are serialized into structured dictionaries instead of raw text. This makes stack traces machine-readable, so that observability tools can display them cleanly, and you can query or filter logs by exception type or message. - Configurable log level: The log level is now passed in as an argument, allowing you to control log verbosity in production without changing code, typically by reading an environment variable.
- Caching: In production, you rarely hot-reload logging configuration, so caching gives a small performance boost by avoiding repeated wrapper setup.
Now, you can dynamically choose your configuration at startup:
123456789101112import osimport structlogimport logging# ... [logging configuration]if os.environ.get("APP_ENV") == "production":log_level = os.environ.get("LOG_LEVEL", logging.INFO)configure_structlog(log_level)logger = structlog.get_logger()# ... rest of your application logic
This pattern allows you to retain Structlog's development-friendly defaults, while switching to a production-ready JSON configuration automatically when the environment demands it.
Note that while Structlog operates independently, it adopts the same level names
and numeric values as the standard library. For convenience and clarity, we use
the constants from the logging module (like logging.INFO) to set these
levels.
Assuming you set APP_ENV=production in your environment, you'll see the
following JSON output:
12345678910{"user_id": "usr_f4b7a1c2","request_id": "req_9e8d5c3a-7b1f-4a8e-9c6d-0e2f1a3b4c5d","updated_fields": ["email", "last_login"],"duration_ms": 54.3,"status": "success","event": "User profile updated","level": "info","timestamp": "2025-09-06T07:40:44.956022Z"}
The log message is placed in an event key, but you can rename it to msg by
using the
EventRenamer() processor
as follows:
12345processors=[# [...]structlog.processors.EventRenamer("msg"),structlog.processors.JSONRenderer()]
The event key will be renamed to msg accordingly:
12345{[...]"timestamp": "2025-09-06T07:46:58.238599Z","msg": "User profile updated"}
The examples in the remainder of this article will assume that you're using the production configuration.
How log levels work in Structlog
Structlog keeps the same log levels you may already know from Python’s standard logging module:
| Level | Numeric Value | Description |
|---|---|---|
NOTSET | 0 | Special: disables log-level filtering |
DEBUG | 10 | Detailed diagnostic information |
INFO | 20 | Normal application events |
WARNING | 30 | Potential problems |
ERROR | 40 | Failed operations |
CRITICAL | 50 | Severe failures |
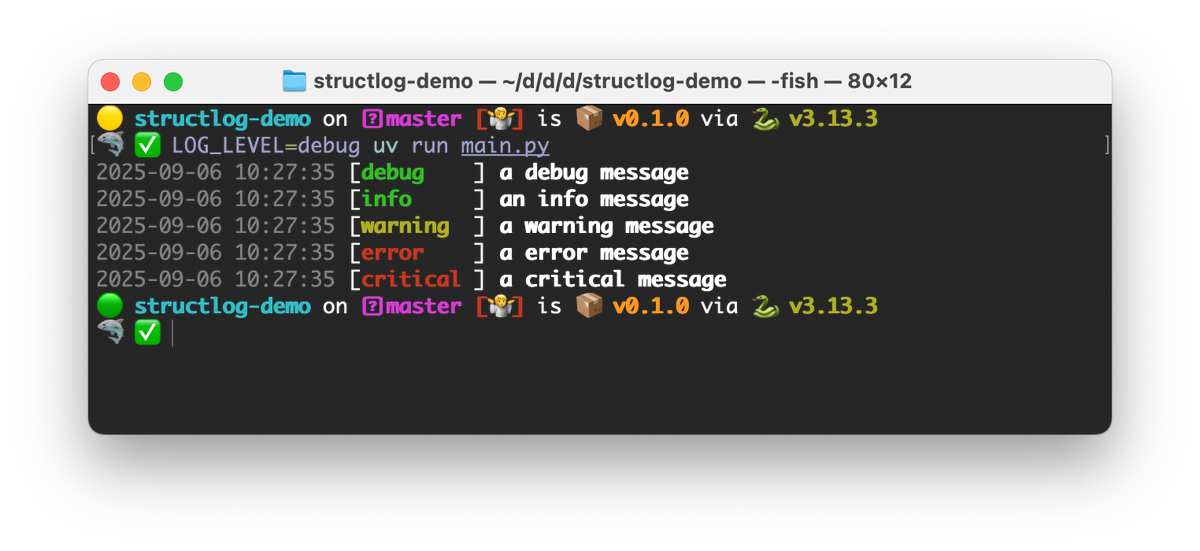
Each level besides NOTSET has a corresponding method on the logger:
12345logger.debug("a debug message")logger.info("an info message")logger.warning("a warning message")logger.error("a error message")logger.critical("a critical message")
If you’re working in an async context, Structlog also provides async variants
which are prefixed with a:
123456789import structlogimport asynciologger = structlog.get_logger()async def f():await logger.ainfo("async info message")asyncio.run(f())
As you've already seen, the level threshold is controlled by the wrapper_class
argument to structlog.configure():
123structlog.configure(wrapper_class=structlog.make_filtering_bound_logger(<log_level>),)
The argument to make_filtering_bound_logger() could be a simple string (like
"INFO") or the constants on the logging module (such as logging.INFO).
Level-based filtering is done early before the event dictionary is created to
avoid doing unnecessary work for a message that will ultimately be discarded.
Structlog also makes the log level explicit inside the event dictionary itself.
This happens thanks to the add_log_level processor, which is included in the
default configuration.
Downstream processors (like the renderer) then use that field to decide how the log line should appear—whether that’s a colorized console message in development or a structured JSON object in production.
Filtering and dropping events
In some cases, log level filtering isn’t enough. You may want to drop or modify logs based on their content—for example, to exclude noisy health checks or to mask sensitive fields. You can do this with a custom processor:
1234567891011def filter_logs(logger, method_name, event_dict):if event_dict.get("path") == "/health":raise structlog.DropEventreturn event_dictstructlog.configure(processors=[filter_logs,# [...]],)
If a processor raises structlog.DropEvent, the event is discarded and no log line is emitted.
Filtering by call site information
Sometimes you don’t just want to filter logs by level or custom fields; you want
to filter them based on where they came from. Structlog makes this possible with
the
CallsiteParameterAdder,
which can enrich your event dictionary with details like the module name,
function name, line number, or thread ID. Once those fields are available, you
can write a processor that decides which events to keep.
Let’s say you have a simple application with two operations: processing an order and canceling an order:
12345678910logger = structlog.get_logger()def process_order(order_id):logger.info("Order processed successfully", order_id=order_id)def cancel_order(order_id):logger.warning("Order canceled", order_id=order_id)process_order("ord_123")cancel_order("ord_456")
This produces:
12{"order_id": "ord_123", "level": "info", "timestamp": "2025-09-06T13:59:03.397454Z", "msg": "Order processed successfully", "func_name": "process_order"}{"order_id": "ord_456", "level": "warning", "timestamp": "2025-09-06T13:59:03.397618Z", "msg": "Order canceled", "func_name": "cancel_order"}
Now, suppose you only care about logs from process_order and want to ignore
everything else. You can add a custom processor that drops events from the
unwanted function:
12345678910111213def filter_out_cancellations(_, __, event_dict):if event_dict.get("func_name") == "cancel_order":raise structlog.DropEventreturn event_dictstructlog.configure(processors=[structlog.processors.CallsiteParameterAdder([structlog.processors.CallsiteParameter.FUNC_NAME]),filter_out_cancellations # must be placed after CallsiteParameterAdder])
With this configuration, calling both functions again yields:
1234567{"order_id": "ord_123","level": "info","timestamp": "2025-09-06T13:59:03.397454Z","msg": "Order processed successfully","func_name": "process_order"}
The cancel_order log entry has now been filtered out.
The reason this setup works is that CallsiteParameterAdder adds details about
where the log call was made, such as the function name. Once that information is
present in the event dictionary, the custom filter_out_cancellations processor
can examine it and decide what to do. If the function name matches
cancel_order, it raises DropEvent, which tells Structlog to discard the log
entirely.
Because processors are executed in order, the event first gains the extra
metadata, then it is evaluated by the filter, and finally the surviving events
are handed off to the renderer. The result is that only logs from
process_order appear in the output, while logs from cancel_order are
silently filtered out.
Writing logs to files
The 12-Factor App methodology recommends writing logs to standard output and letting the platform handle collection, and that's still the best approach in containerized and cloud environments. However, some deployments do require logs to be written directly to files.
In such cases, you can configure the PrintLoggerFactory as follows so logs are
sent to a file instead of stdout:
123456789import structlogfrom pathlib import Pathstructlog.configure(processors=[...],logger_factory=structlog.PrintLoggerFactory(file=Path("app").with_suffix(".log").open("wt")),)
You can also use the
WriteLoggerFactory
which the documentation claims is "a little faster" than PrintLoggerFactory at
the cost of some versatility.
Structlog itself doesn’t handle rotation or retention, but leaves such tasks to a dedicated system utility like Logrotate.
Mastering contextual logging
The single most important practice that separates log records from a stream of messages into a true observability signal is context.
In Structlog, every logging call lets you attach structured key–value pairs alongside your message. These fields travel with the log event through the processor pipeline and end up in the final output:
1234567logger.info("User profile updated",user_id="usr_f4b7a1c2",request_id="req_9e8d5c3a",status="success",duration_ms=54.3)
Instead of just a sentence like "User profile updated" you now have rich, machine-readable details: which user was affected, which request triggered the change, whether it succeeded, and how long it took.
You can also bind context to a logger so that it’s included automatically in every message from that logger. For instance:
1234# bind() returns a copy of `logger` with user_id added to its contextlogger = logger.bind(user_id="usr_f4b7a1c2")logger.info("Fetching user profile")logger.info("Profile fetched successfully")
Both log lines will now include the user_id field without you having to repeat
it each time:
12{"user_id": "usr_f4b7a1c2", "level": "info", "timestamp": "2025-09-06T09:00:25.822429Z", "msg": "Fetching user profile"}{"user_id": "usr_f4b7a1c2", "level": "info", "timestamp": "2025-09-06T09:00:25.822570Z", "msg": "Profile fetched successfully"}
If later on you decide to remove the bound fields from the logger's context, you
can use
unbind()
and
try_unbind():
12logger = logger.unbind("user_id") # will throw an error if the key doesn't existlogger = logger.try_unbind("user_id") # missing keys are ignored
Reliable context propagation in web apps
While bind() is useful, it has limitations in highly concurrent environments
like web applications. You don't want to pass a request-specific logger instance
down through every function call as it quickly becomes clumsy.
A much more powerful and elegant solution is to use context variables
through
structlog.contextvars.
This takes advantage of Python’s contextvars module to store context that is
scoped to the current thread or async task.
Each request (or background job) gets its own isolated context, so you never have to worry about data leaking between concurrent executions.
That’s why our production configuration includes the
structlog.contextvars.merge_contextvars processor for pulling the context into
each log event automatically.
All you need to do is bind values at the beginning of a request or task, and those values will show up in every log line until the context is cleared.
Here’s an example of how you might set this up in a FastAPI middleware:
12345678910111213141516171819202122232425262728293031323334353637383940414243444546474849505152535455565758596061626364656667686970717273747576777879808182838485import uuidfrom fastapi import FastAPI, Request, HTTPExceptionimport structlogimport timeimport logging# ...your structlog configurationlogger = structlog.get_logger()app = FastAPI()@app.middleware("http")async def context_middleware(request: Request, call_next):start_time = time.monotonic()# This is the request ID that will be attached to all logs for this requestrequest_id = request.headers.get("X-Request-ID", str(uuid.uuid4()))client_ip = request.headers.get("X-Forwarded-For", request.client.host)user_agent = request.headers.get("user-agent", "-")# Clear any existing context from previous requestsstructlog.contextvars.clear_contextvars()# All logs produced in this request will share the same request_idstructlog.contextvars.bind_contextvars(request_id=request_id,)request_logger = logger.bind(method=request.method,path=request.url.path,client_ip=client_ip,user_agent=user_agent,)request_logger.info("Incoming %s request to %s", request.method, request.url.path)response = await call_next(request)duration_ms = (time.monotonic() - start_time) * 1000log_level = logging.INFOif response.status_code >= 500:log_level = logging.ERRORelif response.status_code >= 400:log_level = logging.WARNINGrequest_logger.log(log_level,"%s %s completed with status %s",request.method,request.url.path,response.status_code,status=response.status_code,duration=duration_ms,)return response@app.get("/users/{user_id}")async def get_user_profile(user_id: str):# You can even add more context, scoped just to this function# and any downstream functionsstructlog.contextvars.bind_contextvars(user_id=user_id)logger.info("User profile requested.")if user_id == "error":raise HTTPException(status_code=404, detail="Item not found")logger.info("Successfully retrieved user profile.")return {"user": user_id, "status": "ok"}if __name__ == "__main__":import uvicornuvicorn.run(app,host="0.0.0.0",port=8000,reload=False,access_log=False,)
With this setup, every request to your API gets its own request ID bound to the
logging context, so that it's automatically included in all log messages during
that request, without you having to pass a logger or request_id around
manually.
123{"method": "GET", "path": "/users/12", "client_ip": "127.0.0.1", "user_agent": "curl/8.7.1", "level": "info", "request_id": "510ec4b6-f27f-4380-9082-487a3193094e", "timestamp": "2025-09-06T10:33:03.077963Z", "msg": "Incoming GET request to /users/12"}{"level": "info", "request_id": "510ec4b6-f27f-4380-9082-487a3193094e", "user_id": "12", "timestamp": "2025-09-06T10:33:03.078208Z", "msg": "User profile requested."}[...]
Within the scope of a function you can continue to use bind() if you intend to
add temporary fields that are only relevant to a narrow slice of work (see the
request_logger for access logging), or call
structlog.contextvars.bind_contextvars() again to add new fields and pass them
on to loggers in downstream functions.
Adding global context
If you need some variables to appear in every single log record regardless of how the logger is obtained, you can add them with a processor that runs for each event.
You only need to capture the values at startup, then merge them into the event dictionary:
123456789101112131415161718192021222324252627282930313233import loggingimport osimport os as _osimport socketimport structlogAPP_VERSION = "2.4.1"def add_global_fields_factory():service = os.getenv("SERVICE_NAME", "user-service")env = os.getenv("APP_ENV", "development")region = os.getenv("REGION", "local")host = socket.gethostname()pid = _os.getpid()version = APP_VERSIONdef add_global_fields(logger, method_name, event_dict):event_dict.setdefault("service", service)event_dict.setdefault("env", env)event_dict.setdefault("region", region)event_dict.setdefault("version", version)event_dict.setdefault("host", host)event_dict.setdefault("pid", pid)return event_dictreturn add_global_fieldsstructlog.configure(processors=[add_global_fields_factory(), # add this as the first processor# [...]])
Each record from the service will now contain the global fields:
12345678910111213{"service": "user-service","env": "development","region": "us-east-1","version": "2.4.1","host": "MacBook-Pro.local","pid": 82904,"level": "info","request_id": "4af0acc1-1064-4470-a538-bb9862cd2154","user_id": "12","timestamp": "2025-09-06T10:18:14.194947Z","msg": "Successfully retrieved user profile."}
Capturing Python errors and exceptions
When an error occurs in production, your logs are your first and often best
debugging tool. A plain traceback string is helpful, but a structured exception
record is far more powerful. This is exactly what the dict_tracebacks
processor gives you.
The key to this is using logger.exception(). While you can log errors with
logger.error(), using logger.exception() inside an except block is the
preferred pattern. It automatically captures the active exception and passes it
through the pipeline:
1234567891011structlog.configure(processors=[structlog.processors.dict_tracebacks # ensure dict_tracebacks is configured# [...]],)try:1 / 0except Exception:logger.exception("Dividing by zero")
With the dict_tracebacks processor enabled, the resulting JSON log contains a
fully structured representation of the exception. Here’s a simplified example:
123456789101112131415161718192021{"level": "error","msg": "Dividing by zero","timestamp": "2025-09-06T12:28:16.625474Z","exception": [{"exc_type": "ZeroDivisionError","exc_value": "division by zero","frames": [{"filename": "main.py","lineno": 37,"name": "<module>","locals": {"logger": "<BoundLoggerLazyProxy ...>"}}]}]}
Instead of a traceback string, you now have a structured object that exposes the exception type, value, and even stack frames. This structure unlocks powerful new workflows in your log aggregation system. For example, you can:
- Query for all logs where
exception.exc_typeequalsZeroDivisionError, - Count how many errors originated in a function by filtering on
exception.frames[0].name, - Trigger alerts if
exception.exc_valuecontains a specific string.
With structured tracebacks, your logs become more than just text. They become queryable data that dramatically reduces the time it takes to detect, diagnose, and fix production issues.
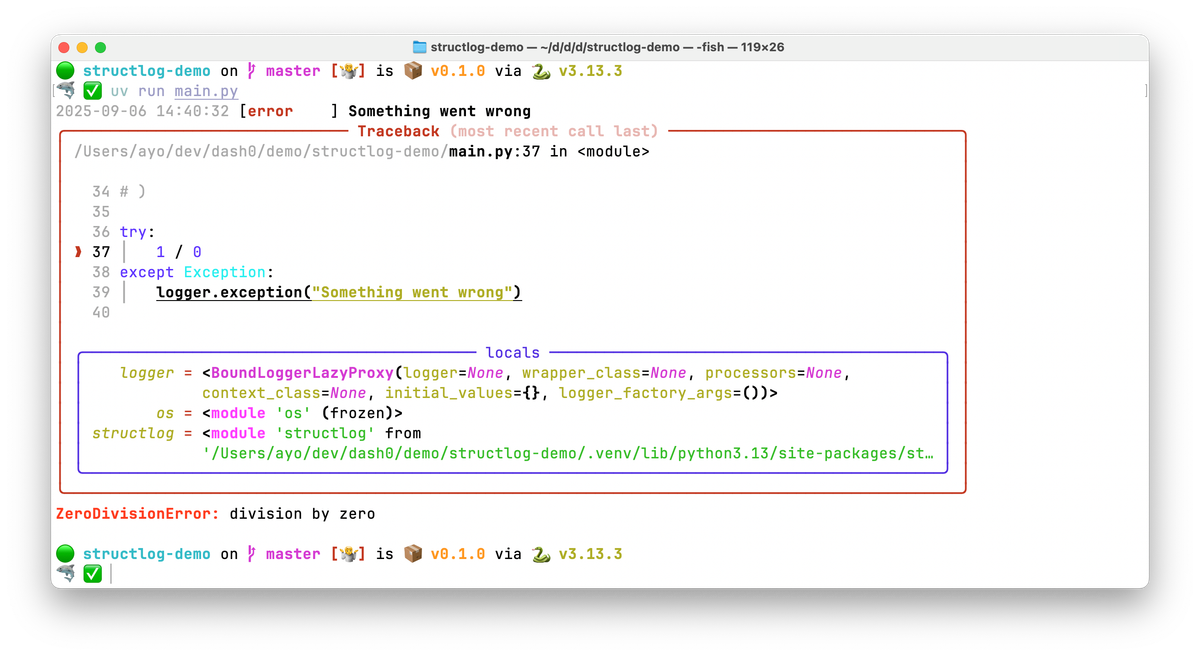
In development environments, you can install the rich library to render a colorful traceback in the terminal:
Integrating Structlog with OpenTelemetry
Structlog does not automatically add trace or span identifiers to your logs. To correlate logs with traces, you attach those fields yourself with a small processor that reads the current OpenTelemetry span and injects its IDs into the event dictionary.
Once in place, every log written inside an active span will carry trace_id and
span_id, which makes it possible to see your spans and logs in the same
context.
Below is a compact setup that wires Structlog to OpenTelemetry and adds the two IDs on every event:
1234567891011121314151617181920212223242526272829303132333435363738import osimport structlogimport loggingfrom opentelemetry import tracefrom opentelemetry.sdk.trace import TracerProvidertrace.set_tracer_provider(TracerProvider())tracer = trace.get_tracer(__name__)# [... rest of your tracing configuration]def add_open_telemetry_spans(_, __, event_dict):span = trace.get_current_span()if not span or not span.is_recording():return event_dictctx = span.get_span_context()parent = getattr(span, "parent", None)event_dict["span_id"] = format(ctx.span_id, "016x")event_dict["trace_id"] = format(ctx.trace_id, "032x")return event_dictstructlog.configure(processors=[# [...]add_open_telemetry_spans,structlog.processors.JSONRenderer() # must be the last one])logger = structlog.get_logger()def process_order(order_id):with tracer.start_as_current_span("process order") as span:logger.info("Order processed successfully", order_id=order_id)process_order("ord_123")
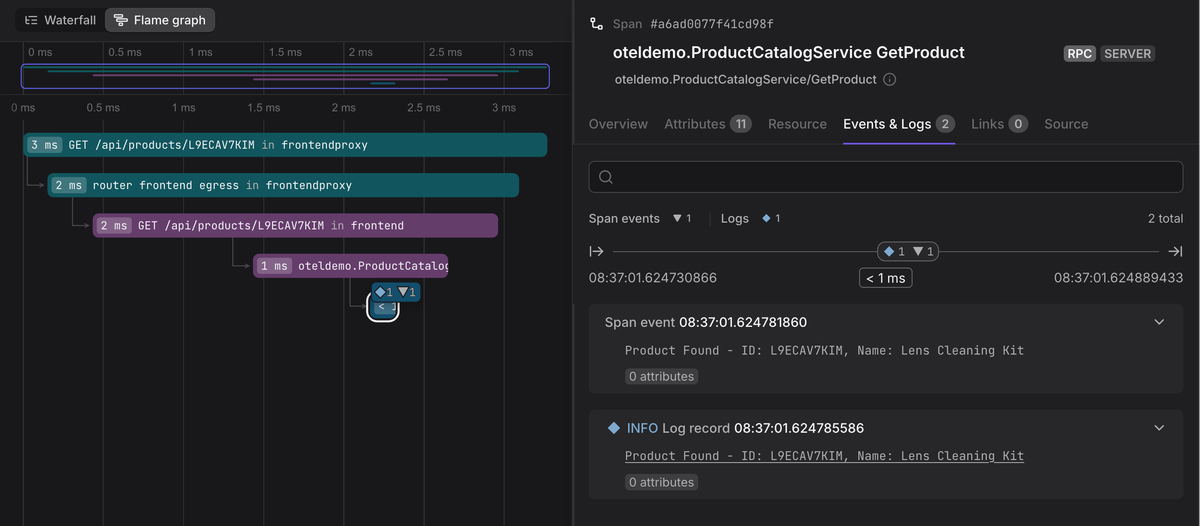
When the logger.info() call runs inside an active span, your JSON log will now
include the OpenTelemetry identifiers:
12345678{"order_id": "ord_123","level": "info","timestamp": "2025-09-07T07:13:43.906388Z","msg": "Order processed successfully","span_id": "da8405273d89b065","trace_id": "442d81cb25de382054575e33c1a659df"}
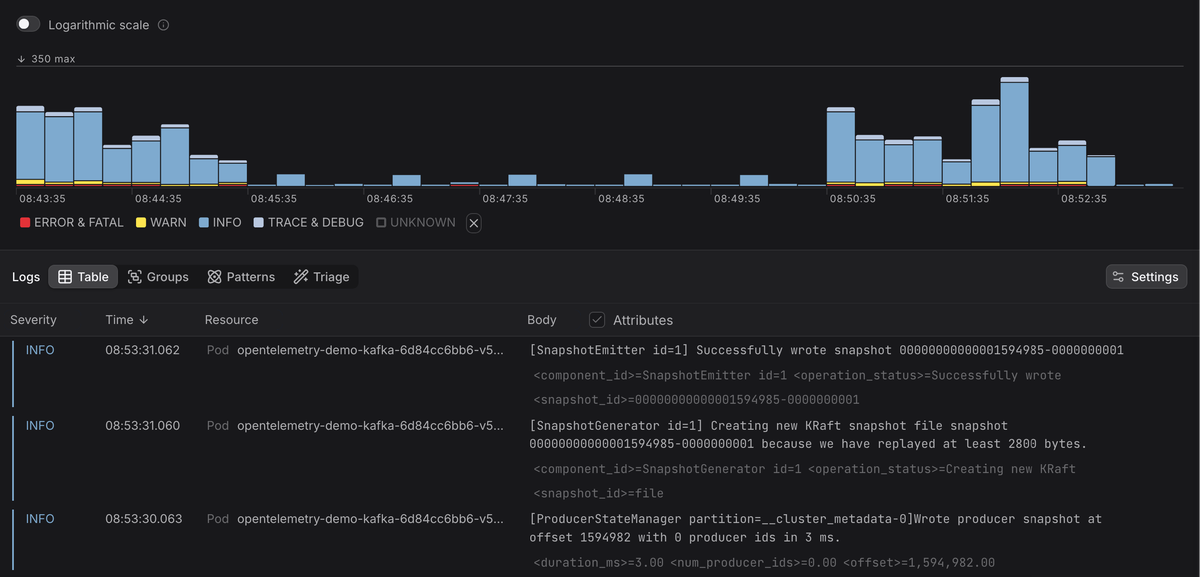
What's left is bringing your logs into an OpenTelemetry-native platform like Dash0 where they can be filtered and correlated with other signals like metrics and traces to give you a complete picture of your system's health.
At the time of writing, there is no way to export native OTLP logs directly from Structlog, so you have two options.
First, keep Structlog writing JSON to standard output or a file and let the OpenTelemetry Collector convert it to OTLP log schema, before forwarding to your backend. This keeps the application simple and pushes protocol concerns to the infrastructure.
The second option requires that you
bridge Structlog to the standard logging ecosystem
and attach an OTLP-capable handler. You'll need to configure
structlog.stdlib.LoggerFactory() and a ProcessorFormatter, then attach a
handler that exports to an endpoint speaking OTLP (usually the OTel Collector).
Final thoughts
Structlog turns Python logging into a stream of structured events rather than plain text. With its processor pipeline, you can enrich logs with context, filter noise, and render output in formats that suit both humans and machines.
We began with simple console logs, then moved to production configurations with
JSON rendering, timestamps, and structured exceptions. We explored how bind()
and contextvars add valuable context, how callsite parameters provide control,
and how integration with OpenTelemetry connects logs to traces.
The takeaway is clear: logs are data. Treating them as structured signals with Structlog makes debugging, monitoring, and operating modern applications far more effective.
Thanks for reading!
