Last updated: March 9, 2026
Monitoring Container Resource Usage with Docker Stats
When you're running containers in production, monitoring how they consume CPU, memory, network bandwidth, and disk I/O is the difference between proactively catching a memory leak before your application gets killed by the OOM reaper, and waking up in the middle of the night to a pager alert because your database container ate all available memory on the host.
Docker ships with a built-in command designed for exactly this purpose:
docker stats. Think of it as the container equivalent of top or htop on a
Linux system, but scoped specifically to your running containers instead of bare
processes. It reads metrics directly from the Linux kernel's cgroup filesystem
(more on that shortly), which means it imposes virtually no overhead in most
cases.
This guide covers everything you need to know about docker stats, from the
basics of reading its output all the way through to the underlying kernel
mechanics that power it, custom formatting for automation, the Docker Engine API
for programmatic access, and knowing when to reach for more capable monitoring
tools.
Prerequisites
To follow along, you'll need Docker Engine installed on a Linux, macOS, or Windows host. The examples in this article were tested on Docker Engine 29.x running on Ubuntu 24.04, though the core behavior is consistent across platforms and recent Docker versions.
If you want to run the example commands against real containers, you can run the OpenTelemetry Demo to give yourself something to observe.
1git clone https://github.com/open-telemetry/opentelemetry-demo.git && cd opentelemetry-demo/
1docker compose up --force-recreate --remove-orphans --detach
These containers have explicit resource limits set, which will make the metrics more interesting to inspect than containers running with unlimited defaults.
Quick start: the docker stats command reference
For when you need answers now, here are some common commands you'll reach for most often:
| Action | Command |
|---|---|
| View live stats for all running containers | docker stats |
| View stats for specific containers | docker stats <container1> <container2> |
| Get a single point-in-time snapshot | docker stats --no-stream |
| Include stopped containers | docker stats --all |
| Show only name, CPU, and memory | docker stats --format "table {{.Name}}\t{{.CPUPerc}}\t{{.MemUsage}}" |
| Output stats as JSON | docker stats --no-stream --format '{{ json . }}' |
| View stats for a Docker Compose service | docker compose stats <service> |
| View stats for all Compose services | docker compose stats |
Basic usage
At its simplest, running docker stats with no arguments streams a live,
continuously updating table of resource usage for every running container on the
host:
1docker stats
The output looks something like this:
123456789CONTAINER ID NAME CPU % MEM USAGE / LIMIT MEM % NET I/O BLOCK I/O PIDS74eb879e0ec8 frontend-proxy 1.37% 21.3MiB / 65MiB 32.77% 90.4kB / 214kB 51.7MB / 12.3kB 406336215b8a59 load-generator 67.80% 678.2MiB / 1.465GiB 45.22% 83.9kB / 162kB 404MB / 75.7MB 3389b44b098d8db frontend 0.39% 89.68MiB / 250MiB 35.87% 59.7kB / 246kB 31.1MB / 0B 11b5420502af2c checkout 0.05% 14.75MiB / 20MiB 73.75% 18.1kB / 43.9kB 58.3MB / 3.65MB 1445d393ad25fc recommendation 2.72% 53.01MiB / 500MiB 10.60% 14kB / 90.5kB 33.1MB / 4.37MB 297b45d2c6c8f9 product-reviews 1.03% 85.61MiB / 100MiB 85.61% 24.4kB / 89.1kB 47.4MB / 4.71MB 293a3db38e8ea9 fraud-detection 1.10% 233.9MiB / 300MiB 77.96% 50.9kB / 99.1kB 93.1MB / 328kB 27[...]
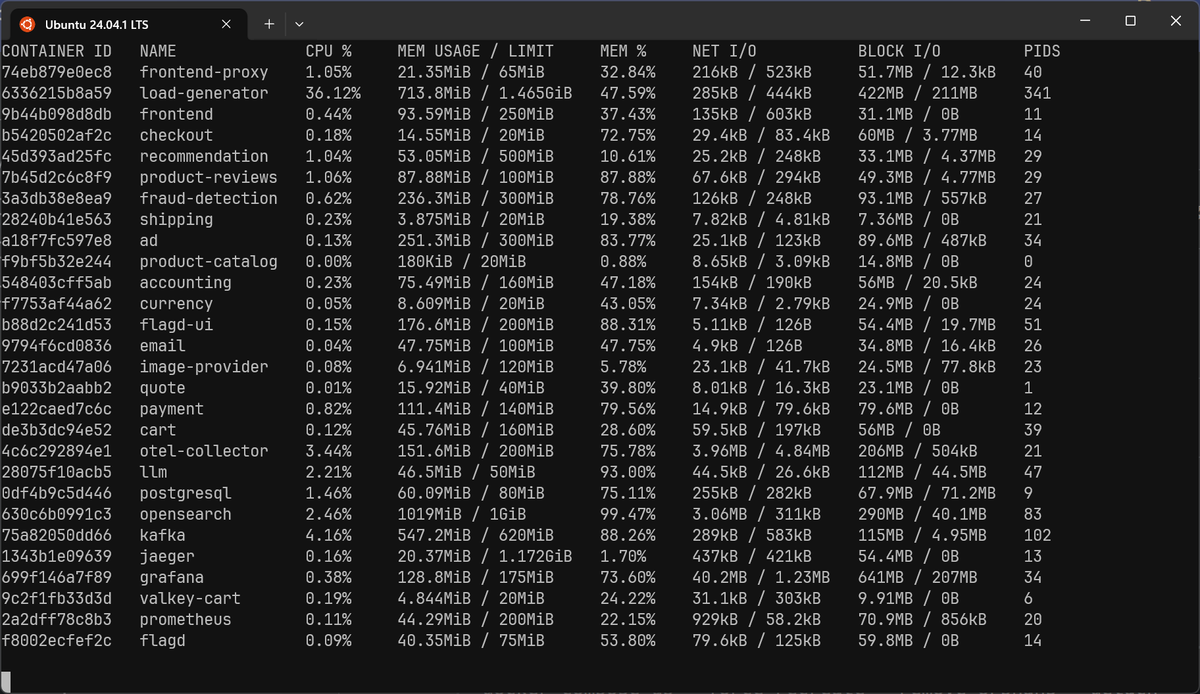
The table refreshes roughly once per second, giving you a live view into how
your containers are behaving right now. Press Ctrl+C to stop the stream and
return to your shell.
If you only care about specific containers, you can pass their names or IDs as arguments to narrow the output:
1docker stats prometheus jaeger
123CONTAINER ID NAME CPU % MEM USAGE / LIMIT MEM % NET I/O BLOCK I/O PIDS2a2dff78c8b3 prometheus 0.00% 47.12MiB / 200MiB 23.56% 1.3MB / 82kB 70.9MB / 1.13MB 20f8002ecfef2c flagd 0.03% 37.08MiB / 75MiB 49.44% 101kB / 171kB 59.8MB / 0B 14
This filters out everything else and only reports metrics for the two named containers, which is useful when you have dozens (or hundreds) of containers running on a single host and need to focus on a particular service.
One-shot snapshots with --no-stream
The default streaming behavior is great for live monitoring in real-time, but
it's less useful when you want to capture a point-in-time snapshot for a script
or a log file. The --no-stream flag tells docker stats to collect the
current metrics once and immediately exit:
1docker stats --no-stream
This produces a single table and returns control to the shell, making it suitable for cron jobs, CI pipelines, or any context where you need a quick sample rather than a continuous feed.
Including stopped containers
By default, docker stats only shows running containers. Stopped containers
won't appear in the output since there are no active processes to measure. If
you want to see all containers regardless of their state, use the --all flag:
1docker stats --all --no-stream
Stopped containers will show up with zeroed-out metrics across the board:
12CONTAINER ID NAME CPU % MEM USAGE / LIMIT MEM % NET I/O BLOCK I/O PIDS14775eed5dc4 otelcol 0.00% 0B / 0B 0.00% 0B / 0B 0B / 0B 0
Customizing the output format
The default table is fine for quick interactive checks, but it often includes
more columns than you need, or you may want the output in a format that's easier
to parse programmatically. The --format flag accepts a Go template string that
lets you control exactly what gets displayed.
The Go template for docker stats supports the following placeholders:
.Containeris the container name or ID (whichever was used in the command)..Nameis the container's name..IDis the container's full ID..CPUPercis the CPU usage percentage..MemUsageis the memory usage and limit..MemPercis the memory usage as a percentage of the limit..NetIOis the cumulative network I/O bytes..BlockIOis the cumulative block I/O bytes..PIDsis the process/thread count.
If you only care about container names, CPU, and memory, you can strip down the output like this:
12docker stats \--format "table {{.Name}}\t{{.CPUPerc}}\t{{.MemUsage}}"
This outputs:
1234567891011NAME CPU % MEM USAGE / LIMITfrontend-proxy 0.95% 21.41MiB / 65MiBload-generator 33.04% 733.9MiB / 1.465GiBfrontend 0.37% 92.53MiB / 250MiBcheckout 0.07% 14.63MiB / 20MiBrecommendation 1.45% 53.14MiB / 500MiBproduct-reviews 1.08% 88.79MiB / 100MiBfraud-detection 0.41% 246.5MiB / 300MiBshipping 0.19% 3.875MiB / 20MiBad 0.13% 259.2MiB / 300MiB[...]
The table keyword at the beginning of the template tells Docker to include
column headers. Without it, you get the raw values only, which is useful when
piping into other tools.
Formatting Docker stats output as JSON
For machine-parseable output, you can wrap everything in a JSON template.
Combining this with --no-stream gives you a clean, single-shot JSON line per
container:
12docker stats --no-stream \--format '{{ json . }}'
This produces output like:
1234567891011{"BlockIO": "51.7MB / 12.3kB","CPUPerc": "1.07%","Container": "74eb879e0ec81ae30e76110f8d0ede8b94b41876bb461c08cb015418fd3ea8f6","ID": "74eb879e0ec8","MemPerc": "32.95%","MemUsage": "21.42MiB / 65MiB","Name": "frontend-proxy","NetIO": "787kB / 1.96MB","PIDs": "40"}
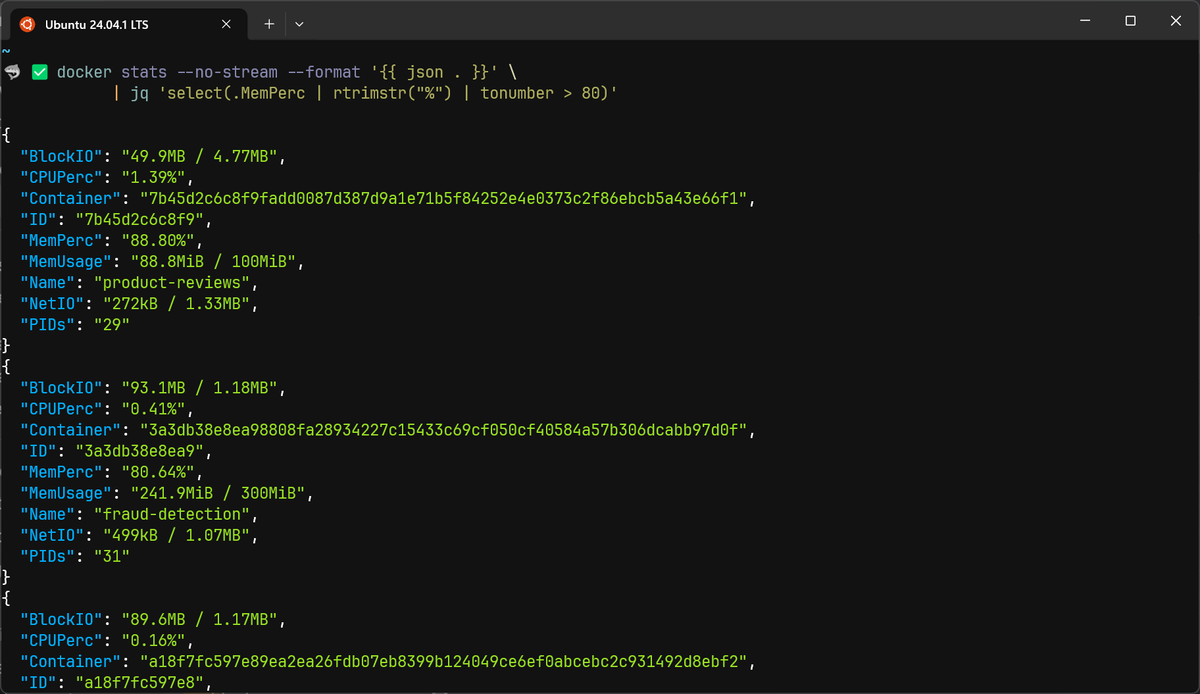
You can pipe this into jq for further filtering or transformation. For
example, to find containers using more than 80% memory:
12docker stats --no-stream --format '{{ json . }}' \| jq 'select(.MemPerc | rtrimstr("%") | tonumber > 80)'
CSV-style output for logging
If you want to append metrics to a log file or import them into a spreadsheet, a comma-separated format works well:
12docker stats --no-stream \--format "{{.Name}},{{.CPUPerc}},{{.MemUsage}},{{.NetIO}}"
Pair this with a timestamp and a loop, and you have a lightweight metrics logger:
12345678#!/bin/bashwhile true; doecho "$(date -Iseconds),$(docker stats --no-stream \--format '{{.Name}},{{.CPUPerc}},{{.MemPerc}}')" >> container_metrics.csvsleep 60done
This script samples all running containers once per minute and appends the results to a CSV file. It isn't a replacement for proper time-series monitoring, but it can be surprisingly useful for quick investigations on a development or staging host.
Understanding each docker stats metric
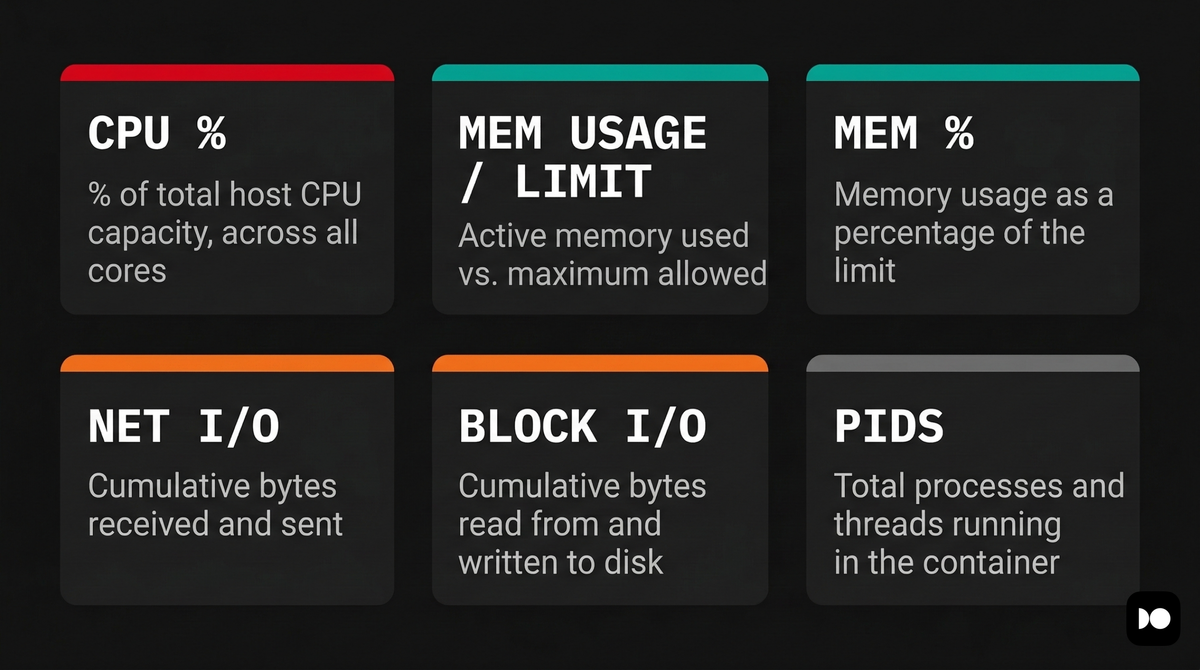
The default output columns may look straightforward at first glance, but several of them involve subtleties that can trip you up if you don't understand how Docker calculates them under the hood. Let's walk through each one.
CPU %
The CPU percentage represents how much of the total host CPU capacity the container is using, not a percentage of a single core. On a machine with 4 CPU cores, a container that is fully saturating two cores will show approximately 200% in this column, not 50%.
Docker computes this value by comparing the container's CPU usage time (in nanoseconds) between two consecutive readings against the total system CPU time elapsed over the same interval. The formula looks roughly like this:
12CPU % = (delta_container_cpu / delta_system_cpu)* number_of_cores * 100
This means that if you've set a CPU limit on a container using --cpus=1, the
CPU percentage can still briefly exceed 100% due to sampling intervals. Docker
measures CPU over a short window (typically 1 to 5 seconds), and small bursts
within that window can produce spikes that slightly exceed the configured cap.
One common point of confusion: --cpu-shares is not a hard cap. It's a
relative weight that only takes effect during CPU contention. A container with
--cpu-shares=1024 on an otherwise idle 8-core host can happily use all 8 cores
and show 800% in docker stats. If you need a strict ceiling, use --cpus or
the equivalent --cpu-quota/--cpu-period flags instead.
MEM USAGE / LIMIT
This column shows two values separated by a slash. The first is the container's
current memory consumption, and the second is the maximum it's allowed to use.
If you didn't set an explicit memory limit with --memory, the limit will
reflect the host machine's total available RAM.
The memory usage figure deserves special attention because it doesn't mean quite
the same thing as what top or ps would report. On Linux, the Docker CLI
subtracts the page cache (also called the filesystem cache) from the raw memory
figure before displaying it.
The rationale is that cached file pages are reclaimable; the kernel can evict them under memory pressure without killing the container's processes. Including them in the reported figure would make it look like the container is consuming more memory than it actually needs, which historically led to confusion and false alarms.
What you're left with after the cache subtraction is similar to the container's Resident Set Size (RSS): the anonymous memory pages that your application has actively allocated for heaps, stacks, and memory-mapped regions.
This is the number that matters most when you're debugging a memory leak, because RSS only grows when your application allocates memory that can't be reclaimed.
If you see the MEM USAGE figure climbing steadily over time without a corresponding increase in workload, that's a strong signal that something in the container is leaking.
MEM %
The memory percentage is the container's current memory usage divided by its memory limit, expressed as a percentage. If no explicit limit is set, this will be the container's usage relative to the host's total RAM, which tends to produce very small percentages that aren't especially useful for alerting purposes.
This metric is most valuable when you've configured memory limits on your containers. A container consistently sitting at 85%+ of its limit is a candidate for either a limit increase or investigation into whether there's a memory leak at the application level.
NET I/O
The network I/O column shows the total number of bytes received and transmitted
by the container's network interface since it started, formatted as
received / sent. These are cumulative counters, not rates, so the numbers only
ever go up for the lifetime of the container.
Docker obtains network metrics by reading the TX and RX counters from the
container's virtual Ethernet (veth) interface. Each container gets its own
network namespace with a veth pair that bridges it to the host network, and
Docker reads the traffic counters for that interface pair.
If you need per-second throughput rates rather than cumulative totals, you'll need to sample the counter at two points in time and compute the delta yourself, or use the Docker Engine API where the raw byte counters can be polled at precise intervals.
BLOCK I/O
Block I/O reports the total bytes read from and written to block devices
(typically disk) by the container, displayed as read / written. Like NET I/O,
these are cumulative counters from the moment the container started.
These numbers reflect I/O operations against actual block devices on the host. They include writes to the container's writable filesystem layer and reads from the underlying image layers, but they typically exclude I/O that is satisfied entirely by the kernel's page cache. If the data a container reads is already cached in memory, the read won't show up as block I/O because no actual disk access occurred.
High block I/O values combined with low CPU percentages often indicate a container that is I/O-bound, perhaps a database waiting on disk reads or a logging process writing heavily to a mounted volume. Conversely, periodic spikes in block I/O might correspond to scheduled tasks like log rotation, database checkpointing, or backup operations.
PIDS
The PIDS column shows the number of processes and kernel threads that the container has created. This is the sum of both, so a multi-threaded application will show a higher number here than you might expect if you're only thinking in terms of OS processes.
If you see a large number in the PIDS column but only a small number of
processes when you run ps or top inside the container, it likely means the
application is spawning many threads.
This is normal for runtimes like the JVM or Go, but an unexpectedly high or rapidly growing PID count can also indicate a fork bomb or a thread leak that warrants investigation.
Using the Docker Engine API directly
The docker stats CLI is a convenient wrapper, but for programmatic monitoring,
the Docker Engine API provides richer, more granular data. The relevant endpoint
is:
1GET /containers/{id}/stats
By default, this endpoint streams JSON objects continuously (one per second). To
get a single snapshot, append ?stream=false to the query string.
You can hit the API using curl over Docker's Unix socket:
123curl -s --unix-socket /var/run/docker.sock \"http://localhost/containers/load-generator/stats?stream=false" \| jq '.memory_stats.usage'
The API response is a large JSON object containing detailed breakdowns for every
metric category. The memory_stats object includes the raw usage, the
limit, and the full stats map from memory.stat. The cpu_stats and
precpu_stats objects give you the raw nanosecond-level CPU counters needed to
compute utilization yourself. The networks object breaks down RX/TX bytes,
packets, errors, and drops per interface.
This level of detail is what tools like cAdvisor, the OpenTelemetry Docker Stats Receiver, and commercial monitoring agents use internally. If you're building custom dashboards or integrations, the API is your best starting point, because it gives you the raw numbers without the CLI's formatting and cache-subtraction logic baked in.
Monitoring stats with a graphical interface
The docker stats CLI is powerful, but staring at a scrolling terminal table
isn't always the most effective way to monitor your containers, especially when
you need to spot trends over time or quickly compare resource usage across a
large number of services.
Several tools provide graphical interfaces on top of the same underlying metrics, ranging from local desktop applications to self-hosted web dashboards you can access remotely.
Terminal UI tools: lazydocker and ctop
Before moving to fully graphical tools, there are two popular terminal UI
applications worth mentioning that sit between raw docker stats and a full
graphical dashboard.
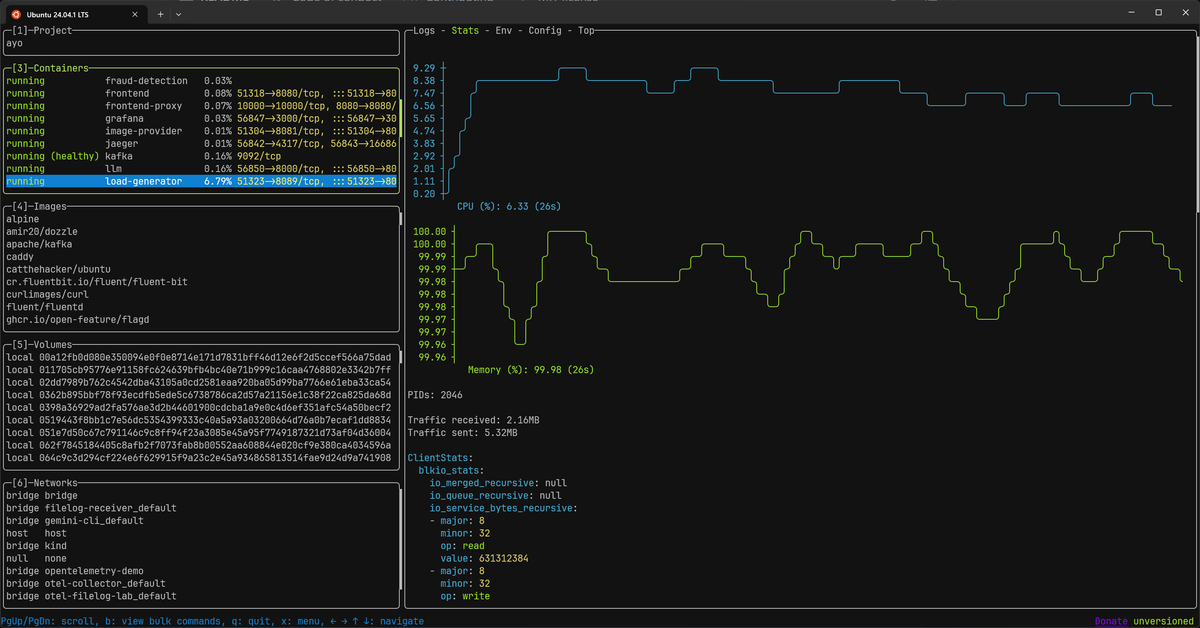
Lazydocker provides a split-pane terminal interface that shows containers, logs, and live resource graphs side by side in a single window. You can navigate with the keyboard or the mouse, inspect environment variables and container configuration, and perform common operations like stopping or restarting containers without switching back to the CLI.
The Stats tab renders ASCII graphs for CPU and memory, and you can customize
which metrics are graphed by editing its configuration file. It's ideal for SSH
sessions where you want a richer view than docker stats but can't run a
browser-based tool.
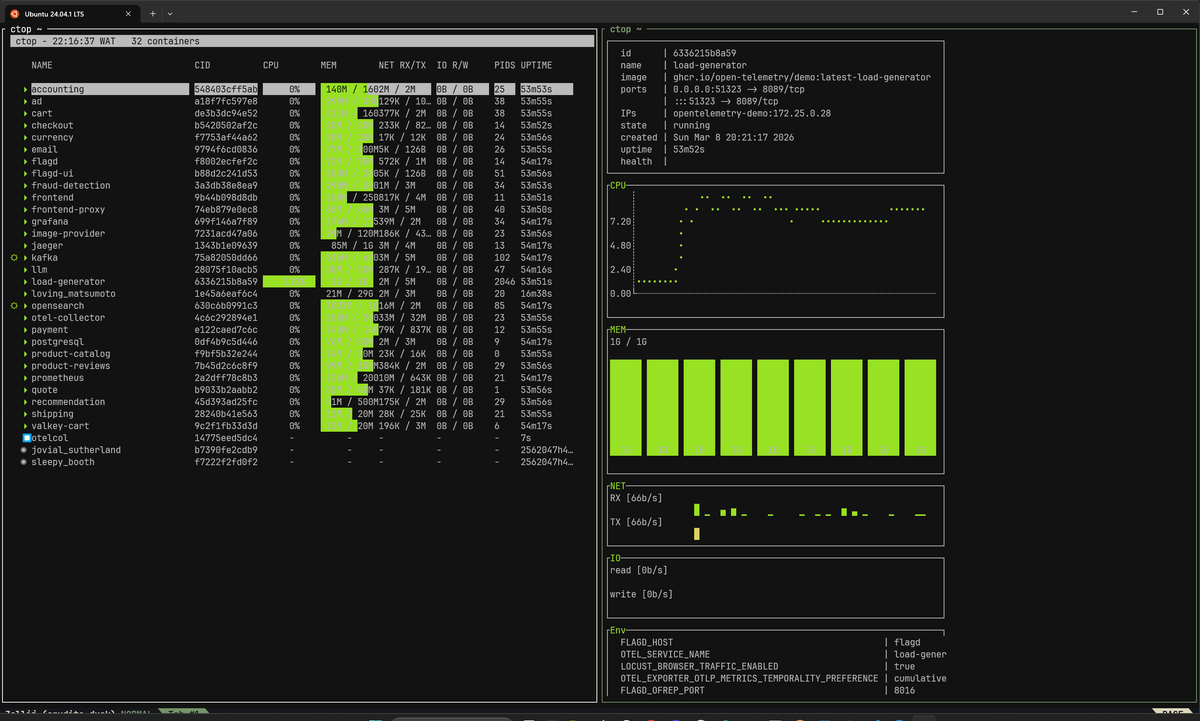
Ctop takes a different approach, modeling
itself after the familiar htop interface but scoped to containers. It displays
a sortable, real-time table of all running containers with CPU, memory, and
network metrics, and you can press Enter on any container to drill into a more
detailed view.
Both tools are excellent for quick, visual monitoring over SSH, but like
docker stats they're scoped to a single host and don't persist historical
data.
Docker Desktop
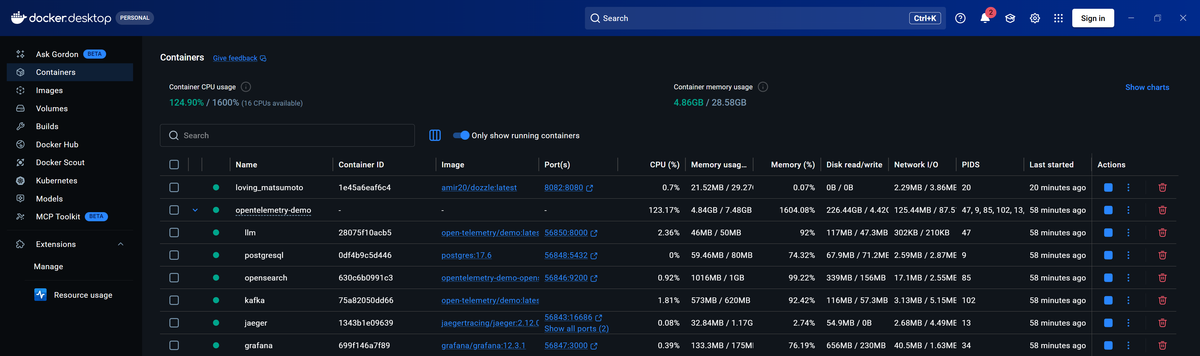
If you're running Docker Desktop, you'll observe that it automatically surfaces container resource metrics without any additional setup in its Containers view (as seen above).
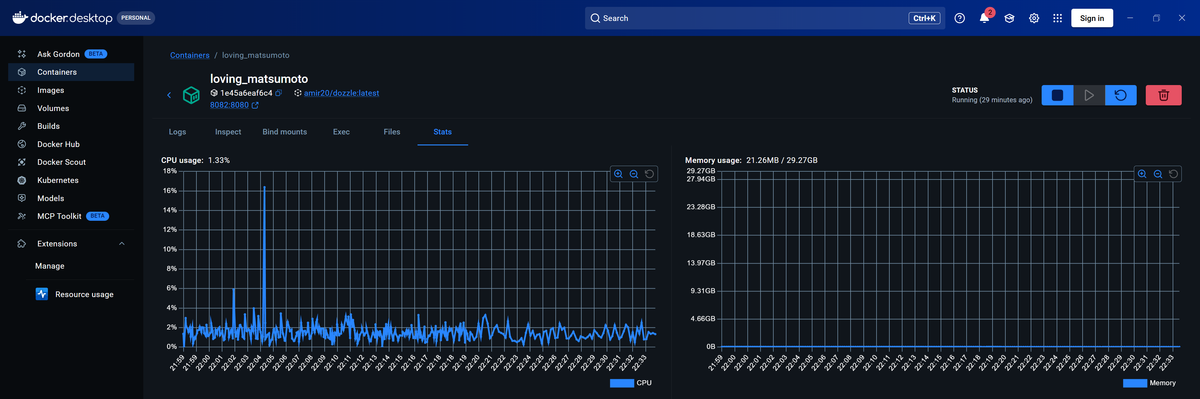
Clicking into an individual container also reveals a Stats tab with live graphs for CPU and memory usage over time:
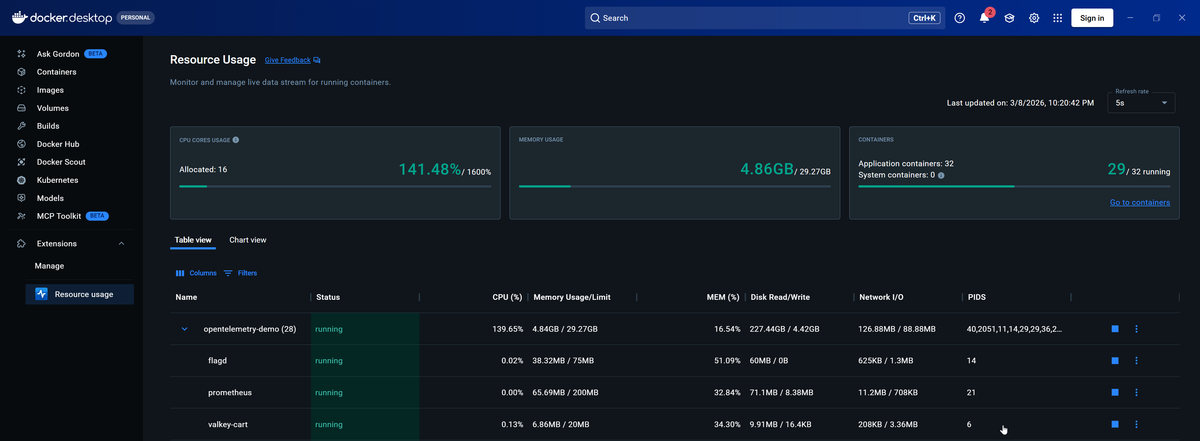
Docker Desktop also supports an Extensions Marketplace, which includes a Resource Usage extension that goes further than the built-in stats view.
The extension compiles data from docker stats into a richer interface where
you can analyze resource consumption grouped by Docker Compose project, sort
containers by the most CPU-intensive or memory-intensive, and apply filters to
narrow your focus. It's a meaningful step up from the raw terminal output while
remaining entirely local.
That said, Docker Desktop is primarily a development tool. It runs on the same machine as your containers, which means it's not a solution for monitoring remote hosts or production servers. For that, you'll need something that exposes a web-based interface accessible over the network.
To see a comprehensive list of Docker container monitoring tools that work across remote and production environments, check out our Docker Container Monitoring Tools article
Monitoring Docker container resource usage in production
docker stats is a fantastic tool for what it does: real-time, zero-setup
container metrics on a single host. But it has clear limitations that you'll hit
as your infrastructure grows.
It's scoped to a single host with no aggregation across machines, it retains no historical data beyond the current streaming view, and it has no built-in alerting or automated remediation.
For production workloads that require any of the above, the path forward is to feed your container metrics into a proper observability platform.
The OpenTelemetry project provides a Docker Stats Receiver as part of the OpenTelemetry Collector Contrib distribution.
This receiver queries the local Docker daemon's container stats API at a configurable interval (defaulting to 10 seconds) and emits standardized metrics for CPU, memory, network, and block I/O usage across all running containers.
Under the hood, it reads the same data that powers docker stats, but it does
so in a structured, pipeline-friendly way that's designed for export to an
observability backend.
Dash0 is one such backend that serves as a natural destination for these metrics. Because Dash0 is OpenTelemetry-native, you can point the Collector's OTLP exporter directly at your Dash0 endpoint and container metrics start flowing in without any intermediate translation layers or proprietary agents.
Once the data lands in Dash0, you'll get everything that docker stats can't
offer on its own: historical retention, PromQL-based querying, dashboards built
on the open-source Perses
standard, and alerting that can notify you through Slack, email, or webhooks
when a container crosses a resource threshold.
The real payoff, though, is correlation. Container resource metrics in isolation tell you what is happening (CPU spiked, memory is climbing), but not why.
With Dash0, your Docker container metrics live alongside your application traces, logs, and other infrastructure signals in the same platform. When a container's memory starts climbing, you can pivot directly to the traces from that service to see which requests are allocating the most memory, or check the logs for OOM warnings that preceded a restart.
That kind of cross-signal investigation is where a dedicated observability platform pays for itself compared to stitching together CLI tools and scripts.
Final thoughts
docker stats occupies a useful niche in the container monitoring landscape:
it's always available, it requires zero configuration, and it provides enough
information to diagnose most common resource issues during development and for
quick triage on production hosts.
Understanding what each metric actually measures, especially the nuances around CPU percentage calculations and memory cache subtraction, will help you avoid misinterpreting the numbers and making incorrect capacity decisions.
For anything beyond single-host, real-time observation, you'll want to layer on
a proper metrics pipeline. But even then, docker stats remains a valuable
first-line tool.
When something goes wrong and you're SSH'd into a host trying to figure out
which container is misbehaving, there's no faster way to get a read on the
situation than typing docker stats and watching the numbers update.
Sign up for a free trial of Dash0 to start monitoring your Docker containers with full historical retention, alerting, and cross-signal correlation.
