Last updated: April 28, 2026
Python Logging Module: A Complete Guide
Once your Python application is running in production, it becomes a black box. You can no longer attach a debugger or inspect variables in real time. Your only insight into what it’s doing comes from the signals it emits: logs, metrics, traces, and other forms of telemetry.
Among these, logs provide the story your application tells about its own behavior. But that story can be told well or poorly. With basic, unstructured logging, it’s often a fragmented stream of text that adds confusion rather than clarity. But with structured logging, it becomes a queryable timeline of events that supports effective debugging and operational insight.
This guide is a practical walkthrough for building a robust logging system in Python. You’ll move beyond print-style statements and learn how to configure loggers using YAML, enrich log records with contextual data, and integrate logging with modern observability practices.
By the end, you’ll have the tools to turn your application from a black box into one that can be clearly observed and understood.
Let’s get started!
Understanding the logging module
Before you can transform your Python logs into a useful observability signal, you must understand the machinery you’re building upon.
Python’s built-in logging module is powerful, but to use it effectively, you must think about its components not as abstract concepts, but as solutions to real-world problems.
Every call to a logging method (like logger.info()) creates a LogRecord object, which flows through a processing pipeline composed of four core components: the Logger, Handler, Formatter, and Filter.
Your entry point into this system is the Logger object, and there is a golden rule for acquiring one: always use logging.getLogger(<name>).
Ignore examples that call level methods on the logging module (like logging.warning(...)) or call getLogger() with no arguments. Both invoke the root logger, which should be avoided in anything beyond simple scripts.
The root logger has no namespace, so its output gets mixed with logs from third-party libraries. This makes it difficult to control log levels for specific parts of your code or trace a log message’s origin.
The correct pattern is to always create a module-specific logger, and the documentation specifically recommends using the special __name__ variable:
1234import logging# In my_app/services/billing.py, __name__ == "my_app.services.billing"logger = logging.getLogger(__name__)
Using __name__ identifies your logger with the module’s fully qualified path, which naturally builds a hierarchical logger namespace. In Python, loggers form a tree where child loggers inherit settings (like level, handlers, and filters) from their parent unless explicitly overridden.
For example, a logger named my_app.services.billing is considered a child of my_app.services, which is a child of my_app. The ultimate ancestor of all loggers is the root logger.
This hierarchy allows you to define general logging policies for the entire application (e.g. my_app), while customizing behavior for specific submodules without relying on the root logger. You’ll see the advantages of this model as we go deeper into this tutorial.
Once you have a Logger object handy, the first decision you’ll make is assigning a severity level to your message.
Controlling the signal-to-noise ratio with log levels
In production, logs have a cost: they consume disk, bandwidth, CPU, and money when ingested into observability platforms. Your goal is to maximize signal while minimizing noise, and log levels are your primary tool for this.
When you call methods like logger.info() or logger.warning(), you’re creating a LogRecord and assigning a severity level to it. The logger processes the record only if its level is equal to or higher than the logger’s configured level.
The standard levels in order of increasing severity are:
| Level | Numeric Value | Description |
|---|---|---|
| NOTSET | 0 | Special: inherit from parent logger |
| DEBUG | 10 | Detailed diagnostic information |
| INFO | 20 | Normal application events |
| WARNING | 30 | Potential problems |
| ERROR | 40 | Failed operations |
| CRITICAL | 50 | Severe failures |
Each level has an associated numeric value that determines its priority. The lower the number, the less severe the message. Python uses these numeric values internally to decide whether a given log record should be processed.
NOTSET is a special level that causes a logger to inherit its parent’s level in the hierarchy all the way to the root logger, which defaults to WARNING. Every other level has a corresponding method on the logger:
12345logger.debug("a debug message")logger.info("an info message")logger.warning("a warning message")logger.error("a error message")logger.critical("a crit message")
When you set a logger’s level, you’re setting a numeric threshold where only records at that level or higher will be processed. For example, a logger set to WARNING (30) ignores DEBUG and INFO records, but allows WARNING, ERROR, and CRITICAL:
1234import logginglogger = logging.getLogger(__name__)logger.setLevel(logging.WARNING) # The default is NOTSET
Now that you understand severity levels, the next question is: where do these logs go? That brings us to Handlers.
Handlers define the destination
Handlers are responsible for dispatching LogRecord objects to their final destination. They determine where your logs go.
A key feature of the logging module is that a single logger can have multiple handlers attached, allowing you to simultaneously send the same log record to different places if you wish to.
Examining the default behavior
If no handler is explicitly configured on a logger, Python will check if the logger’s ancestors have any handlers (up to the root logger).
If no handlers are found on any ancestor, Python creates an implicit last-resort fallback handler attached to sys.stderr which always logs at the WARNING level.
You’ll see a very basic output. No level, no logger name, no timestamps — just the message text itself:
123a warning messagea error messagea crit message
This default behavior exists to ensure you see some log output even if you forget to configure logging.
For application developers, it's crucial to always configure your own handlers explicitly to avoid this behavior. Here are the most useful ones you should know about:
StreamHandler
This StreamHandler sends logs to a stream, such as sys.stdout or sys.stderr. This is aligned with the Twelve-Factor App methodology which dictates that an application should not concern itself with log file routing or storage. Instead, it should write its log stream to standard output and let the execution environment take over.
This pattern is standard in containerized environments like Docker and Kubernetes, where the container orchestrator automatically captures and forwards these streams. Likewise, on Linux VMs, Systemd captures all output from a service and directs it to the system journal, making it centrally accessible via journalctl.
123stream_handler = logging.StreamHandler(stream=sys.stdout)logger.addHandler(stream_handler)
FileHandler and its subclasses
If you manage your own servers or virtual machines, you may still write logs to files directly. The FileHandler helps you persist logs to the filesystem:
123file_handler = logging.FileHandler("app.log")logger.addHandler(file_handler)
To avoid unbounded log file growth, you can use rotation mechanisms provided by RotatingFileHandler or TimedRotatingFileHandler. You can also reach for logrotate, the standard Linux utility for log file rotation.
QueueHandler and QueueListener
The QueueHandler and QueueListener provide a powerful pattern for asynchronous, non-blocking logging in Python. This is crucial for high-performance applications, as it prevents slow I/O operations (like sending a log over the network) from delaying your main application thread.
It works by attaching a QueueHandler to your loggers. Instead of processing the log record itself, its only job is to quickly place the record onto a queue.Queue, which is a fast, in-memory operation.
The QueueListener runs in a separate background thread and continuously monitors the queue for new log records. When it finds one, it removes it from the queue and passes it to one or more "downstream" handlers for actual processing.
This decouples the creation of a log record from the work of processing and outputting it, making your application more responsive.
12345678910111213141516171819202122232425import loggingimport logging.handlersimport queue# 1. Create the queue that will be shared between the handler and listener.log_queue = queue.Queue(-1) # -1 for an infinite size queue# 2. Configure the downstream handlers.console_handler = logging.StreamHandler()# 3. Create and start the QueueListener.listener = logging.handlers.QueueListener(log_queue, console_handler)listener.start()queue_handler = logging.handlers.QueueHandler(log_queue)# 4. Configure the logger to use the QueueHandler alonelogger = logging.getLogger(__name__)logger.addHandler(queue_handler)# [...] your logging calls# 5. Stop the listener before the application is shuts down.# This ensures all buffered logs are processed.listener.stop()
Other notable handlers
SysLogHandlercan forward logs to a local or remote syslog server.HTTPHandlercan POST logs to remote HTTP endpoints.NullHandleracts as a “do-nothing” placeholder which is useful for library authors.MemoryHandlerbuffers logs in memory and only flushes them to a target handler when triggered (e.g. when anERRORis logged). This creates a rolling buffer of debug context around failures without polluting the logs during normal operation.
A quick note on handler levels
Each configured handler can have its own level that is independent of the logger’s level. Both levels work together to control what gets emitted:
- The logger’s level is the first filter. If a log record’s level is lower than the logger’s level, it is never passed to any handlers.
- The handler’s level applies second. If a handler receives a log record, it will only process it if the record’s level meets or exceeds the handler’s level.
Here’s an example:
12345678910logger.setLevel(logging.DEBUG)console_handler = logging.StreamHandler()console_handler.setLevel(logging.INFO)file_handler = logging.FileHandler("errors.log")file_handler.setLevel(logging.ERROR)logger.addHandler(console_handler)logger.addHandler(file_handler)
In this setup:
- All records
DEBUGand above are created. - The
console_handleronly processesINFO,WARNING,ERROR, andCRITICALrecords. - The
file_handleronly receivesERRORandCRITICAL.
With destinations now defined via handlers, and filtering controlled by levels, the next piece of the puzzle is how your logs are formatted. This brings us to Formatters.
Formatters define the output (and why it should be JSON)
A formatter takes the LogRecord object and serializes it into its final output format. While Python’s logging.Formatter produces simple, human-readable strings by default, modern observability practices favor structured formats like JSON, which are easier to parse, query, and correlate in log management platforms.
To implement JSON logging, you can either follow the official structured logging guide, or use a drop-in library python-json-logger as follows:
1pip install python-json-logger
12345678910111213import loggingfrom pythonjsonlogger import jsonloggerlogger = logging.getLogger(__name__)logger.setLevel(logging.INFO)handler = logging.StreamHandler()formatter = jsonlogger.JsonFormatter("%(asctime)s %(name)s %(levelname)s %(message)s")handler.setFormatter(formatter)logger.addHandler(handler)logger.info("an info message")
This produces structured JSON output like:
123456{"asctime": "2025-06-18 13:53:24,986","name": "__main__","levelname": "INFO","message": "an info message"}
To customize the output, you can reference any valid LogRecord attributes in the format string. You can also use a denylist of attributes like this:
12formatter = jsonlogger.JsonFormatter(reserved_attrs=["pathname", "funcName"])# formatter = jsonlogger.JsonFormatter(reserved_attrs=[]) # allow all attributes
This yields:
12345678910111213141516171819202122{"message": "an info message","name": "__main__","msg": "an info message","args": [],"levelname": "INFO","levelno": 20,"filename": "main.py","module": "main","exc_info": null,"exc_text": null,"stack_info": null,"lineno": 14,"created": 1750251363.462218,"msecs": 462.0,"relativeCreated": 21.619407,"thread": 140003799217984,"threadName": "MainThread","processName": "MainProcess","process": 59903,"taskName": null}
Another useful customization is using rename_fields to map default field names to your own schema:
1234formatter = jsonlogger.JsonFormatter("%(asctime)s %(name)s %(levelname)s %(message)s",rename_fields={"levelname": "level", "asctime": "time"},)
This renames the levelname and asctime fields:
123456{"time": "2025-06-18 14:06:40,333","name": "__main__","level": "INFO","message": "an info message"}
Now that you’ve seen how formatters shape the final output of a log message, there’s one more component that completes the logging pipeline: Filters.
Filters are for dynamic control and log enrichment
A filter is a powerful object that you can attach to a logger or a handler to provide fine-grained control over which log records are processed, and to optionally enrich them with additional attributes.
Before a log record reaches a handler, any filters attached to the logger and the handler are applied. Each filter can accept or reject the record. If any filter rejects it, the record is silently dropped either globally or just for that specific handler.
In production, filters are typically used for two purposes:
- Reducing noise and cost by suppressing high-volume, low-value logs.
- Injecting dynamic context into log records before they’re formatted.
1. Filtering logs at the source
The most common use case for a filter is to suppress unnecessary logs from known noisy paths. For example, to ignore logs containing /health you can use:
123456789101112131415import loggingclass NoHealthChecksFilter(logging.Filter):def filter(self, record: logging.LogRecord) -> bool:return "/health" not in record.getMessage()logger = logging.getLogger("app")logger.setLevel(logging.DEBUG)handler = logging.StreamHandler()handler.addFilter(NoHealthChecksFilter())logger.addHandler(handler)logger.info("GET /api request succeeded") # allowedlogger.info("GET /health request succeeded") # dropped
When attached to a handler (as above), this filter only affects that destination. To filter logs globally, attach it to the logger instead:
1logger.addFilter(NoHealthChecksFilter())
2. Enriching logs with context
Filters can also mutate log records in-place. Since they have access to the full LogRecord, they can inject dynamic context (like request IDs, user info, or trace IDs) before the formatter runs:
1234class ContextFilter(logging.Filter):def filter(self, record):record.log_id = str(uuid.uuid4()) # inject a unique IDreturn True # don't drop the record
You’ll see some more interesting examples of this in action later in this article.
Centralizing logging configuration with the dictConfig pattern
You’ve now seen the core components of the logging module: Loggers to create log records, Handlers to set the destination, Formatters to define the structure, and Filters for log filtering and enrichment.
So far, we’ve wired these together using logger.addHandler() and similar calls. But the best practice is to centralize your logging configuration with Python’s built-in logging.config.dictConfig() function. It accepts a dictionary (typically loaded from a YAML file) and configures the entire logging system declaratively.
Here’s an example config.yaml:
config.yaml1234567891011121314151617181920212223242526version: 1disable_existing_loggers: Falseformatters:json_formatter:(): pythonjsonlogger.jsonlogger.JsonFormatterformat: "%(asctime)s %(name)s %(levelname)s %(message)s"rename_fields:levelname: levelasctime: timehandlers:console:class: logging.StreamHandlerformatter: json_formatterlevel: INFOloggers:my_app:handlers: [console]level: DEBUGpropagate: Falseroot:handlers: [console]level: WARNING
In your application’s entry point, you can load and apply this configuration. Note that PyYAML and python-json-logger must be installed for this to work:
my_app/__init__.py1234567891011121314import loggingimport logging.configimport yamlwith open("config.yaml", "r") as f:config = yaml.safe_load(f.read())logging.config.dictConfig(config)# Now, any module where __name__ starts with `my_app` will use the config.logger = logging.getLogger(__name__)logger.debug("This is a debug message.") # will be dropped due to `console` handler levellogger.info("Application starting up with configuration from YAML.")logger.warning("This is a warning.")
This approach makes it easy to swap configs between environments (e.g. config.dev.yaml, config.prod.yaml) based on an environment variable or CLI flag.
The propagate: False setting helps prevent duplicate logs. By default, after a logger handles a log record, it propagates the record up to its parent logger. This continues up the hierarchy until it reaches the root logger.
Setting propagate: False stops this chain reaction. It tells the my_app logger: "You've handled this log. Do not pass it to any ancestor loggers." This ensures each log message is processed exactly once.
With a decoupled logging configuration in place, the mechanics are solved. Next, we’ll focus on enriching the content of your logs by injecting rich contextual attributes.
Adding contextual attributes to Python logs
In production, applications handle many requests concurrently, resulting in interleaved logs that are hard to make sense of without additional structure.
For example, a log like:
123456{"time": "2025-06-18 14:06:40,333","name": "my_app","level": "INFO","message": "Failed to update record in database"}
tells you almost nothing about what happened. You’re left wondering: Which record? Which request? What led to this?
To make your logs a useful signal for observability, they must be rich, structured events containing enough detail to answer operational questions.
This is the goal of contextual logging: enriching every log message with consistent metadata relevant to the current operation.
The simplest way to add context is with the extra parameter. Just ensure your keys don’t clash with built-in LogRecord attributes:
123logger.info("Updating user profile", extra={"user_id": "usr-1234"})
This produces:
output1234567{"time": "2025-06-18 15:43:21,304","name": "__main__","level": "INFO","message": "Updating user profile","user_id": "usr-1234"}
Using the extra parameter is fine for including a one-off attribute in a specific log message. But when an attribute needs to appear consistently across many log statements, passing extra manually would be very tedious.
A more powerful approach is to use a custom filter to inject context automatically into every log record. This keeps your log calls clean while ensuring that every message is enriched with the right metadata.
You can build this up in two stages: first by adding static, global context, and then by adding dynamic, per-request context. Let’s start with the global case.
1. Adding global context
A filter can be used to attach application-wide properties, like the hostname and process ID, to all logs. This establishes a consistent baseline of context for all log messages.
Suppose you have a log_context.py module with the following filter:
log_context.py1234567891011121314import loggingimport socketimport osclass ContextFilter(logging.Filter):def __init__(self, name=''):super().__init__(name)self.hostname = socket.gethostname()self.process_id = os.getpid()def filter(self, record):record.hostname = self.hostnamerecord.process_id = self.process_idreturn True
You can then register and attach this filter in your YAML configuration as follows:
config.yaml1234567891011121314151617version: 1disable_existing_loggers: falsefilters:add_context: # register the filter(): log_context.ContextFilter # The path to your filter class# [...]handlers:console:class: logging.StreamHandlerformatter: json_formatterlevel: INFOfilters: [add_context] # add the filter to the handler# [...]
With this setup, every log record sent to the console handler will include hostname and process_id, regardless of where the log call originated:
12345678{"time": "2025-06-18 15:59:38,780","name": "__main__","level": "INFO","message": "An info message","process_id": 64411,"hostname": "Falcon"}
This kind of global context is simple to implement and immediately improves the quality and traceability of logs in distributed environments. In an OpenTelemetry setup, you should use Resource Attributes to tag telemetry data with service-specific metadata, so you can pinpoint application issues down to a specific host, container, or Kubernetes deployment.

2. Adding dynamic, per-request context
To add context that changes with each request (like a request_id), you can enhance the filter using Python’s contextvars.
This module allows you to store data that is safely isolated to the current execution context, and avoids leakage across concurrent or asynchronous tasks.
Here’s an enhanced log_context.py that supports both global and dynamic context:
log_context.py1234567891011121314151617181920212223242526272829303132333435363738import loggingimport socketimport osimport contextvarsfrom contextlib import contextmanager_log_context = contextvars.ContextVar("log_context", default={})class ContextFilter(logging.Filter):def __init__(self, name=""):super().__init__(name)self.hostname = socket.gethostname()self.process_id = os.getpid()def filter(self, record):record.hostname = self.hostnamerecord.process_id = self.process_idcontext = _log_context.get()for key, value in context.items():setattr(record, key, value)return True@contextmanagerdef add_to_log_context(**kwargs):current_context = _log_context.get()new_context = {**current_context, **kwargs}# Set the new context and get the token for restorationtoken = _log_context.set(new_context)try:yieldfinally:_log_context.reset(token)
This pattern provides a clean and powerful way to automatically enrich log records. The ContextFilter injects both static, app-wide fields and dynamic, per-request context into every log message. The dynamic context is managed by a ContextVar, which safely tracks per-request data even in asynchronous or multithreaded code.
The add_to_log_context helper lets you temporarily add context inside a with block. It guarantees cleanup after the block exits, ensuring your logs remain consistent and isolated per request.
In your application code, you can use it like this:
main.py1234567891011121314151617181920212223# [...]from log_filters import log_context, add_to_log_contextfrom fastapi import FastAPI, Request# [...]app = FastAPI()@app.middleware("http")async def add_request_context(request: Request, call_next):request_id = request.headers.get("X-Request-ID", str(uuid.uuid4()))with add_to_log_context(request_id=request_id):response = await call_next(request)return response@app.get("/users/{user_id}")async def get_user(user_id: str):with add_to_log_context(user_id=user_id):logger.info("User profile request received.")return {"user_id": user_id}
This creates a layered logging context:
- The middleware adds a request_id that applies to the entire request lifecycle.
- The route handler adds user_id, scoped to that endpoint’s execution.
Any log message inside those blocks automatically includes both layers of context.
1curl http://127.0.0.1:8000/users/1234
12345678910{"asctime": "2025-06-19 11:45:33,360","name": "main","levelname": "INFO","message": "User profile request received.","hostname": "Falcon","process_id": 4362,"request_id": "e36d6a48-5098-4bca-a610-c33e62342a9d","user_id": "1234"}
With a system for enriching our logs with both static and dynamic context, you now have an enriched view of our application’s happy path.
Next, we’ll make sure errors are captured just as richly with full exception context and surrounding debug information, giving you a complete “black box recording” for any failure.
Logging Python errors and exceptions
The goal of exception logging isn’t just to note that an error occurred — it’s to capture enough context to understand why it happened. That includes the full stack trace as well as any structured context you’ve already added.
Handled exceptions
When you anticipate an error and catch it with a try...except block, you’re dealing with a handled exception. The best practice in these cases is to use logger.exception() inside the except block:
1234try:risky_operation()except Exception:logger.exception("An unexpected error occurred")
The logger.exception() method automatically logs:
- The exception type and message
- The full traceback (via
exc_info) - At the
ERRORlevel by default.
123456789{"time": "2025-06-19 12:13:52,544","name": "__main__","level": "ERROR","message": "an unexpected error occurred","exc_info": "Traceback (most recent call last):\n File \"/home/dash0/demo/python-logging/main.py\", line 21, in <module>\n 1 / 0\n ~~^~~\nZeroDivisionError: division by zero","hostname": "Falcon","process_id": 6158}
If you want to log the exception at a different level (such as CRITICAL), you can use the level method and explicitly pass exc_info=True:
1logger.critical("an unexpected error occurred", exc_info=True)
Uncaught exceptions
An unhandled exception is one that escapes all try...except blocks and causes the application to crash. These are critical events, and logging them is essential for post-mortem debugging.
You can achieve this by setting a custom hook for sys.excepthook, which Python calls right before the program terminates due to an unhandled exception:
123456789import sysdef handle_uncaught_exception(exc_type, exc_value, exc_traceback):logger.critical("uncaught exception, application will terminate.",exc_info=(exc_type, exc_value, exc_traceback),)sys.excepthook = handle_uncaught_exception
This setup ensures that any uncaught exceptions are logged at the CRITICAL level before the process exits.
Structuring Python tracebacks
In the exception logs above, you'll notice that the Python traceback is embedded as a single, multi-line string even with JSON logging enabled. To add some structure here, you can create a custom formatter subclass that overrides how exceptions are handled:
custom_formatter.py1234567891011121314151617import tracebackfrom pythonjsonlogger import jsonloggerclass StructuredExceptionJsonFormatter(jsonlogger.JsonFormatter):def add_fields(self, log_record, record, message_dict):super().add_fields(log_record, record, message_dict)if record.exc_info:exc_type, exc_value, exc_traceback = record.exc_infolog_record['exception'] = {'exc_type': exc_type.__name__,'exc_value': str(exc_value),'traceback': traceback.format_exception(exc_type, exc_value, exc_traceback)}log_record.pop('exc_info', None)log_record.pop('exc_text', None)
Then configure it as follows:
config.yaml12345# [...]formatters:json_formatter:(): custom_formatter.StructuredExceptionJsonFormatter# [...]
You'll see the following output now:
output1234567891011121314151617{"time": "2025-07-02 10:33:21,464","name": "my_app","level": "ERROR","message": "An unexpected error occurred","hostname": "Falcon","process_id": 81849,"exception": {"exc_type": "NameError","exc_value": "name 'risky_operation' is not defined","traceback": ["Traceback (most recent call last):\n"," File \"/home/ayo/dev/dash0/demo/python-logging/main.py\", line 102, in <module>\n risky_operation()\n ^^^^^^^^^^^^^^^\n","NameError: name 'risky_operation' is not defined\n"]}}
If you'd like a fully serialized Python traceback, you can checkout an alternative library called Structlog which provides a fully structured exception key that looks like this:
1234567891011121314151617181920{"exception": [{"exc_type": "NameError","exc_value": "name 'risky_operation' is not defined","exc_notes": [],"syntax_error": null,"is_cause": false,"frames": [{"filename": "/home/ayo/dev/dash0/python-logging/main.py","lineno": 14,"name": "<module>"}],"is_group": false,"exceptions": []}]}
Setting up request and error logging
In web APIs, logs that capture the request lifecycle provide the foundation for troubleshooting. A standard pattern, known as request logging or “access logging”, records two events:
- When the request is received, capturing the intent.
- When the response is sent, capturing the outcome and duration.
This creates a clear audit trail for every transaction. When combined with contextual logging, it becomes a powerful observability tool.
To demonstrate this, let’s implement request and error logging in a FastAPI application:
123456789101112131415161718192021222324252627282930313233343536373839404142@app.middleware("http")async def request_logging_middleware(request: Request, call_next):request_id = request.headers.get("X-Request-ID", str(uuid.uuid4()))request.state.request_id = request_idwith add_to_log_context(request_id=request_id):client_ip = request.headers.get("X-Forwarded-For") or request.client.hostlogger.info("incoming %s request to %s",request.method,request.url.path,extra={"method": request.method,"path": request.url.path,"client_ip": client_ip,"user_agent": request.headers.get("user-agent"),},)start_time = time.monotonic()response = await call_next(request)duration_ms = (time.monotonic() - start_time) * 1000log_level = logging.INFOif response.status_code >= 500:log_level = logging.ERRORelif response.status_code >= 400:log_level = logging.WARNINGlogger.log(log_level,"%s request to %s completed with status %s",request.method,request.url.path,response.status_code,extra={"status_code": response.status_code,"duration_ms": duration_ms,},)return response
This middleware logs an entry message as soon as the request is received, then logs the outcome after the response is generated. The log level is dynamically chosen based on the status code to reflect the severity of the outcome.
FastAPI’s HTTPException is handled automatically by this setup since it produces proper HTTP responses with appropriate status codes, which are reflected in the final log message.
If you’re using this pattern, you’ll likely want to disable FastAPI’s default access logs to avoid redundancy:
123456uvicorn.run("main:app",host="0.0.0.0",port=8000,access_log=False, # disable access logs)
Assuming you have the following route:
1234567891011users = {"abc": "John Doe"}@app.get("/users/{user_id}")async def get_user(user_id: str):with add_to_log_context(user_id=user_id):logger.info("user profile request received.")if user_id not in users:raise HTTPException(status_code=404, detail="user not found")return {"name": users[user_id]}
You’ll see the following logs for each request:
12{"time": "[...]", "message": "incoming GET request to /users/abc", "method": "GET", ...}{"time": "[...]", "message": "GET request to /users/abc completed with status 200", "status_code": 200, ...}
To handle other kinds of exceptions, you’ll need to create an exception handler and add your logging there:
123456789@app.exception_handler(Exception)async def unhandled_exception_handler(request: Request, exc: Exception):request_id = getattr(request.state, "request_id", "")logger.exception("unhandled exception during request processing",extra={"request_id": request_id})return JSONResponse(status_code=500,content={"detail": "An internal server error occurred."},)
With structured logs, dynamic context, and robust error tracking in place, your application is now emitting high-quality logs.
Centralizing your Python logs
Once your Python application is producing structured and well-contextualized logs, the final step is to move them from isolated files or console streams into a centralized observability platform.
Centralizing your logs transforms them from a simple diagnostic record into a powerful, queryable dataset that can be searched, filtered, and analyzed at scale.
More importantly, it allows you to unlock a unified view of your system’s behavior by correlating logs with other telemetry signals like traces and metrics.
A modern observability platform like Dash0 is designed to ingest structured logs and automatically link them with distributed traces via shared correlation IDs.
If you’re already using OpenTelemetry in your application, this integration becomes even more streamlined. This guide on instrumenting Python applications with OpenTelemetry provides a practical walkthrough.
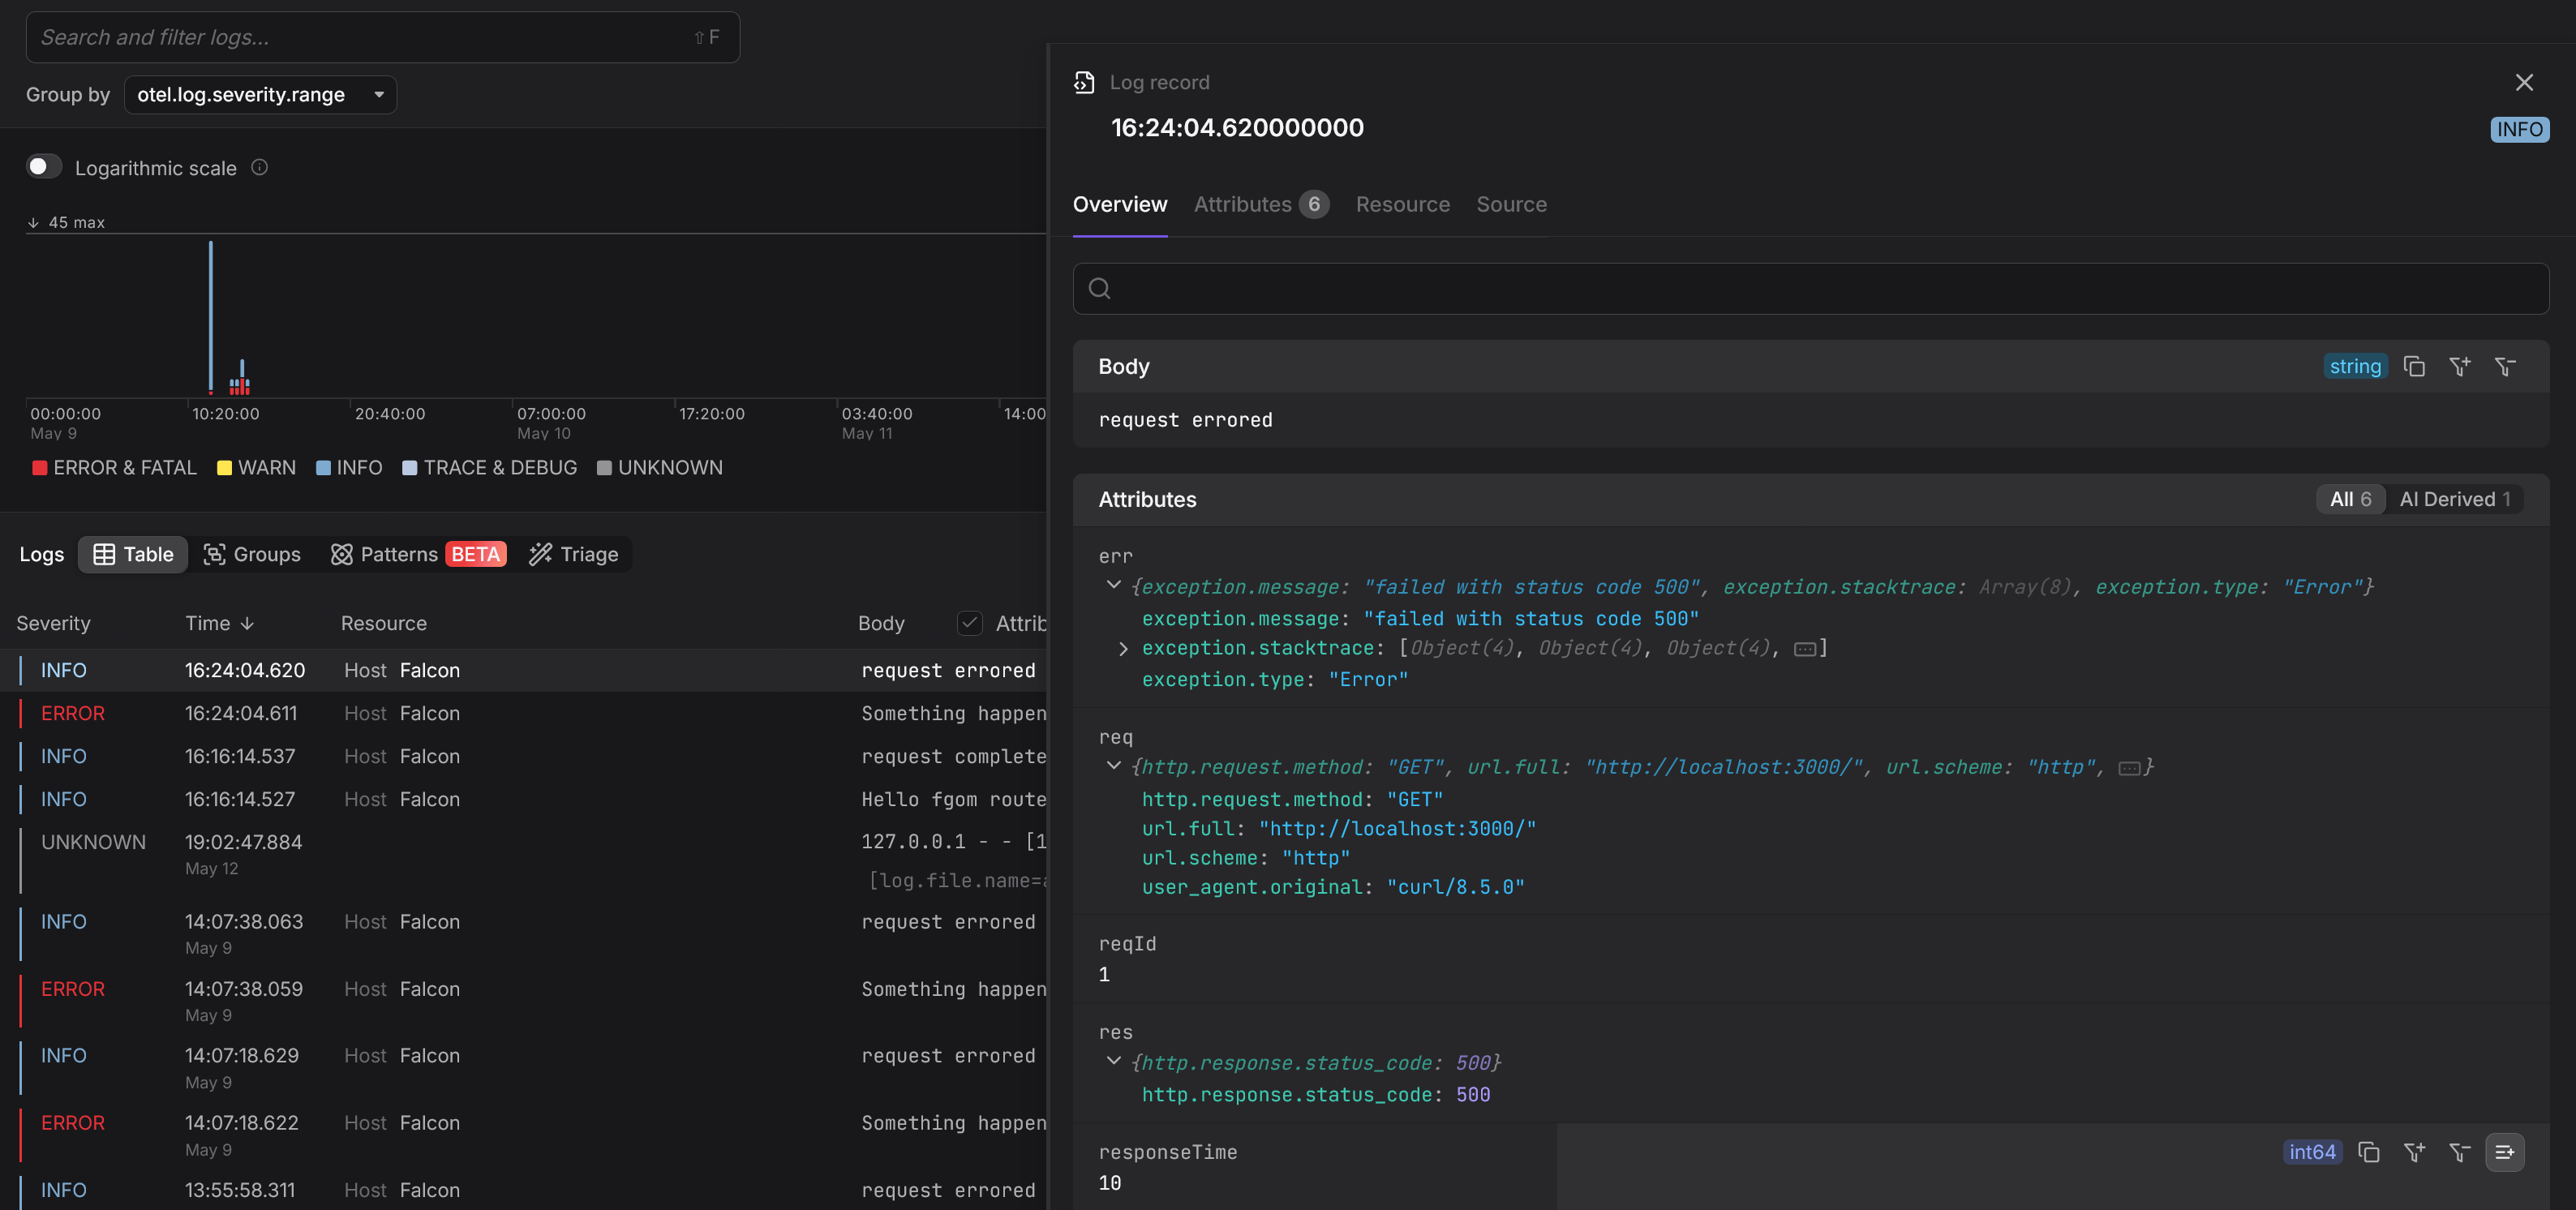
Once integrated, your application’s logs will appear alongside traces and metrics in a unified interface, giving you full visibility into every request, across every service.
Final thoughts
Effective logging is more than just printing messages. It’s about building a structured, queryable record of everything your application does.
By combining Python’s built-in logging module with modern practices like JSON formatting, contextual enrichment, error tracking, and centralized aggregation, you’ve laid the foundation for making your logs actually useful for debugging issues.
Whether you’re debugging a failed request, tracking down performance issues, or analyzing trends across services, these high-quality logs are designed to turn questions into answers.
And with tools like OpenTelemetry, you can connect these detailed logs to distributed traces for rapid and effective root cause analysis across your entire system.
Don’t forget to check out the logging documentation and cookbook for a deeper understanding of the module’s API and a wealth of practical recipes for solving other real-world challenges.
Thanks for reading!
