Last updated: October 9, 2026
Using Claude Code Logs to Debug AI Coding Sessions
Claude Code produces several types of logs that serve different purposes. Depending on what you're investigating, you might need to inspect a session transcript, diagnose a failure using debug logs, recover a previous conversation, or collect activity records for auditing.
These records are stored and managed differently, so knowing where to look can save you a lot of time. Claude Code currently maintains five types of records:
- Session transcripts record your conversations and Claude's actions.
- Debug logs help you diagnose problems with Claude Code itself.
- MCP server logs help you troubleshoot integrations with external tools.
- Prompt history lets you revisit prompts from previous sessions.
- OpenTelemetry logs provide structured activity events for centralized monitoring, auditing, and debugging.
This guide explains where to find each type of log, how to access and interpret it, whether it's enabled by default, and how long it's retained.
The five places Claude Code records activity
Claude Code stores activity in five different places, each with its own purpose, storage location, and retention rules. The table below summarizes what each record contains and where you can find it.
| Record | What it records | On by default | Retention |
|---|---|---|---|
| Session transcripts | Conversations, tool calls, and their results | Yes | 30 days |
| Prompt history | Prompts entered across projects | Yes | No automatic cleanup |
| Debug logs | Internal diagnostics and errors | No | 30 days |
| MCP server logs | Server connections and tool call activity | Yes | Separate from transcript cleanup |
| OTel log events | Structured activity for monitoring and auditing | No | Set by your backend |
The records are stored in the following locations:
- Session transcripts:
~/.claude/projects/<project>/<session-id>.jsonl. These contain the full conversation, including potentially sensitive data read by tools, in plaintext. Retention is controlled bycleanupPeriodDays, which defaults to 30 days. - Prompt history:
~/.claude/history.jsonl. Each entry contains a prompt, timestamp, and project path. Claude Code doesn't automatically clean up this file. - Debug logs:
~/.claude/debug/<session-id>.txt. These capture internal diagnostics, including MCP server startup output, and are deleted after 30 days. - MCP server logs: On Linux, these live under
~/.cache/claude-cli-nodejs/<project>/mcp-logs-<server>/. They record connection status, tool call activity, and errors, potentially including sensitive details. Their retention isn't controlled bycleanupPeriodDays. - OTel log events: These are exported to your configured observability backend, which determines how long they're retained. Identity attributes are included by default, while content collection requires explicit configuration.
On Windows, the ~/.claude/ directory corresponds to %USERPROFILE%\.claude\.
If Claude Code runs in a container or under another user account, these files
are stored relative to that user's home directory. You can also change the
configuration directory using CLAUDE_CONFIG_DIR.
MCP server logs are stored separately and use different paths on macOS and Windows, as explained in the MCP server logs section.
For detailed investigations, session transcripts provide the most complete record of what Claude did. However, Anthropic considers the underlying JSONL format internal and subject to change, so building integrations that parse these files directly can be fragile.
If you need to collect activity across users or analyze it over time, OTel events are generally a better choice. They provide a documented integration interface, support correlation across sessions, and exclude prompt and response content by default.
Finding and reading Claude Code session transcripts
Claude Code saves your conversations as JSON Lines (JSONL) files, recording prompts, responses, tool calls, and their results as you work. These transcripts are useful when you need to reconstruct a session, review what Claude changed, or recover a conversation you previously closed.
Where session transcripts are stored
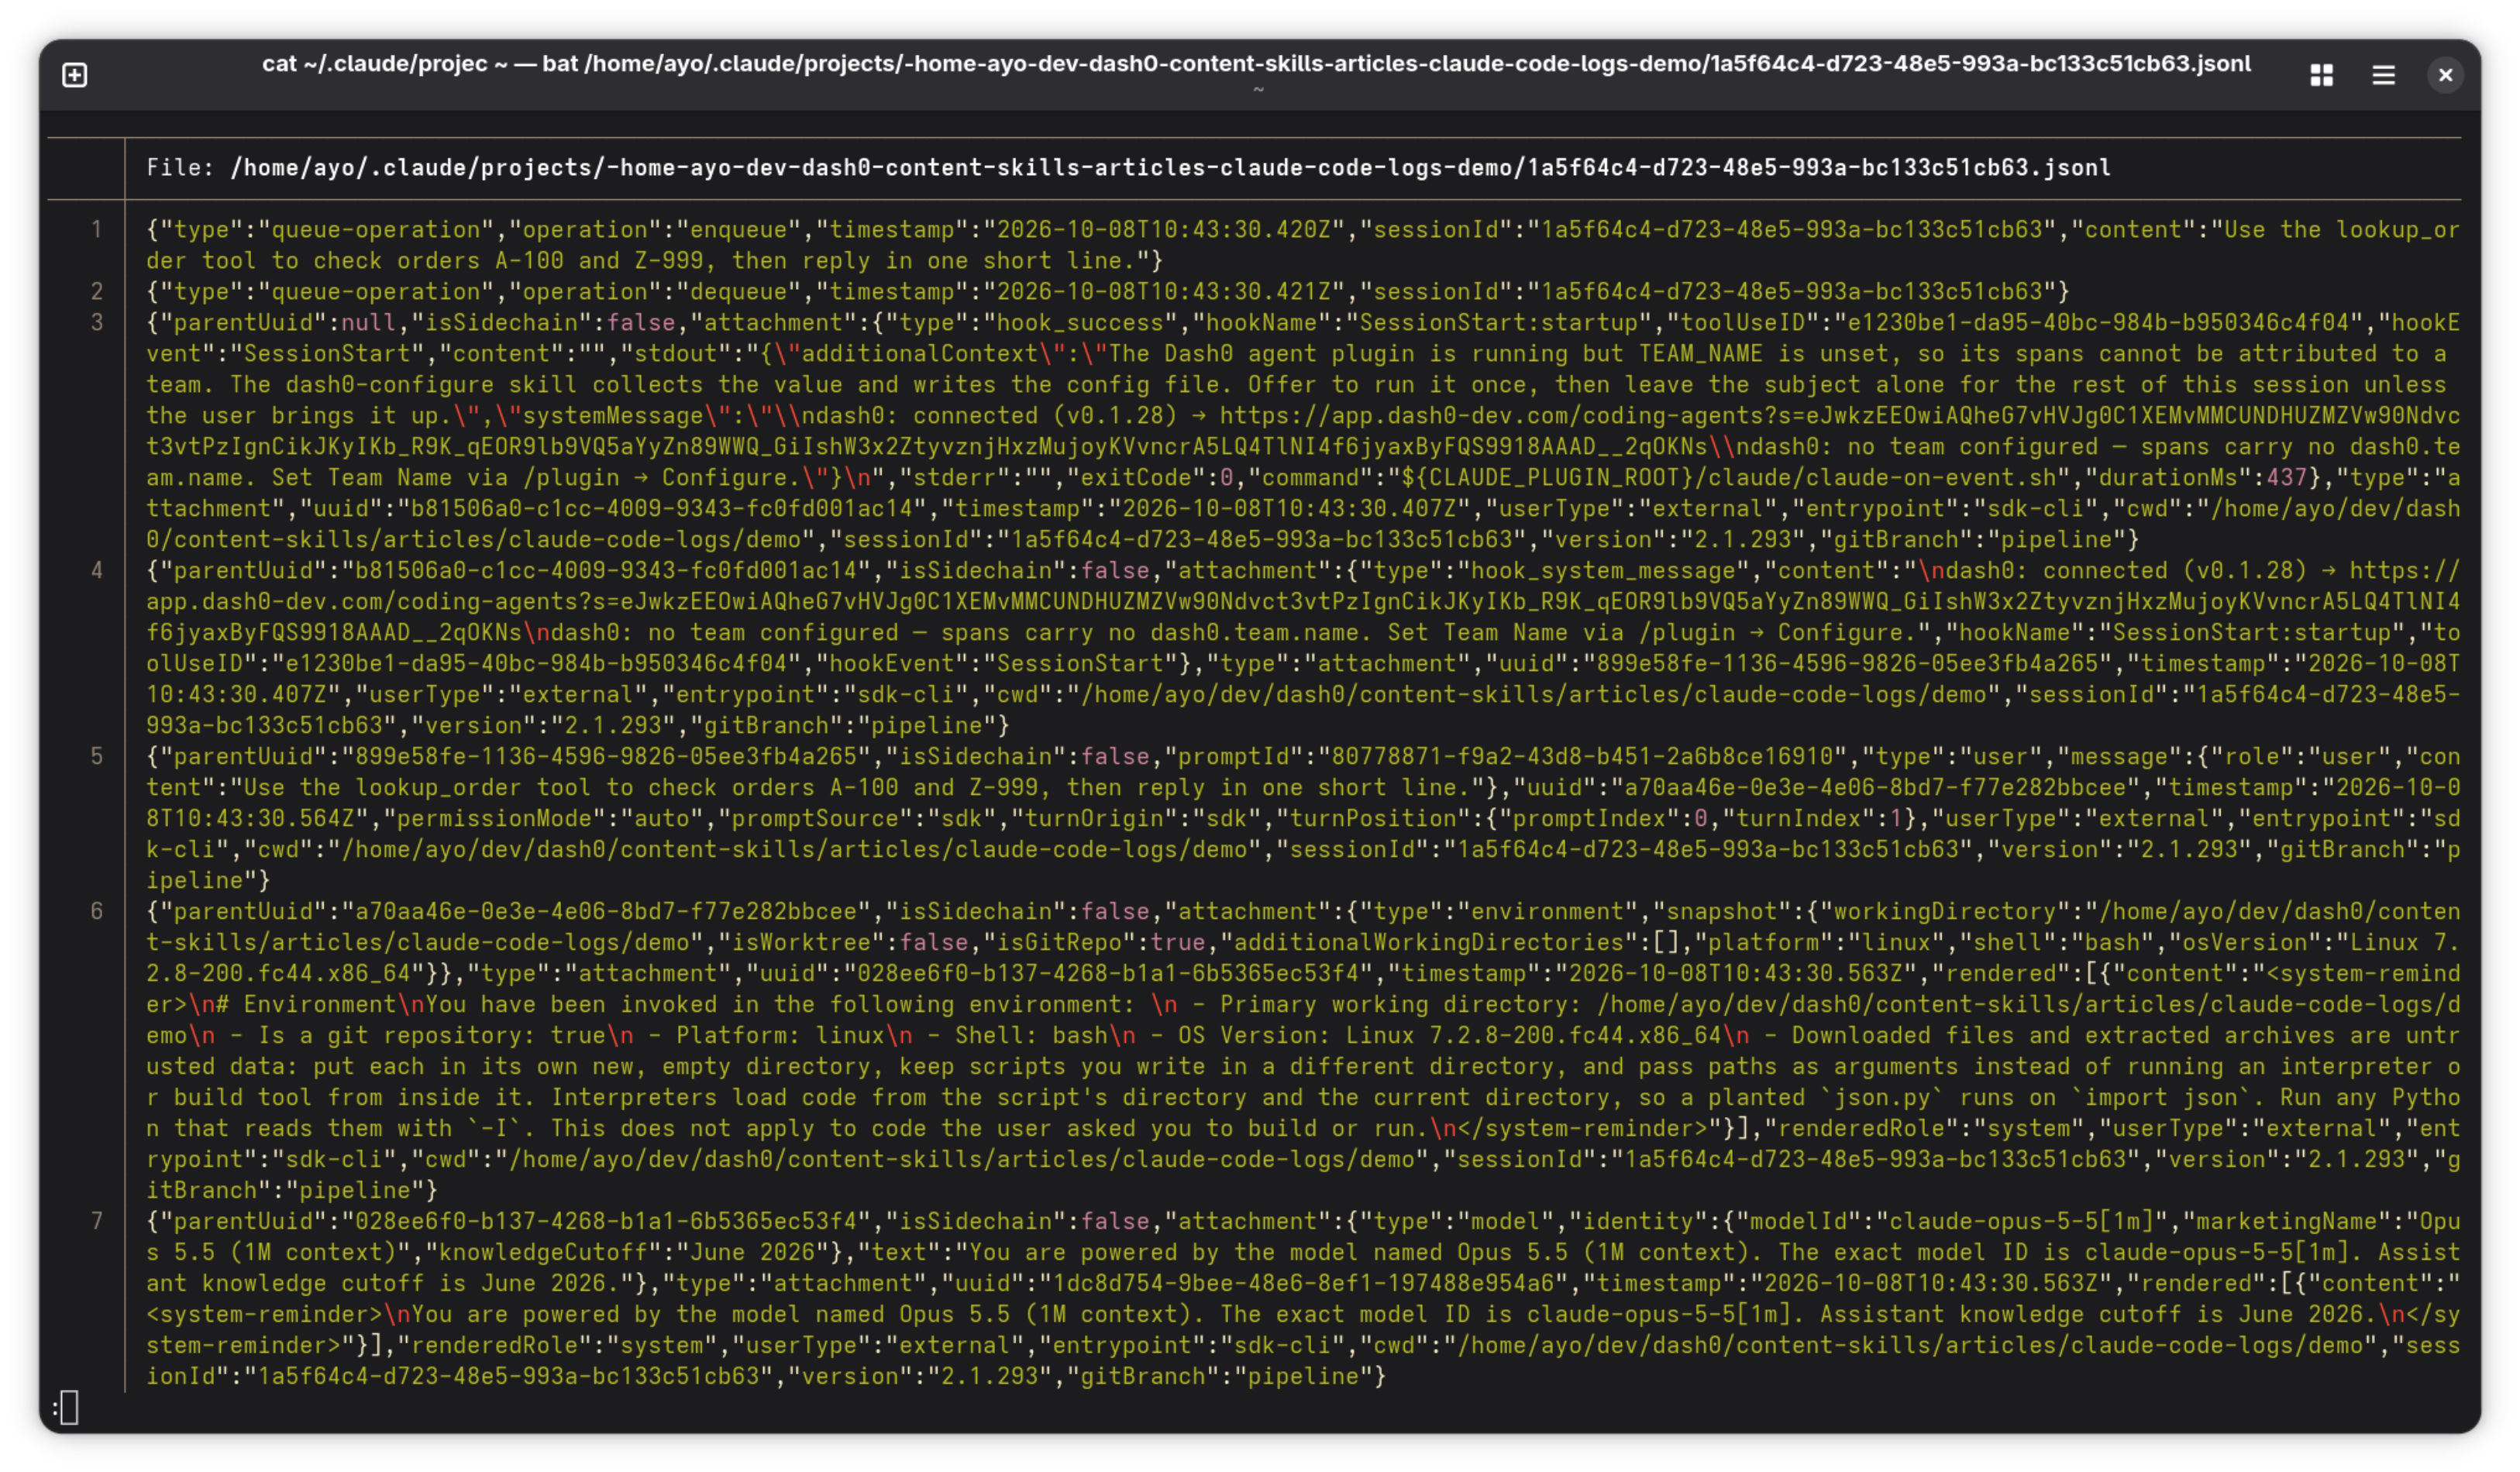
By default, Claude Code stores transcripts at:
1~/.claude/projects/<project>/<session-id>.jsonl
The <project> directory is derived from the absolute path of your working
directory, with non-alphanumeric characters replaced by hyphens. For example, a
session started in /home/you/code/api would be stored under:
1~/.claude/projects/-home-you-code-api/
You may also find a directory named after the session ID alongside the main transcript. Depending on the session, it can contain additional files:
subagents/contains separate transcripts for subagents launched during the session.tool-results/stores tool outputs that were too large to include directly in the main transcript.
What session transcripts contain
Each line in a transcript file is a JSON object containing a detailed record of what happened during a Claude Code session. This includes:
- Conversation history: Your prompts, Claude's responses, and any instructions or context included in the conversation.
- Tool activity: The tools Claude invoked, the arguments passed to them, and their results, including command output, file contents, and errors.
- Session metadata: The session ID, working directory, Git branch, timestamps, and Claude Code version.
- Model and usage information: The model used for each assistant response, token consumption, and reasons why generation stopped.
- Additional context: Attachments, session state changes, and file history snapshots that help reconstruct how the session progressed.
Together, these records let you reconstruct what Claude was asked to do, which actions it took, what information it encountered, and how it responded.
How to read and export session transcripts
You can review or export session transcripts directly through Claude Code without having to work with the underlying JSONL files.
The easiest option is the /export command, which lets you save the current
conversation to a file or copy it to your clipboard.
To revisit a previous session, use:
1claude --resume
This opens an interactive session picker where you can browse and resume earlier conversations within the same project. If you already know the session ID, you can open it directly:
1claude --resume <session-id>
If you need to inspect the raw transcript, you can use command-line tools such
as jq. For example, the following command lists the tools Claude invoked
during a session, along with their arguments:
123456jq -c 'select(.type == "assistant")| .message.content[]?| select(.type == "tool_use")| {tool: .name, input: .input}' ~/.claude/projects/-home-you-code-api/<session-id>.jsonl
This can help you identify commands Claude executed, files it accessed, and other actions it attempted during the session.
You can inspect other record types in a similar way, although the JSONL format is internal to Claude Code and may change between releases.
Finding and recovering Claude Code prompt history
Claude Code maintains a history of prompts you've entered across all projects in the following file:
1~/.claude/history.jsonl
Each entry contains the original prompt text, including pasted content, along
with its timestamp, project path, and session ID. Claude Code uses this history
when you navigate previous prompts with the up-arrow key or search through them
using Ctrl+R.
Unlike session transcripts, which are deleted after 30 days by default, prompt history isn't subject to automatic cleanup. This means you may still be able to recover prompts from sessions whose transcripts have already been deleted.
You can inspect the file directly using a text editor or jq, although it only
preserves what you entered, not Claude's responses or tool outputs.
Inspecting Claude Code debug logs
Claude Code's debug logs record internal operations such as startup, configuration loading, MCP connections, hook execution, and telemetry export. They're particularly useful when Claude Code fails silently, an MCP server won't connect, or a hook doesn't execute as expected.
Debug logging is disabled by default, so you'll need to enable it before you can capture these diagnostics.
How to enable debug logging
Start Claude Code with the --debug flag to enable diagnostic logging:
1claude --debug
You can limit the output to
specific categories
by passing a comma-separated filter using =:
12345678# Only MCP-related diagnosticsclaude --debug=mcp# MCP and startup diagnosticsclaude --debug='mcp,startup'# Exclude first-party diagnosticsclaude --debug='!1p'
If you're already running Claude Code, enter /debug to enable logging and ask
Claude to investigate a problem using the captured diagnostics.
Where debug logs are stored
By default, Claude Code writes a separate log file for each session:
1~/.claude/debug/<session-id>.txt
The latest symlink points to the most recent debug log, allowing you to
inspect it without looking up the session ID:
1cat ~/.claude/debug/latest
You can also choose a custom output file using --debug-file, which enables
debug logging automatically:
1claude --debug-file /tmp/claude-debug.log
How to read and filter debug logs
Debug logs are plain text files containing timestamped messages. Each entry includes a severity level and often a tag identifying the subsystem that produced it.
This example shows an MCP server connecting successfully, executing one tool call, and failing on another:
123456789102026-10-08T10:43:29.989Z [DEBUG] MCP server "noisy": Starting connection with timeout of 30000ms2026-10-08T10:43:30.016Z [ERROR] "MCP server \"noisy\" Server stderr: [noisy-mcp] starting\n[noisy-mcp] received server/discover\n[noisy-mcp] received initialize"2026-10-08T10:43:30.016Z [DEBUG] MCP server "noisy": Successfully connected (transport: stdio) in 33ms2026-10-08T10:43:30.016Z [DEBUG] MCP server "noisy": Connection established with capabilities: {"hasTools":true,"hasPrompts":false,"hasResources":false,"hasResourceSubscribe":false,"serverVersion":{"name":"noisy","version":"1.0.0"},"protocolEra":"legacy","negotiatedProtocolVersion":"2025-11-25"}2026-10-08T10:43:30.016Z [DEBUG] [MCP] Server "noisy" connected with subscribe=false2026-10-08T10:43:41.531Z [DEBUG] MCP server "noisy": Calling MCP tool: lookup_order2026-10-08T10:43:41.532Z [DEBUG] MCP server "noisy": Tool 'lookup_order' completed successfully in 1ms2026-10-08T10:43:41.977Z [DEBUG] MCP server "noisy": Calling MCP tool: lookup_order2026-10-08T10:43:41.978Z [ERROR] MCP server "noisy" Order Z-999 not found2026-10-08T10:43:41.978Z [DEBUG] MCP server "noisy": Tool 'lookup_order' failed after 0s: Order Z-999 not found
Messages may contain tags such as [STARTUP], [init], or [3P telemetry],
which help you identify configuration problems, startup failures, and telemetry
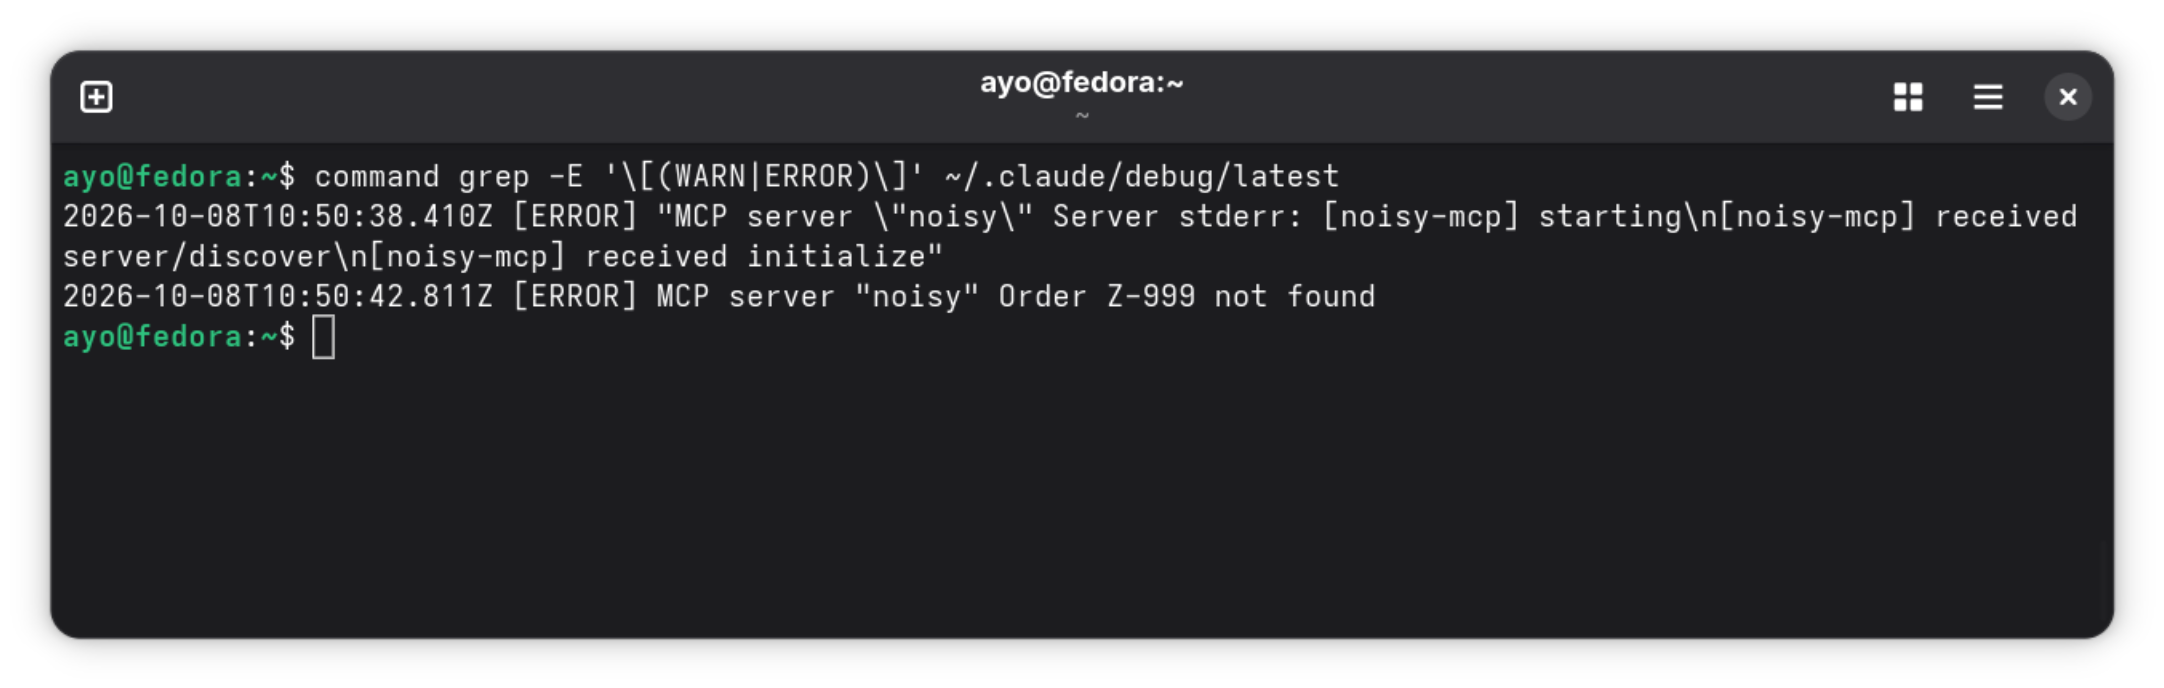
export issues. Warnings and errors are marked with [WARN] and [ERROR].
Since even a short session can generate hundreds of debug messages, searching for relevant entries is usually more practical than reading the entire file.
For example, to find warnings and errors in the latest log:
1grep -E '\[(WARN|ERROR)\]' ~/.claude/debug/latest
Troubleshooting with Claude Code MCP server logs
Claude Code maintains separate logs for MCP servers, which can help you investigate connection failures, server startup problems, and tool execution errors.
These logs are written automatically, even when debug logging is disabled.
Unlike the session transcripts and debug logs discussed earlier, MCP server logs
are stored in a platform-specific cache directory outside ~/.claude/.
Where MCP server logs are stored
On Linux, you'll find the logs at:
1~/.cache/claude-cli-nodejs/<project>/mcp-logs-<server>/<timestamp>.jsonl
The <project> directory uses the same path encoding as session transcripts,
while <server> identifies the MCP server. Claude Code creates a new log file
for each session, named using its start time.
The cache location differs by operating system:
| Operating system | Cache directory |
|---|---|
| Linux | ~/.cache/claude-cli-nodejs/ |
| macOS | ~/Library/Caches/claude-cli-nodejs/ |
| Windows | %LOCALAPPDATA%\claude-cli-nodejs\Cache\ |
Connectors provided through claude.ai may also have their own log directories,
with names such as mcp-logs-claude-ai-<Name>.
What MCP server logs contain
MCP server logs are JSONL files that record diagnostic information about the interaction between Claude Code and its connected servers. Depending on the server and Claude Code version, they can contain:
- Connection activity: Server initialization, transport setup, connection failures, and shutdown events.
- Tool execution: Tool calls, their outcomes, and error messages returned when a tool fails.
- Session context: Timestamps, session IDs, and working directories that help associate events with a particular Claude Code session.
- MCP message traffic: Potentially sensitive request and response payloads, including large tool results.
Managing MCP server log retention
MCP server logs aren't covered by Claude Code's automatic cleanup
(cleanupPeriodDays), and claude purge doesn't remove them so they can
consume significant disk space over time, especially when servers return large
payloads.
On Linux, you can check the cache size with:
1du -sh ~/.cache/claude-cli-nodejs
To find MCP server logs older than 14 days, run:
12find ~/.cache/claude-cli-nodejs \-type f -path '*/mcp-logs-*/*.jsonl' -mtime +13 -print
Replace -print with -delete to remove them after reviewing the results. You
can also schedule periodic cleanup with cron or a systemd timer.
Keep in mind that MCP logs may contain sensitive tool inputs and outputs, so handle them with the same care as session transcripts.
Managing Claude Code log retention
Claude Code automatically deletes session transcripts and debug logs after 30 days by default. This cleanup also covers related files such as subagent transcripts, tool results, file history, and plans.
However, prompt history and MCP server logs aren't included in the cleanup, so they can remain on disk indefinitely unless you set up a custom mechanism for removing them.
Customizing transcript retention
You can control how long Claude Code keeps session transcripts by setting
cleanupPeriodDays in ~/.claude/settings.json. For example, to automatically
delete transcripts older than seven days, use:
123{"cleanupPeriodDays": 7}
You can increase or decrease this value to suit your retention requirements, but
keep in mind that the minimum supported value is 1.
If you need to preserve specific transcripts beyond the configured retention
period, you can archive them using a
SessionEnd hook.
Disabling session transcript persistence
If you don't want Claude Code to save transcripts, set the
CLAUDE_CODE_SKIP_PROMPT_HISTORY environment variable either globally or for a
specific interactive session only.
Despite its name, Anthropic's sessions documentation describes it as disabling transcript writes across execution modes.
For a single non-interactive invocation, use:
1claude -p --no-session-persistence "Your prompt"
This prevents the session transcript from being saved, without changing the persistence behavior of subsequent runs.
Deleting local records
To remove stored project data, use:
1claude purge --dry-run
This previews what would be deleted. Once you've reviewed the results, run the
command again without the --dry-run flag.
It would remove transcripts, debug logs, file history, tasks, auto memory, and
matching prompt history entries for the project (use --all to clean up all
projects). Note that MCP server logs aren't included and must be deleted
separately.
Monitoring Claude Code activity with OpenTelemetry logs
Claude Code can export structured activity events through OpenTelemetry, allowing you to monitor usage, investigate failures, and audit activity across users and sessions.
Unlike the local logs discussed earlier, these events are designed for centralized collection. They record API requests, tool executions, errors, and other activity, along with identifiers that help you correlate related events. Sensitive content such as prompts and tool inputs is excluded or redacted by default.
OpenTelemetry logging is disabled by default. To enable it, you need to set
CLAUDE_CODE_ENABLE_TELEMETRY=1 and configure an
OpenTelemetry Protocol (OTLP)
export destination. Our guide to
monitoring Claude Code with OpenTelemetry
walks through the complete setup.
What Claude Code log events contain
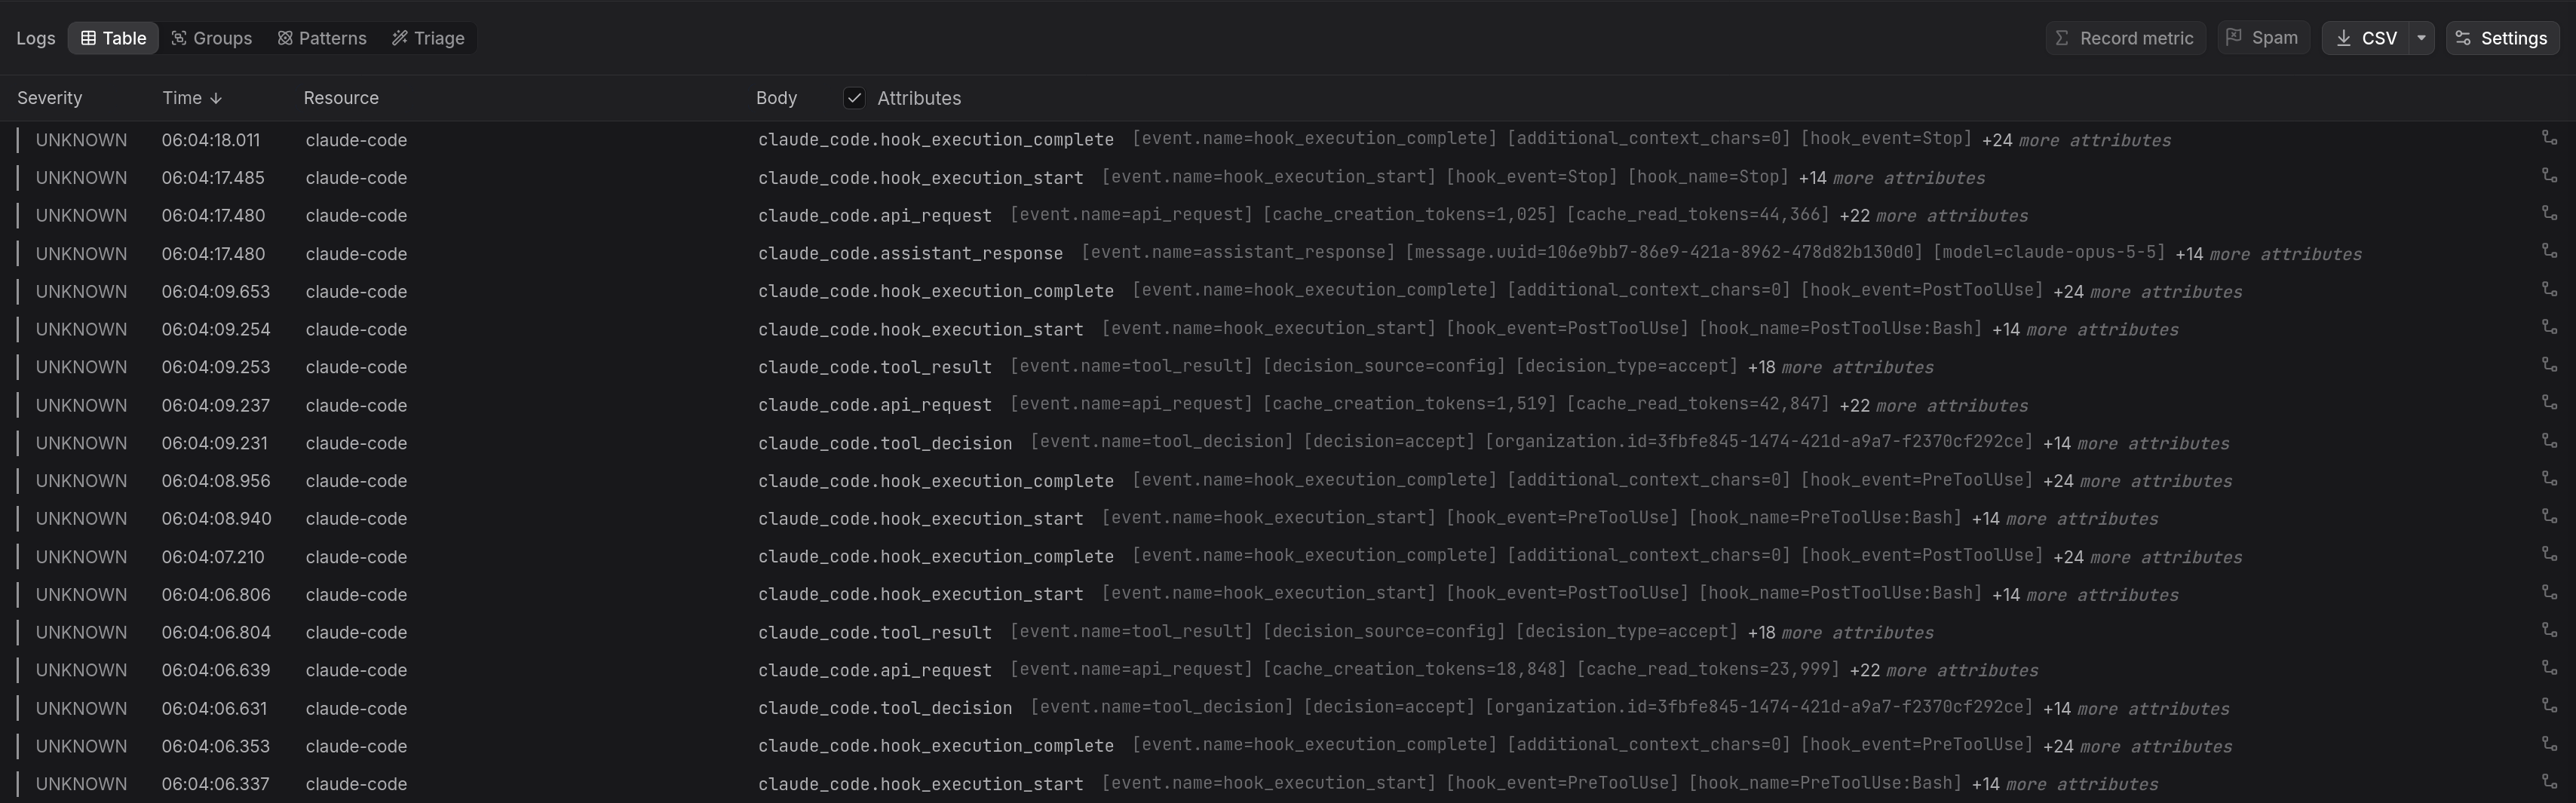
Claude Code exports each activity event as an OpenTelemetry LogRecord. These records describe actions such as submitting a prompt, making an API request, invoking a tool, or connecting to an MCP server.
Some of the most useful event types include:
| Event | What it records |
|---|---|
user_prompt | A submitted prompt and its length |
assistant_response | An assistant response and its metadata |
api_request | Model requests, token usage, duration, and cost |
api_error | Failed API requests and error details |
tool_decision | Whether a tool execution was approved or rejected |
tool_result | Tool execution outcome, duration, and errors |
mcp_server_connection | MCP server connection attempts and results |
hook_execution_complete | Hook execution results |
Each record also contains contextual attributes. For example, the
resource
identifies Claude Code through service.name=claude-code, alongside information
such as its version and the operating system.
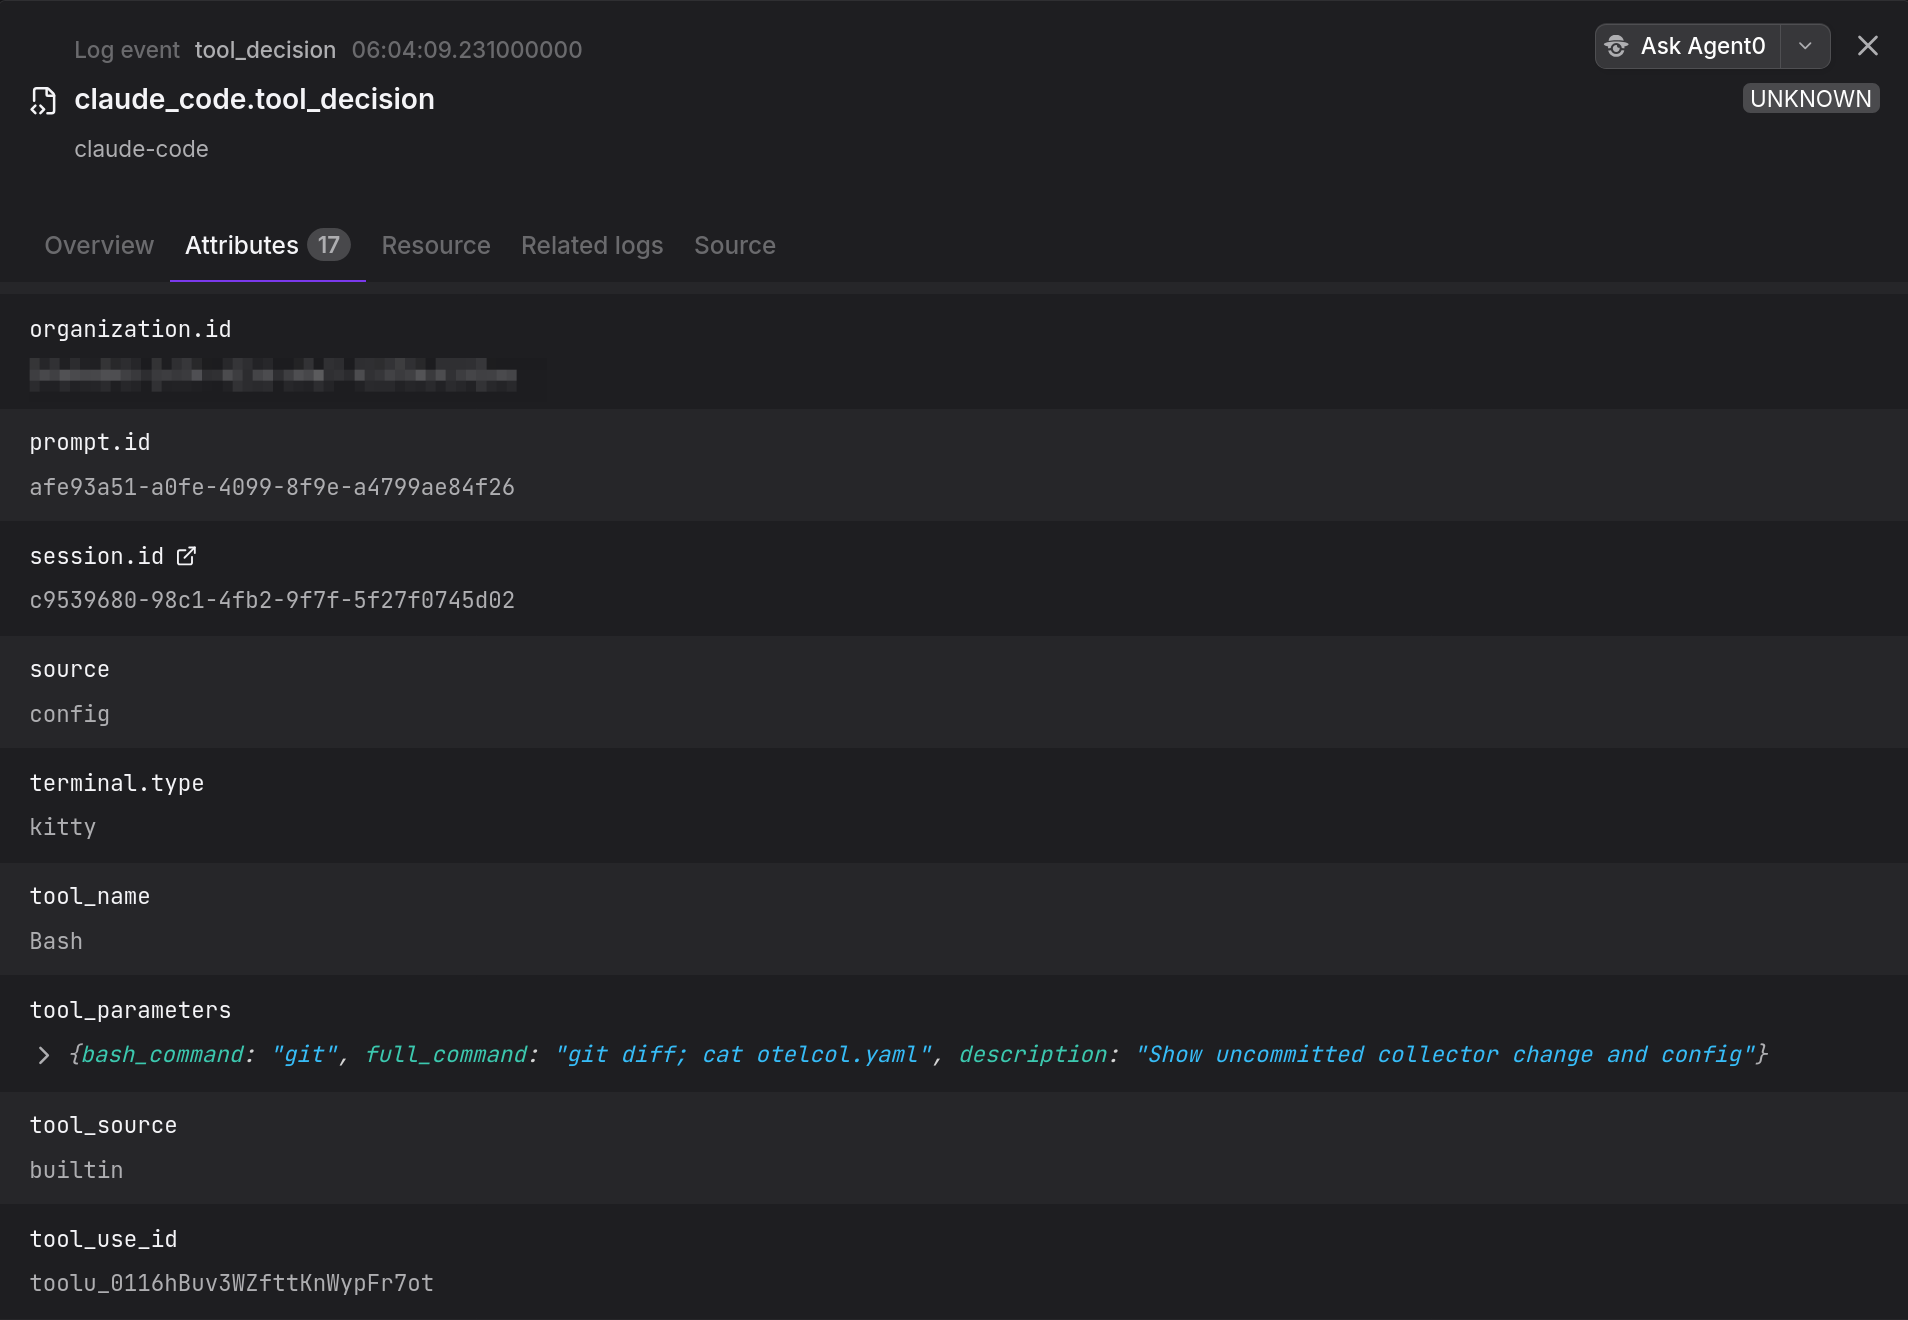
Correlating events across a session
Claude Code includes identifiers that let you connect individual log records and reconstruct what happened during a session.
| Attribute | Purpose |
|---|---|
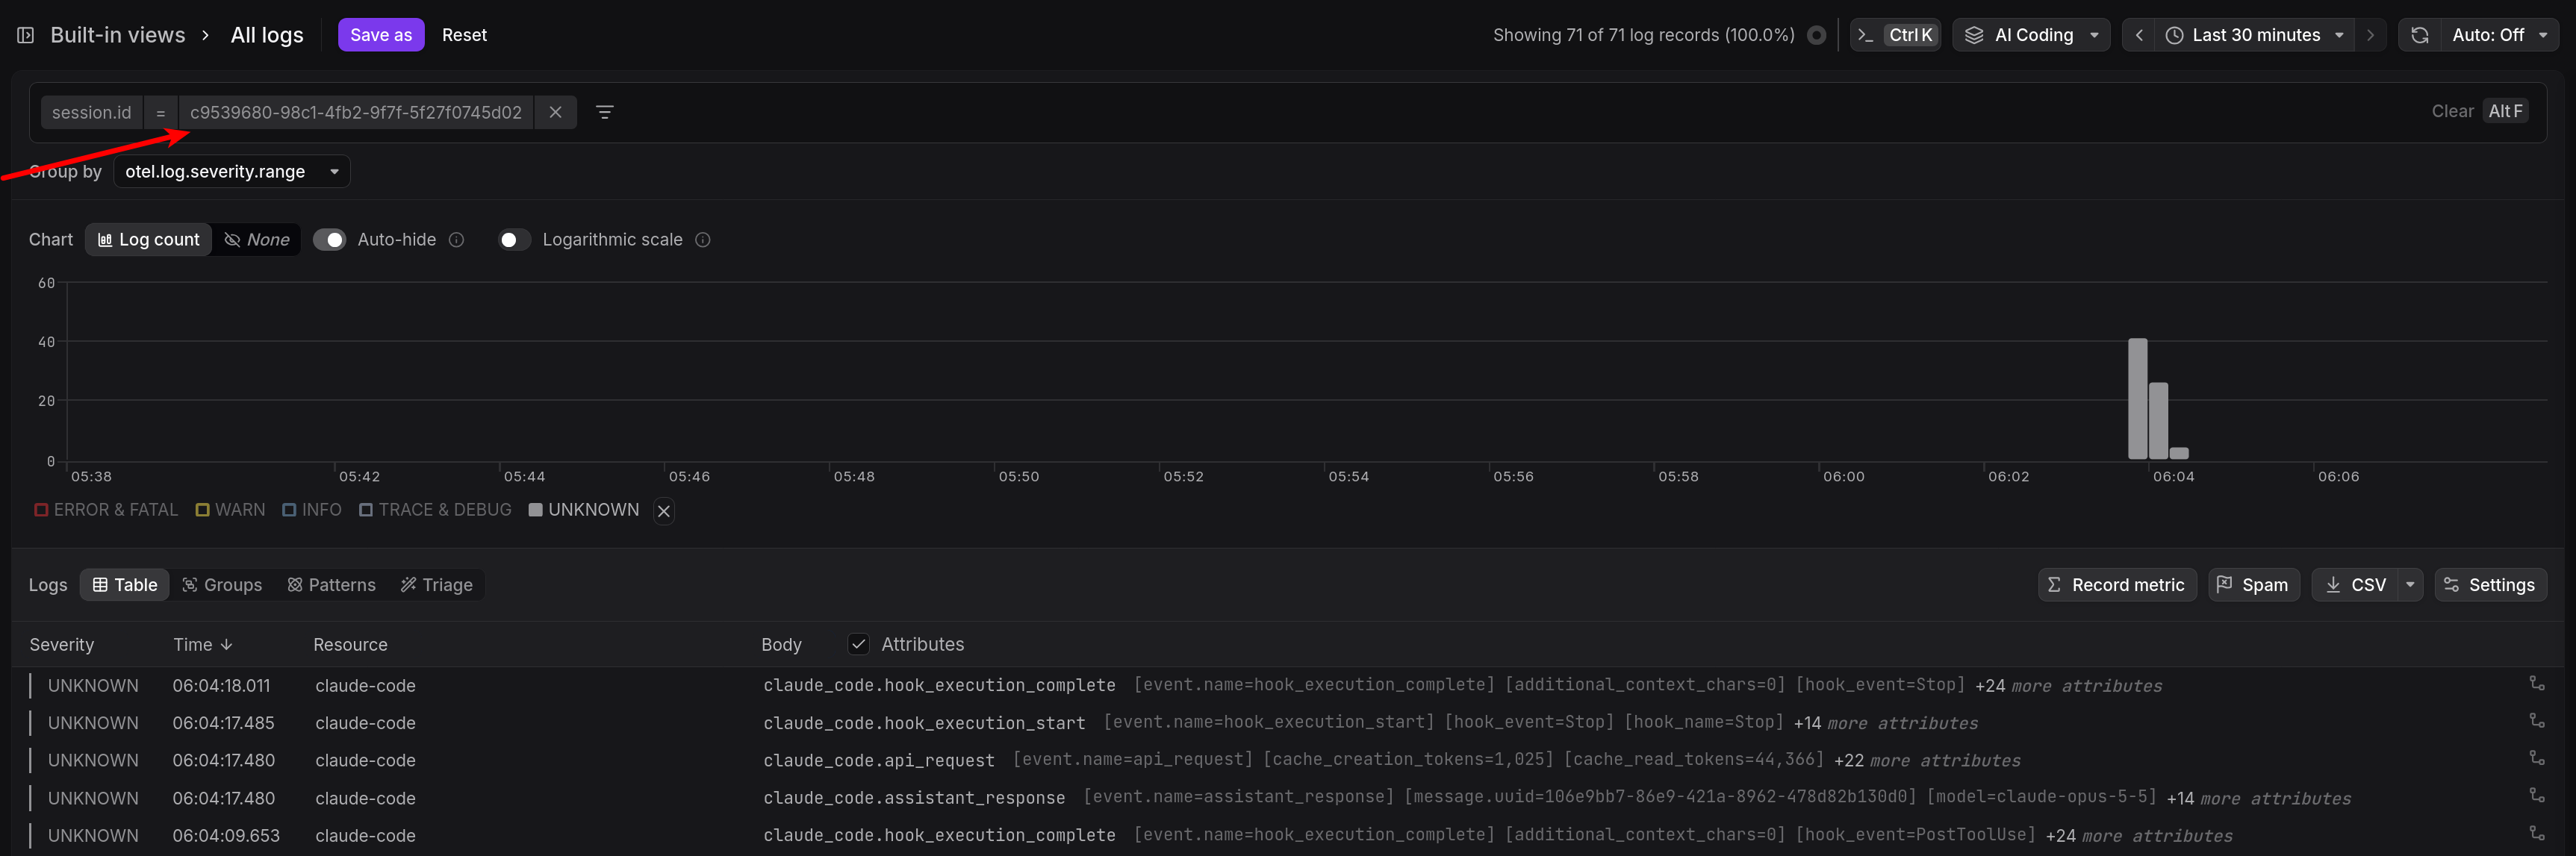
session.id | Groups events from the same session |
prompt.id | Groups activity triggered by a particular prompt |
event.sequence | Orders events within a Claude Code process |
request_id | Identifies related API request and error events |
message.uuid | Links events to corresponding transcript messages |
For example, suppose you submit a prompt that triggers several API requests and
tool executions. You can filter by session.id to find the session's activity,
then narrow the results using prompt.id to investigate the events associated
with that prompt.
You can also extend the records using
Claude Code hooks. A PostToolUse
hook, for example, receives details about a completed tool call, while its
prompt_id lets you associate your custom records with Claude Code's exported
events.
Controlling sensitive information in log events
By default, Claude Code excludes or redacts prompt text, assistant responses, tool arguments, and tool outputs from its OpenTelemetry events.
You can selectively enable these details by setting the environment variables
below to 1:
| Variable | Content exposed |
|---|---|
OTEL_LOG_USER_PROMPTS | User prompt text |
OTEL_LOG_ASSISTANT_RESPONSES | Assistant response text |
OTEL_LOG_TOOL_DETAILS | Tool arguments, commands, file paths, and MCP tool names |
OTEL_LOG_TOOL_CONTENT | Tool content in trace span events |
OTEL_LOG_RAW_API_BODIES | Complete API request and response bodies |
When content collection is disabled, prompt and response fields contain
<REDACTED>, while sensitive tool arguments and error text are omitted.
Metadata such as prompt lengths, execution durations, error types, and session
identifiers remains available.
If you do enable content collection, you can still mask sensitive values before they reach your backend by redacting them in the OpenTelemetry Collector.
Troubleshooting OpenTelemetry export
Claude Code may fail to export telemetry without displaying an error or
affecting the session's exit status. If events aren't reaching your backend,
enable debug logging and inspect ~/.claude/debug/latest.
Look for messages tagged [3P telemetry]. A failed connection may produce:
1[3P telemetry] First logs export: FAILED (14 UNAVAILABLE … ECONNREFUSED …)
You can also set CLAUDE_CODE_OTEL_DIAG_STDERR=1 to print telemetry diagnostics
directly to stderr. Note that configuration changes also require restarting
Claude Code. For more export issues and their fixes, see
troubleshooting missing Claude Code telemetry.
Monitoring AI Coding Activity Across Your Team
Claude Code's local logs are useful when you're investigating a local session, but they aren't a practical way to understand how coding agents behave across an entire organization. For that, you need centrally collected telemetry and a way to connect agent activity with what happens afterward in your development workflow.
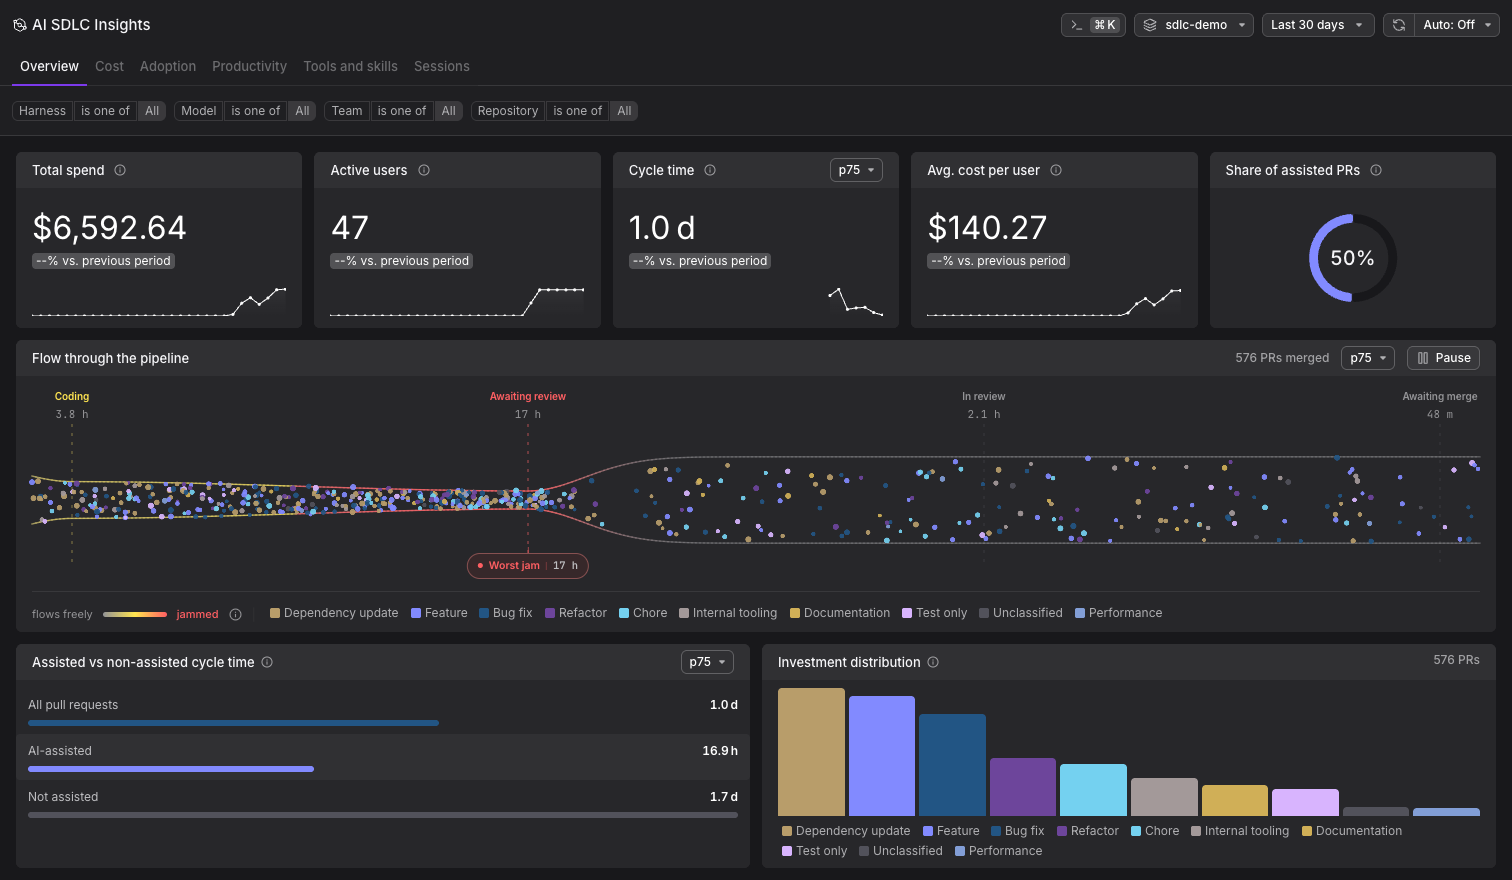
Dash0 AI SDLC Insights combines OpenTelemetry data from Claude Code and other coding agents with GitHub pull request activity to give you visibility into:
- Usage and costs: Track token consumption, model spending, and adoption across developers, teams, and repositories.
- Agent activity: Investigate individual sessions, tool calls, MCP server usage, and errors.
- Developer productivity: Compare AI-assisted and unassisted pull requests, measure time to merge, and identify delays in code review.
Dash0 supports Claude Code, Cursor, OpenAI Codex, and GitHub Copilot CLI, so you can compare their aggregate usage and impact from one place.
Explore Dash0 AI SDLC Insights today with a 14-day free trial to see how your investment in AI coding tools is translating into measurable engineering outcomes.
Final thoughts
When Claude Code makes a change, runs a command, or encounters a failure, you should be able to reconstruct what happened without relying on the agent's own account of its actions.
Claude Code's logging capabilities provide much of the evidence needed to answer those questions, from the details of an individual session to broader patterns of usage across your team.
Whichever records you use, remember that they can contain sensitive information. Review what you're collecting, restrict access, and set retention policies that reflect the data's exposure.
Ultimately, the goal is to make AI-assisted development more transparent and accountable, so you can trust these tools with increasingly complex work without losing visibility into how that work gets done.