Last updated: April 16, 2026
Morgan Logger: HTTP Request Logging in Node.js & Express
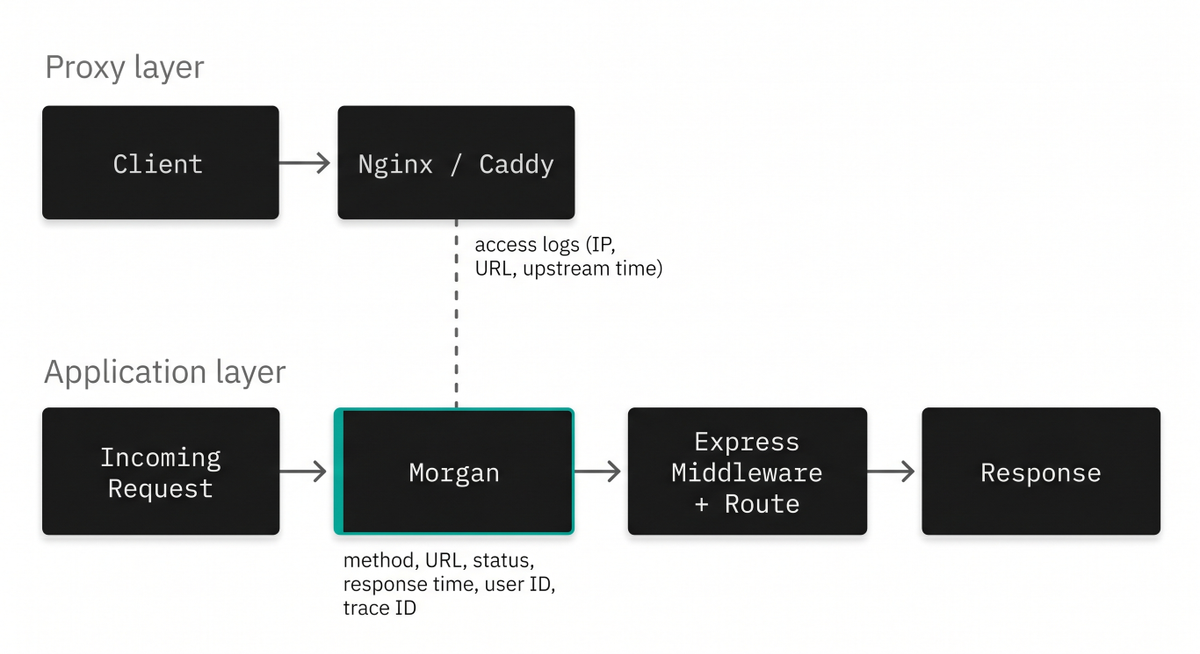
Many Express applications sit behind a reverse proxy like Nginx or Caddy that already produce their own access logs.
They give you a picture of what reached the proxy, but they can't tell you how long your application logic actually took, which middleware ran, or what application-level context (like an authenticated user ID) was attached to the request.
Morgan fills that gap by logging HTTP requests from inside the Express process itself, where you've got access to everything the framework knows about each request and response.
This guide covers everything you need to know about Morgan, from the initial
npm install to advanced production configurations that feed structured logs
into an observability platform.
Whether you're setting up your first Express project or retrofitting request logging onto a mature codebase, every example here is self-contained and ready to run.
What Morgan actually does
Morgan is an HTTP request logger middleware for Node.js. It hooks into the Express (or Connect-compatible) request lifecycle and records details about each incoming request and its corresponding response.
The information it captures includes the HTTP method, request URL, response status code, response time in milliseconds, content length, referrer, and user agent, and it is easily customized to include custom data from your application.
Unlike general-purpose loggers such as Winston or Pino, Morgan is purpose-built for a single task: access logs. It doesn't handle application-level logging, error events, or anything outside the HTTP request lifecycle.
That narrow focus is actually its strength because the API is small and the integration is a single line.
Installing and getting started
Start by installing Morgan alongside Express in your project directory:
1npm install express morgan
Then wire it up as middleware in your application entry point:
1234567891011121314import express from "express";import morgan from "morgan";const app = express();app.use(morgan("dev"));app.get("/", (req, res) => {res.json({ status: "ok" });});app.listen(3000, () => {console.log("Server listening on port 3000");});
With this minimal setup, every request to your server will produce a log line in
your terminal. The "dev" argument tells Morgan which predefined format to use,
and the output looks something like this:
1GET / 200 1.473 ms - 15
That single line tells you the method, the path, the status code, how long the server took to respond, and the size of the response body in bytes. For local development, that's often all you need.
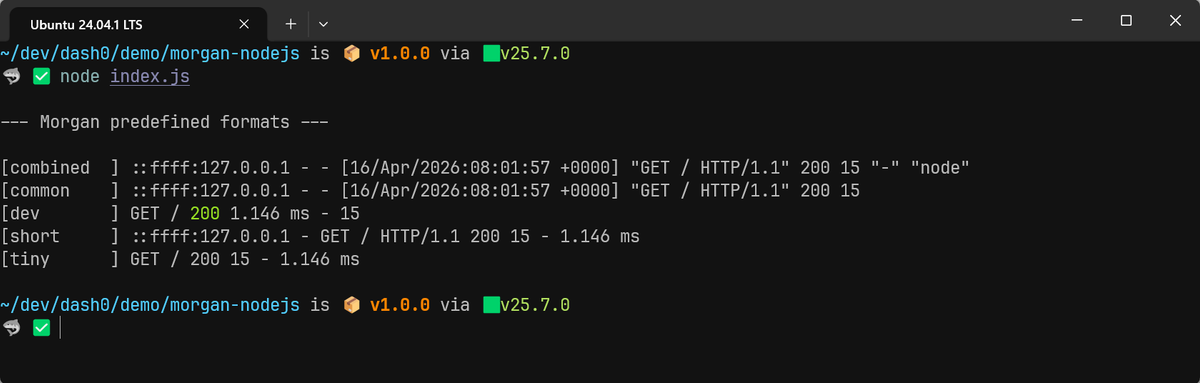
Understanding Morgan's five predefined formats
Morgan ships with five built-in format presets that range from verbose Apache-style access logs down to bare-minimum one-liners. The table below shows exactly which fields each format includes:
| Format | Remote Addr | User | Timestamp | Method/URL | Status | Size | Referrer | User Agent | Response Time |
|---|---|---|---|---|---|---|---|---|---|
combined | yes | yes | yes | yes | yes | yes | yes | yes | no |
common | yes | yes | yes | yes | yes | yes | no | no | no |
dev | no | no | no | yes | yes | yes | no | no | yes |
short | yes | no | no | yes | yes | yes | no | no | yes |
tiny | no | no | no | yes | yes | yes | no | no | yes |
combinedfollows the Apache Combined Log Format and it's historically been the default since virtually every logging tool can parse it natively.commonis the same thing ascombinedminus the referrer and user agent.devproduces color-coded, concise output that's ideal for local work (green for 2xx, red for 5xx, and so on).shortandtinyare progressively smaller subsets ofcombinedfor situations where you want minimal noise.
These presets all produce plain text output, which is fine for your local development environment but is a liability in production. Before we get to the structured JSON approach that solves that, let's look at how Morgan's token system works, since it underpins everything that follows.
Using custom format strings and built-in tokens
If the presets don't match your requirements, Morgan lets you compose your own format strings using token placeholders. Each token is prefixed with a colon and resolves to a specific piece of request or response data at runtime.
For instance:
123app.use(morgan(":method :url :status :res[content-length] -> :response-time ms"),);
This produces output like:
1GET /api/users 200 245 -> 3.891 ms
You can mix tokens freely with literal text to construct whatever format suits your use case. Here's another example that adds the date and remote address:
123app.use(morgan("[:date[iso]] :remote-addr :method :url :status :response-time ms"),);
Which yields:
1[2026-04-15T12:49:26.037Z] ::1 GET / 200 1.724 ms
Morgan defines the following built-in tokens that you can reference in format strings:
:date[format]returns the current timestamp. Theformatargument acceptsclf(Common Log Format),iso(ISO 8601), orweb(RFC 1123). Defaults towebwhen no argument is given.:http-versionreturns the HTTP version from the request, such as1.1.:methodreturns the HTTP method (GET,POST, etc.).:referrerreturns the value of theReferer(orReferrer) header.:remote-addrreturns the remote IP address of the request.:remote-userreturns the user authenticated via basic auth.:req[header]returns the value of the specified request header.:res[header]returns the value of the specified response header.:response-time[digits]returns the time between the request entering Morgan and the response headers being written, in milliseconds. Thedigitsargument controls decimal precision and defaults to 3.:statusreturns the HTTP status code.:total-time[digits]returns the time between the request entering Morgan and the response finishing, including the time it takes to write the body to the connection.:urlreturns the URL of the request, usingreq.originalUrlif it exists.:user-agentreturns the value of theUser-Agentheader.
Here's a kitchen-sink format string that references every built-in token at once, which can be useful as a starting point when you're deciding what to keep and what to drop:
12345app.use(morgan(":date[iso] :http-version :method :url :status :res[content-length] :response-time :total-time :remote-addr :remote-user :referrer :user-agent :req[host]",),);
When a token's underlying value isn't available, Morgan prints a - in its
place. You'll see this often with :remote-user (which requires basic auth) and
:referrer (which depends on the client sending the header):
12026-04-15T12:53:04.190Z 1.1 GET / 200 15 1.475 2.973 ::1 - - curl/8.5.0 localhost:3000
Producing structured JSON output
Format strings are great for local development environments, but the standard practice in modern observability is to log structured JSON so that downstream tools can query and filter individual fields without resorting to regex.
Morgan's format argument doesn't have to be a string. You can also pass a
function that receives the token accessor, the request, and the response, and
returns whatever string you want. By returning JSON.stringify(...), every log
line becomes a parseable JSON object:
1234567891011121314app.use(morgan((tokens, req, res) => {return JSON.stringify({timestamp: tokens.date(req, res, "iso"),method: tokens.method(req, res),url: tokens.url(req, res),status: Number(tokens.status(req, res)),responseTimeMs: Number(tokens["response-time"](req, res)),contentLength: Number(tokens.res(req, res, "content-length")),userAgent: tokens["user-agent"](req, res),remoteAddr: tokens["remote-addr"](req, res),});}),);
This outputs one JSON object per line to the stdout:
12345678910{"timestamp": "2026-04-15T17:39:40.208Z","method": "GET","url": "/","status": 200,"responseTimeMs": 1.601,"contentLength": 15,"userAgent": "curl/8.5.0","remoteAddr": "::1"}
This is trivially parseable by jq, the
OpenTelemetry Collector,
or any cloud-based log ingestion service. From this point on, every example in
this guide will build on this JSON approach.
Defining custom tokens with morgan.token()
The built-in tokens cover standard HTTP metadata, but real-world applications
often need to log domain-specific data such as the correlation identifier for
distributed tracing. Morgan handles this with morgan.token():
123456789101112131415161718192021222324import { v4 as uuidv4 } from "uuid";// Attach a unique request ID early in the middleware chainapp.use((req, res, next) => {req.id = req.headers["x-request-id"] || uuidv4();next();});// Register the custom tokenmorgan.token("request-id", (req) => req.id);// Include it in structured JSON outputapp.use(morgan((tokens, req, res) => {return JSON.stringify({timestamp: tokens.date(req, res, "iso"),requestId: tokens["request-id"](req, res),method: tokens.method(req, res),url: tokens.url(req, res),status: Number(tokens.status(req, res)),responseTimeMs: Number(tokens["response-time"](req, res)),});}),);
This outputs:
12345678{"timestamp": "2026-04-15T17:52:01.387Z","requestId": "09da7668-5d3b-461b-a7ba-b2294e9fe793","method": "GET","url": "/","status": 200,"responseTimeMs": 1.583}
The callback you passed to morgan.token() receives the request and response
objects, so you've got full access to anything attached during earlier
middleware.
You can register as many custom tokens as you need, and if you call
morgan.token() with the name of an existing token, the new definition silently
replaces the old one.
Conditional logging with skip
Not every request deserves a log entry. Health check endpoints, for instance,
are typically hit by load balancers every few seconds and generate enormous
amounts of noise if logged. Morgan's skip option lets you suppress logging for
specific requests.
123456789101112131415const jsonFormat = (tokens, req, res) => {return JSON.stringify({timestamp: tokens.date(req, res, "iso"),method: tokens.method(req, res),url: tokens.url(req, res),status: Number(tokens.status(req, res)),responseTimeMs: Number(tokens["response-time"](req, res)),});};app.use(morgan(jsonFormat, {skip: (req) => req.url === "/healthz",}),);
You can also use skip to separate logs by status code. A common pattern sends
successful responses to stdout and error responses to stderr, which lets
your infrastructure route them to different destinations:
123456789101112131415// Log successful responses to stdoutapp.use(morgan(jsonFormat, {stream: process.stdout,skip: (req, res) => res.statusCode >= 400,}),);// Log errors to stderrapp.use(morgan(jsonFormat, {stream: process.stderr,skip: (req, res) => res.statusCode < 400,}),);
This two-instance approach takes advantage of the fact that you can call
app.use(morgan(...)) multiple times. Each instance operates independently, so
you can direct different subsets of requests to different destinations.
Logging on request vs response
By default, Morgan writes the log line after the response has been sent. That's the right behavior for most use cases because it means the log entry includes the status code, content length, and response time.
However, if you need to confirm that a request arrived even when the server
crashes before sending a response, you can set the immediate option to true:
1app.use(morgan(jsonFormat, { immediate: true }));
Keep in mind that when immediate is enabled, response data like status codes
and content length won't be available, so those fields will show up as null in
your JSON output (or - if you're using a text format string).
Using Morgan with TypeScript
TypeScript projects benefit from Morgan's type definitions, which are available in the DefinitelyTyped repository:
1npm install --save-dev @types/morgan
With the types installed, you get full autocomplete and type checking:
123456789101112import express from "express";import morgan, { StreamOptions } from "morgan";const app = express();const stream: StreamOptions = {write: (message: string) => {process.stdout.write(message);},};app.use(morgan("combined", { stream }));
And if you're defining custom tokens, the type system keeps you honest about the request and response objects:
123morgan.token("user-id", (req: express.Request) => {return (req as any).user?.id ?? "anonymous";});
For stricter typing, you can extend the Express Request interface in a
declaration file to include your custom properties.
Pairing Morgan with an application logger
Morgan only logs HTTP requests which means it can't capture application events,
errors, or background job activity. Most production setups pair it with a
general-purpose logger like Winston or Pino so that every log line, whether it
comes from a request or from deeper in your code, flows through a single
pipeline to stdout.
The integration point is Morgan's stream option. Instead of writing directly
to stdout, you can point Morgan's output at your application logger, which
handles the formatting, filtering, and transport.
Winston
To route Morgan's output through Winston, pass a custom stream whose write()
method hands the parsed JSON to Winston's info log level:
123456789101112131415161718import winston from "winston";const logger = winston.createLogger({level: "info",format: winston.format.combine(winston.format.timestamp(),winston.format.json(),),transports: [new winston.transports.Console()],});const morganStream = {write: (message) => {logger.info({ message: "HTTP request handled", ...JSON.parse(message) });},};app.use(morgan(jsonFormat, { stream: morganStream }));
Since Morgan is already producing JSON output, you can parse it and spread the
fields into Winston's log call. This puts method, url, status, and every
other Morgan field at the top level of Winston's JSON output rather than nesting
them under message:
123456789{"level": "info","message": "HTTP request handled","method": "GET","responseTimeMs": 1.691,"status": 200,"timestamp": "2026-04-16T06:20:17.432Z","url": "/"}
For a deeper dive into Winston itself, see our comprehensive guide on Mastering Winston for Production Logging in Node.js.
Pino
To route Morgan's output through Pino, the same spread pattern applies. Pino's first argument is the mergeable object, and the second is the message string:
1234567891011import pino from "pino";const logger = pino({ level: "info" });const morganStream = {write: (message) => {logger.info({ ...JSON.parse(message) }, "HTTP request handled");},};app.use(morgan(jsonFormat, { stream: morganStream }));
This produces the following log:
123456789101112{"level": 30,"time": 1776320716651,"pid": 52929,"hostname": "falcon","timestamp": "2026-04-16T06:25:16.650Z","method": "GET","url": "/","status": 200,"responseTimeMs": 1.786,"msg": "HTTP request handled"}
Alternatively, you can skip Morgan entirely and use pino-http, which is purpose-built to work with Pino and produces structured JSON from the start:
123import pinoHttp from "pino-http";app.use(pinoHttp());
If you're already committed to Pino for application logging, pino-http is the
more natural fit. But if you've got an existing codebase that already uses
Morgan and you don't want to rewrite your logging layer, piping Morgan into Pino
through a custom stream works perfectly well.
Connecting Morgan to OpenTelemetry
Access logs are most valuable when they can be correlated with traces and metrics. If your application is instrumented with OpenTelemetry (OTel), you can enrich Morgan's output with trace and span IDs so that each log entry links directly to the distributed trace that produced it.
The OpenTelemetry API exposes the active span context, which you can tap into through custom Morgan tokens:
12345678910111213141516171819202122232425262728293031import { trace } from "@opentelemetry/api";morgan.token("trace-id", () => {const span = trace.getActiveSpan();return span ? span.spanContext().traceId : undefined;});morgan.token("span-id", () => {const span = trace.getActiveSpan();return span ? span.spanContext().spanId : undefined;});morgan.token("trace-flags", () => {const span = trace.getActiveSpan();return span ? String(span.spanContext().traceFlags) : undefined;});app.use(morgan((tokens, req, res) => {return JSON.stringify({timestamp: tokens.date(req, res, "iso"),trace_id: tokens["trace-id"](req, res),span_id: tokens["span-id"](req, res),trace_flags: tokens["trace-flags"](req, res),method: tokens.method(req, res),url: tokens.url(req, res),status: Number(tokens.status(req, res)),responseTimeMs: Number(tokens["response-time"](req, res)),});}),);
You will see the trace correlation fields in the corresponding Morgan entry:
12345678910{"timestamp": "2026-04-16T06:40:26.046Z","trace_id": "ec0072f3cfee6a838cea4f5e192a08b4","span_id": "f7d7c1d2626683b9","trace_flags": "1","method": "GET","url": "/","status": 200,"responseTimeMs": 1.956}
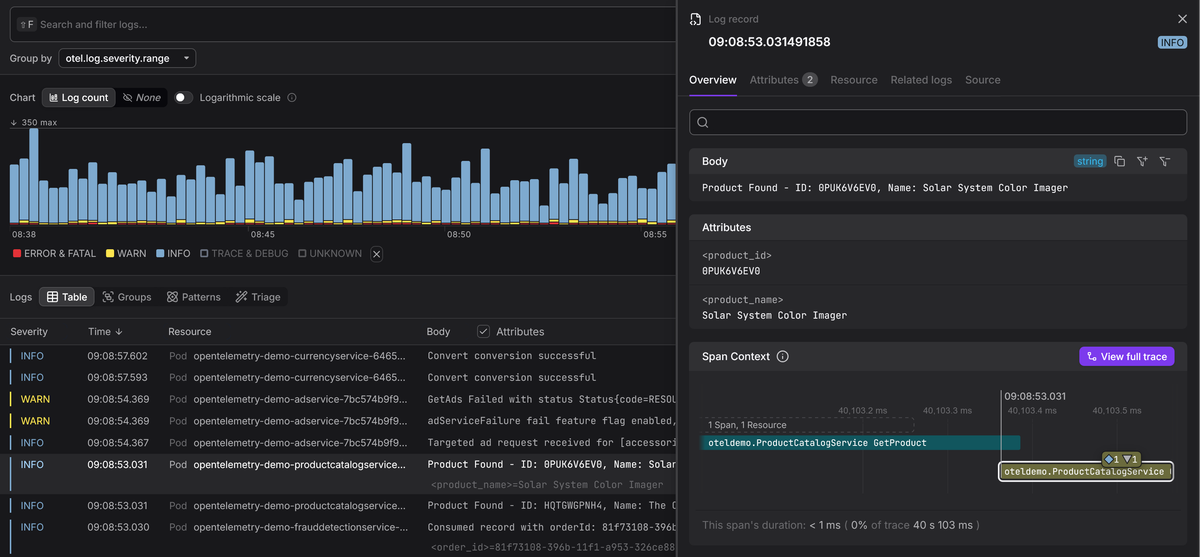
With trace and span IDs present in your access logs, you can jump from a suspicious log entry in your log management platform directly to the full trace view in a tool like Jaeger or Dash0. That correlation dramatically shortens the time it takes to move from "something looks wrong" to "here's the root cause".
Trace context and the OTel Log Data Model
It's worth noting that adding trace_id and span_id as regular JSON fields is
not the same as full OpenTelemetry compliance. The
OTel Log Data Model
expects trace context in specific top-level fields on the log record itself, not
as arbitrary attributes.
So if your JSON logs are being collected by the OpenTelemetry Collector, you'll need a parsing pipeline that maps these fields to the correct positions in the OTel log record.
Note that if you're already piping Morgan through Winston or Pino (as shown in
the earlier section), you don't need to extract trace context manually at all.
The @opentelemetry/instrumentation-winston and
@opentelemetry/instrumentation-pino packages automatically inject trace and
span IDs into every log record and handle the correct field mapping when
exporting via OTLP.
Since Morgan's output flows through those loggers, the trace context comes along for free without any custom Morgan tokens.
Aligning with OTel semantic conventions
If you're going to the trouble of making your logs OpenTelemetry compliant, it's worth naming your Morgan fields consistently with the OTel semantic conventions.
The stable HTTP conventions
define attribute names like http.request.method, url.path,
http.response.status_code, and user_agent.original.
Using these names instead of inventing your own (like method or statusCode)
means your logs, traces, and metrics all speak the same language, which makes it
much easier to correlate and query across signal types in any OTel-compatible
backend.
It's not just the names that matter though. The conventions also specify types:
http.response.status_code is an integer, http.response.body.size is an
integer (in bytes), and http.server.request.duration is a number (in seconds).
Morgan's tokens all return strings, so you need to cast them explicitly in your
format function.
Here's what the JSON format function looks like when you adopt semantic convention naming with their proper values:
123456789101112131415161718192021app.use(morgan((tokens, req, res) => {const rawUrl = tokens.url(req, res) ?? "/";const { pathname, search } = new URL(rawUrl, "http://localhost");return JSON.stringify({timestamp: tokens.date(req, res, "iso"),trace_id: tokens["trace-id"](req, res),span_id: tokens["span-id"](req, res),trace_flags: tokens["trace-flags"](req, res),"http.request.method": tokens.method(req, res),"url.path": pathname,...(search && { "url.query": search.slice(1) }),"http.response.status_code": Number(tokens.status(req, res)),"http.response.body.size": Number(tokens.res(req, res, "content-length")),"http.server.request.duration":Number(tokens["response-time"](req, res)) / 1000,"client.address": tokens["remote-addr"](req, res),"user_agent.original": tokens["user-agent"](req, res),});}),);
This outputs:
12345678910111213{"timestamp": "2026-04-16T06:59:34.167Z","trace_id": "60066e40f383ce90bb83e250b5ab0dfb","span_id": "9bf94a55db9b3492","trace_flags": "1","http.request.method": "GET","url.path": "/","http.response.status_code": 200,"http.response.body.size": 15,"http.server.request.duration": 0.002,"client.address": "::1","user_agent.original": "curl/8.5.0"}
A complete production example
Let's bring everything together into a runnable example. This setup uses Morgan
with semantic convention field names, pipes structured JSON through Winston to
stdout, and relies on the OpenTelemetry Winston instrumentation to handle
trace context automatically.
1234567891011121314151617181920212223242526272829303132333435363738394041424344454647484950515253545556575859606162// express.jsimport express from "express";import morgan from "morgan";import winston from "winston";const app = express();// Winston loggerconst logger = winston.createLogger({level: "info",format: winston.format.combine(winston.format.timestamp(),winston.format.json(),),transports: [new winston.transports.Console()],});// Morgan JSON format using OTel semantic conventionsconst jsonFormat = (tokens, req, res) => {const rawUrl = tokens.url(req, res) ?? "/";const { pathname, search } = new URL(rawUrl, "http://localhost");return JSON.stringify({"http.request.method": tokens.method(req, res),"url.path": pathname,...(search && { "url.query": search.slice(1) }),"http.response.status_code": Number(tokens.status(req, res)),"http.response.body.size": Number(tokens.res(req, res, "content-length")),"http.server.request.duration":Number(tokens["response-time"](req, res)) / 1000,"client.address": tokens["remote-addr"](req, res),"user_agent.original": tokens["user-agent"](req, res),});};// Pipe Morgan through Winstonapp.use(morgan(jsonFormat, {stream: {write: (msg) =>logger.info({message: "request",...JSON.parse(msg),}),},}),);// Test routesapp.get("/", (req, res) => {res.json({ status: "ok" });});app.get("/users/:id", (req, res) => {res.json({id: req.params.id,name: "Test User",});});app.listen(3000, () => {logger.info("Server listening on port 3000");});
You need to ensure the OpenTelemetry auto instrumentation packages are installed:
12npm install @opentelemetry/api \@opentelemetry/auto-instrumentations-node
Then use the NODE_OPTIONS environment variable to load the auto
instrumentation before your application code:
1NODE_OPTIONS="--import @opentelemetry/auto-instrumentations-node/register" node express.js
With this in place, a request to /users/42 produces access logs that contain
OpenTelemetry-compliant HTTP attributes and trace context fields:
123456789101112131415{"http.request.method": "GET","http.response.body.size": 30,"http.response.status_code": 200,"http.server.request.duration": 0.00232,"level": "info","message": "request","client.address": "::1","span_id": "9a83dc97bc520d10","timestamp": "2026-04-16T07:15:21.535Z","trace_flags": "01","trace_id": "70c2baacd31e923fc143c2c57a3220d0","url.path": "/users/42","user_agent.original": "curl/8.5.0"}
Final thoughts
Morgan isn't a general-purpose logger. It's a specialist that does one thing well: logging HTTP requests inside Express. Pair it with Winston or Pino for application-level logging, use OTel semantic conventions for your field names, and let the OpenTelemetry instrumentation packages handle trace context, and you've got a solid foundation for production observability without overengineering anything.
For a broader look at how Morgan fits alongside other logging libraries in the Node.js ecosystem, see our guide comparing Node.js logging libraries to help you choose the right one.
