Last updated: October 1, 2026
Evaluating Observability Platforms for Modern Engineering Teams in 2026
If you run a startup with five or ten engineers, nobody on the team has observability as their job. You ship several times a day, the people who write the code also carry the pager, and the observability bill comes out of the same budget as your cloud spend. Whatever tool you pick in year one usually sticks around for years, because by then it's wired into every service, dashboard, and alert you've built.
There's no single best platform for that situation, and any list that claims one deserves suspicion. What you can do is choose your trade-offs on purpose. The rest of this guide covers managed SaaS convenience versus long-term flexibility, how New Relic and Grafana Cloud compare when both make your shortlist, and why OpenTelemetry (OTel) is now the deciding factor for teams that want to keep their options open.
What a small team actually needs from a platform
For a small team, the right platform answers your questions during an incident without creating a second job for whoever maintains it. Everyone agrees with that in principle. Then they evaluate on feature checklists and only find out what they bought when the first invoice arrives.
A recent r/Observability thread on this exact question, one of several collected in Dash0's roundup of Reddit discussions on observability tools, boils the decision down to a handful of competing needs: traces, logs at scale, cost predictability, self-hosting, or "just getting answers fast when prod is on fire." You won't get all of them. Pick the two that matter most before you open a single pricing page.
Managed convenience vs. long-term flexibility
Commercial SaaS wins on day one. You install an agent, dashboards show up, and you're debugging within the hour. The cost arrives later, in steep monthly bills and vendor lock-in, which matches what teams migrating off their first platform tend to report.
Lock-in is rarely about the data itself. It hides in what you build on top, and that layer grows every month.
Instrumentation is the obvious piece. If you used a proprietary agent or SDK, leaving means re-instrumenting every service.
Query language is the next piece. Every dashboard and alert written in a vendor-specific language has to be rewritten somewhere else.
Pricing is the sneakiest one. Per-host, per-seat, per-indexed-GB, and per-custom-metric charges stack up in ways that make the bill hard to forecast as you grow.
Self-hosting gets rid of the vendor bill and hands you an operations job instead. At QCon London 2026, Colin Douch estimated that running your own stack takes an extra two to three full-time engineers. A ten-person startup can't give up a fifth or more of its engineers to that.
What changes when you deploy several times a day
With frequent deploys, the question shifts from "is something broken?" to "did my last change break it?" Your platform has to tie every span, log, and metric to the release that produced it. In OpenTelemetry, you do that by setting the service.version and deployment.environment.name resource attributes alongside service.name. Then check that the backend lets you filter and compare by them.
A couple of other things matter more at high deploy frequency than most checklists admit. You want dashboards and alert rules managed as code, so they ship with the service rather than drifting in a UI. You also want pricing that doesn't punish you for adding attributes. Rich context on every span is how you find the bad deploy quickly, yet some pricing models charge for each new dimension.
Four questions to ask during a trial
After a while, feature checklists all look the same. Every vendor has dashboards and an AI assistant now. The differences only show up when you test with your own services, so put every trial through these questions.
How long until you see a trace from your own service? Not the demo app. Time it from signup to the first useful trace from a real service, and count the hours someone spent on agents, collectors, and config.
What does the bill look like at 5x today's volume? Take your current telemetry numbers, multiply them, and run them through the vendor's pricing page yourself. If you can't do that without a sales call, that tells you something too.
Could you leave within a month? Check whether instrumentation is OpenTelemetry or a proprietary agent. Then check whether dashboards and alerts use an open query language such as PromQL, or one you'd have to rewrite.
Does the AI actually shorten an incident? Replay a real outage from last quarter and see whether it finds the cause faster than your on-call engineer did. Vendor demos always run on incidents the vendor picked.
New Relic vs. Grafana Cloud for a small team
Both show up on a lot of startup shortlists because both have free tiers you can actually use. They suit different teams.
| New Relic | Grafana Cloud | |
|---|---|---|
| Pricing model | Per GB ingested + per full-platform user seat | Base plan + usage per signal (series, GB) |
| Entry cost | 100 GB/month free, then $0.40/GB; Standard plan full users $10 for the first, $99 each after | Free tier with 10k metric series and 50 GB each of logs and traces; Pro from $19/month + usage |
| Setup effort | Hours, per-language agents plus OpenTelemetry Protocol (OTLP) ingest | Days to weeks, including collector setup and dashboard building |
| Query languages | NRQL | PromQL, LogQL, TraceQL (one per signal) |
| Self-hosting | No, SaaS only | Yes, via open source components |
Prices from the New Relic and Grafana Cloud pricing pages as of October 1, 2026. Check them again before you buy.
New Relic gets you started faster. Seats are where it gets expensive. The Standard plan caps how many full platform users you can add, so a growing team ends up on Pro at $349 per user per month with an annual commitment. From then on, the bill tracks headcount rather than data.
Grafana Cloud is built on open source components you can also self-host. You're assembling a stack instead of switching one on, though. Each signal has its own storage and its own query language. If nobody on your team enjoys tuning PromQL and LogQL, you'll pay for it in hours even when the invoice is small.
The shift toward OpenTelemetry-native observability
The strongest recommendation in this guide is to instrument with OpenTelemetry first and choose a backend second. OTel is the Cloud Native Computing Foundation (CNCF) standard for generating and shipping traces, metrics, and logs. Once your services emit OTLP, switching backends means editing your OpenTelemetry Collector configuration. Without OTel, the same switch can take a quarter.
Watch for the word "native" in vendor marketing. Plenty of platforms are OTel-compatible, meaning they accept OTLP and then convert it into an internal format. Semantic attributes get flattened along the way, and before long your dashboards depend on the vendor's schema again.
An OTel-native backend stores the OpenTelemetry data model as it arrives. That way, semantic conventions like http.response.status_code or db.system.name mean the same thing in your code, your Collector, and your queries.
Why traditional APM struggles with AI-era development
Classic application performance monitoring (APM) was built for a handful of long-lived services, each with a vendor agent attached. That model creaks when AI coding tools let a small team spin up a new service in an afternoon. It also creaks when part of your application is a large language model (LLM) call you don't control.
Most of the friction comes from needing an agent per language. If you run an internal developer platform (IDP), you want observability baked into your service templates. With OTel, that's one SDK setup and one Collector configuration in the golden path. With a proprietary agent, every template carries a vendor dependency, and every new runtime has to wait for that vendor to support it.
LLM workloads widen the gap. The OpenTelemetry project's post Inside the LLM Call: GenAI Observability with OpenTelemetry (James Newton-King, May 2026) shows what standard GenAI telemetry looks like.
An agent run produces an invoke_agent span. Under it are child chat spans for each model call and execute_tool spans for each tool call, each named after its operation plus the model, agent, or tool involved. Attributes such as gen_ai.usage.input_tokens record token counts. The gen_ai.client.operation.duration histogram tracks model latency. The GenAI conventions are still experimental, so these names may change.
The post notes that any OTLP-compatible backend can receive this data. You don't need a separate LLM monitoring vendor to find out why an agent was slow. Dash0's guide to the GenAI semantic conventions goes deeper on the attributes.
Leaner pipelines for logs
Plenty of teams still run a dedicated log shipper such as Logstash or Fluentd next to a metrics agent and a tracing agent. Logstash runs on the Java Virtual Machine (JVM) and ships with a 1 GB default heap, which is a lot to give up on a small node. Each extra agent is one more config and upgrade cycle to keep track of, and one more place where data can quietly go missing.
The OpenTelemetry Collector is a single Go binary that receives, processes, and exports all three signals in one pipeline. You can filter noisy logs, redact attributes, and add Kubernetes metadata before anything leaves your cluster. You also don't have to rip out Fluentd on day one, because the Collector can receive Fluent Forward traffic while you migrate.
Comparing open source OpenTelemetry backends
If you've committed to OTel and want to stay on open source, the shortlist usually comes down to the Grafana stack (Loki, Tempo, and Mimir), SigNoz, and OpenObserve. The Grafana stack has the most mature ecosystem, with a separate backend and query language per signal. SigNoz keeps all signals in one OTel-native application and is strongest on traces and APM. OpenObserve stores telemetry on object storage, which makes it the cheap option for long log retention.
Self-host any of them and you're back to the earlier question of how much ops work your team can take on. Their managed tiers remove that work, and you're comparing vendor bills again.
Where Dash0 fits
You're reading this on Dash0's site, so the conclusion probably won't surprise you. Dash0 is an OpenTelemetry-native platform that stores OTLP data as it arrives and queries every signal with PromQL. It uses Perses for dashboards, so your configuration comes with you if you ever leave.
All signals land in one store, each tied to the resource that produced it. When a span is slow, you can go straight to the logs and metrics from the same pod without writing joins or matching labels by hand. That holds across APM, Kubernetes monitoring through the Dash0 Kubernetes Operator, logs, real user monitoring via the Web SDK, synthetic checks, and LLM workloads instrumented with the GenAI semantic conventions.
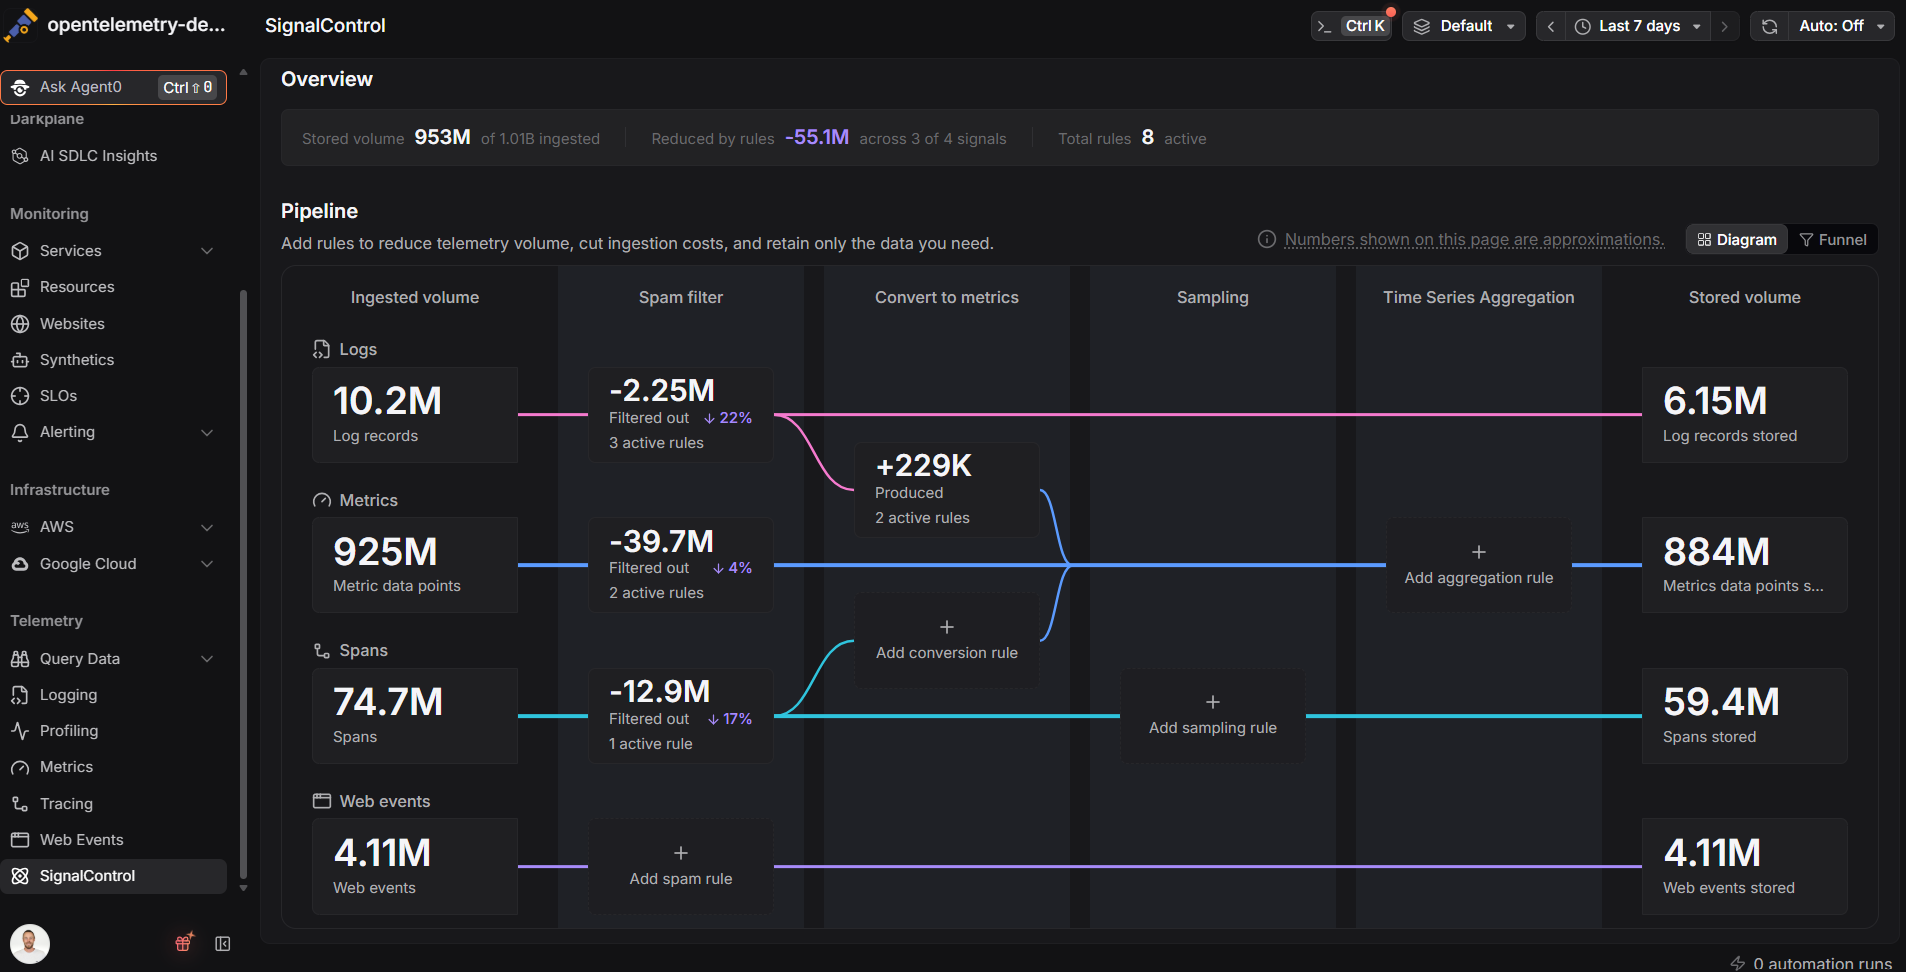
SignalControl cleans that data up before it's stored. It drops spam and samples traces by rules you define, for example keeping every error and slow trace. It also turns high-volume logs and spans into metrics and aggregates metric series, so what you query is smaller and has less noise.
For incidents, there's Agent0, Dash0's AI SRE. It works on the same correlated, filtered data. Ask it why a service is failing and it pulls the relevant traces, logs, and metrics, traces the issue to the offending commit through GitHub or GitLab, and drafts a fix as a pull request for you to review. It can also turn a plain-language description or an investigation's findings into dashboards and alert rules.
Autonomy is progressive. You start by approving each action. Later you move to reviewing what it did after the fact, and you hand over more as you come to trust it.
On pricing, Dash0 charges per million spans, log records, web events, or metric data points, plus synthetic API checks, with no per-seat charge for observability. Adding engineers doesn't change the bill, and neither do richer span and log attributes. High-cardinality metric labels do add data points, which is where SignalControl's aggregation helps. A monthly budget limit and a cost forecast are built in. Agent0 is billed separately, with task-based credits at $0.60 each. How many credits a task uses depends on how much work it takes and which model level you pick.
Final thoughts
For a startup with a small team, the best observability platform is the one you won't have to replace in two years. Work out which needs matter most and instrument everything with OpenTelemetry. Then judge backends on how they price growth and how quickly they get you to a root cause. A long integration list looks good in a sales deck and doesn't help much during an outage.
The cheapest way to start is with one service. Instrument it with the OpenTelemetry SDK for your language, route it through a Collector, and send the same data to two backends for a week. Then put both through the four trial questions above before you sign anything.
Dash0 has a 14-day free trial, no credit card required. To dig further into the alternatives, read Dash0's comparison of observability tools.