Last updated: March 11, 2026
Mastering the OpenTelemetry Transform Processor
The OpenTelemetry Collector includes a wide range of processors for common, well-defined tasks. You can use the attributes processor to manipulate key-value pairs, the resource processor to modify resource-level metadata, and several others for filtering, batching, or routing telemetry.
Eventually, however, you run into a requirement that does not fit neatly into any of those boxes. You might need to restructure a log body, compute a new attribute from two existing fields, convert a metric type, or promote a record-level attribute to the resource level. At that point, the purpose-built processors stop being enough, and you need something more expressive.
That's where the transform processor comes in.
The transform processor is powered by the OpenTelemetry Transformation Language (OTTL), a domain-specific language designed for manipulating telemetry as it flows through the Collector. You'll write declarative statements that execute against spans, log records, or metric data points, and the Collector evaluates them in order.
The official docs explain what the processor can do, but it often leaves open questions about why certain patterns exist, what happens when you misconfigure a statement, or how to debug transformations that appear to have no effect. This guide fills those gaps.
You'll start with the mental model behind the processor, then move through practical patterns and production-ready techniques so you can use the transform processor confidently in real systems.
Let's begin!
What the transform processor is actually doing
Before touching configuration, it helps to have a mental model of how the processor executes. Without that model, OTTL statements can feel unpredictable, especially when they silently do nothing.
When a batch of telemetry reaches the processor, it is traversed hierarchically. For traces, the processor walks through each resource span, then each scope span, and finally each individual span and its span events. For logs, it walks each resource log, then each scope log, and then each log record. For metrics, it traverses resource metrics, scope metrics, each metric, and finally every data point within that metric.
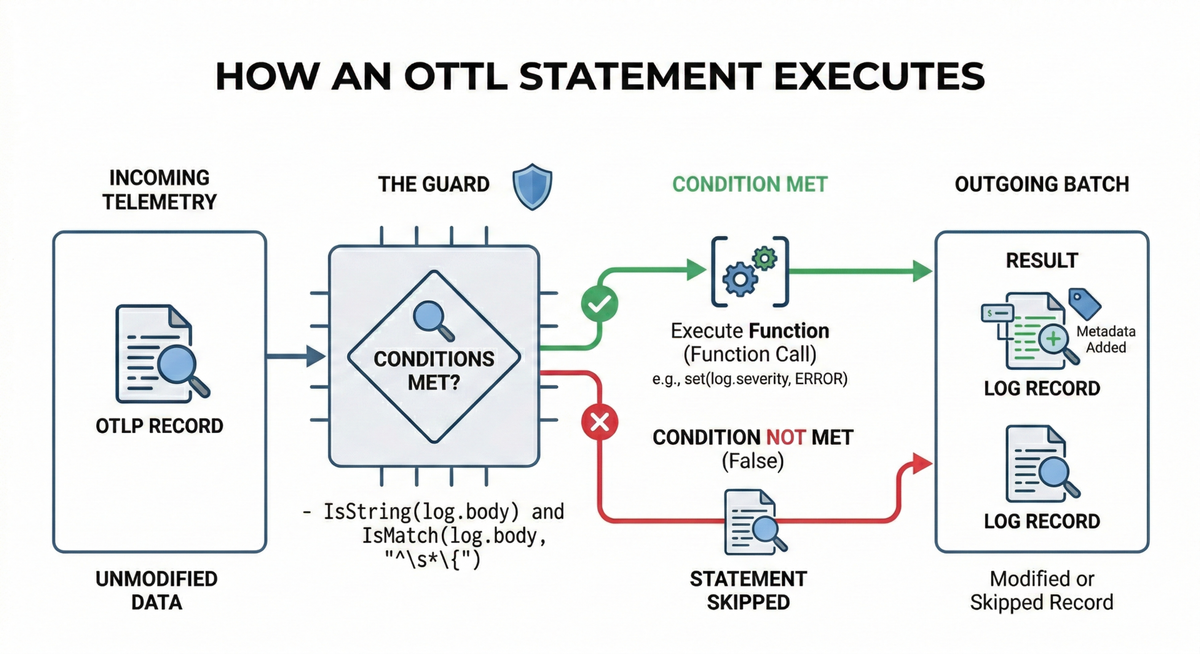
Each statement is effectively a function call with an optional where clause.
This clause acts as a guard, so the function runs only when the condition
evaluates to true. Statements execute strictly in the order you define them,
which becomes critical once you start chaining operations that depend on earlier
mutations.
The data model you're operating on follows the OpenTelemetry Protocol (OTLP) structure directly. This means you have access to resource attributes, instrumentation scope metadata, and every field on spans, logs, and metrics. However, you must reference them with the correct path for the signal and level you're targeting.
For example, using span.attributes inside a log statement will produce a parse
error because logs do not expose a span context. In contrast,
resource.attributes works across traces, logs, and metrics because
every signal carries resource information.
Understanding these boundaries is the key to writing transformations that behave
exactly the way you expect.
Quick start: Parsing and promoting fields with OTTL
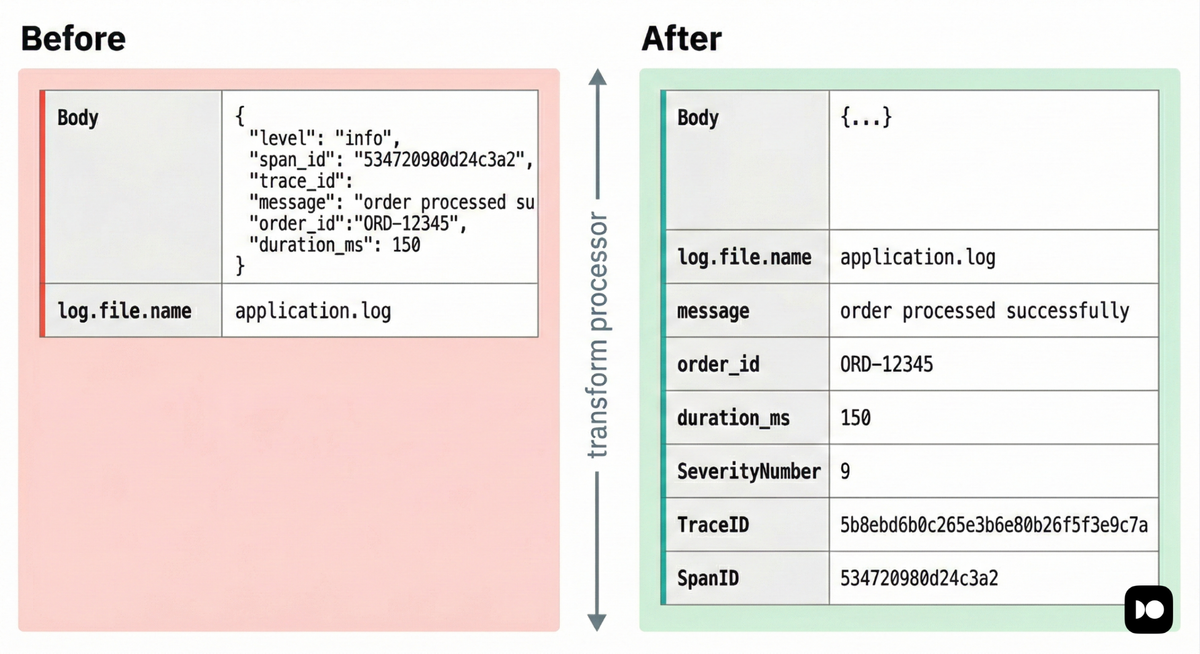
One thing the transform processor can do that no other Collector processor can handle on its own is parse a structured JSON log body and promote its fields into proper attributes in a single pipeline step, without external tooling.
Consider a common scenario where your application writes JSON logs like this into log files:
12345678{"level": "error","message": "payment gateway timeout","order_id": "ord_8821","duration_ms": 5023,"trace_id": "4bf92f3577b34da6a3ce929d0e0e4736","span_id": "a3ce929d0e0e4736"}
When the Collector ingests these logs through the
filelog receiver,
the entire JSON object is treated as a plain string and stored in log.body.
Nothing inside it is automatically parsed or promoted to LogRecord attributes (except the json_parser stanza operator is used).
From your backend's perspective, that means this record is just opaque text. You
cannot filter by level, you cannot alert on duration_ms, and the trace_id
embedded in the body is not wired to the actual trace context field used for
correlation.
The transform processor allows you to parse that JSON, extract its fields, and map them into proper OpenTelemetry log attributes and context fields in a single, centralized step.
Setting up the demo
Go ahead and create a directory with three files. First, a log file that the Collector will tail:
123456# app.log{"level":"info","message":"server started","port":8080}{"level":"info","message":"user login successful","user_id":"usr_4421","trace_id":"4bf92f3577b34da6a3ce929d0e0e4736","span_id":"a3ce929d0e0e4736"}{"level":"warn","message":"high memory usage","percent":87.4,"host":"node-3","trace_id":"b7ad6b7169203331d166c7b39e74e7e3","span_id":"d166c7b39e74e7e3"}{"level":"error","message":"payment gateway timeout","order_id":"ord_8821","duration_ms":5023,"trace_id":"a3ce929d0e0e47364bf92f3577b34da6","span_id":"4bf92f3577b34da6"}{"level":"error","message":"database connection lost","retries":3,"trace_id":"d0e0e47364bf92f3577b34da6a3ce929","span_id":"77b34da6a3ce929d"}
Next, define the Collector configuration:
12345678910111213141516171819202122232425262728293031323334353637383940414243444546474849# otelcol.yamlreceivers:filelog:include: [app.log]start_at: beginningprocessors:transform:error_mode: ignorelog_statements:- conditions:- IsString(log.body) and IsMatch(log.body, "^\\s*\\{")statements:- merge_maps(log.cache, ParseJSON(log.body), "upsert")# Option 1: Promote ALL parsed fields into log attributes in one shot.- merge_maps(log.attributes, log.cache, "upsert")# Option 2 (alternative to above): Promote only known, safe fields.# - set(log.attributes["level"], log.cache["level"])# - set(log.attributes["order_id"], log.cache["order_id"])# - set(log.attributes["duration_ms"], log.cache["duration_ms"])# Option 3 (hybrid): Promote everything, then clean up redundant fields# - merge_maps(log.attributes, log.cache, "upsert")# - delete_key(log.attributes, "internal_debug_field")# - set(log.attributes["duration_ms"], log.attributes["dur"])# - delete_key(log.attributes, "dur")# Structural fields that need special handling regardless of approach —# these are NOT regular attributes and must be set explicitly because# merge_maps cannot write to typed top-level OTLP fields.- set(log.trace_id.string, log.cache["trace_id"]) where log.cache["trace_id"] != nil- set(log.span_id.string, log.cache["span_id"]) where log.cache["span_id"] != nil- set(log.severity_text, log.cache["level"]) where log.cache["level"] != nil- set(log.severity_number, SEVERITY_NUMBER_ERROR) where log.cache["level"] == "error"- set(log.severity_number, SEVERITY_NUMBER_WARN) where log.cache["level"] == "warn"- set(log.severity_number, SEVERITY_NUMBER_INFO) where log.cache["level"] == "info"exporters:debug:verbosity: detailedservice:pipelines:logs:receivers: [filelog]processors: [transform]exporters: [debug]
Finally, add a Docker Compose file to run the Collector:
1234567# docker-compose.yamlservices:otelcol:image: otel/opentelemetry-collector-contrib:0.146.1volumes:- ./otelcol.yaml:/etc/otelcol-contrib/config.yaml- ./app.log:/app.log
Start everything with:
1docker compose up -d
What to look for in the output
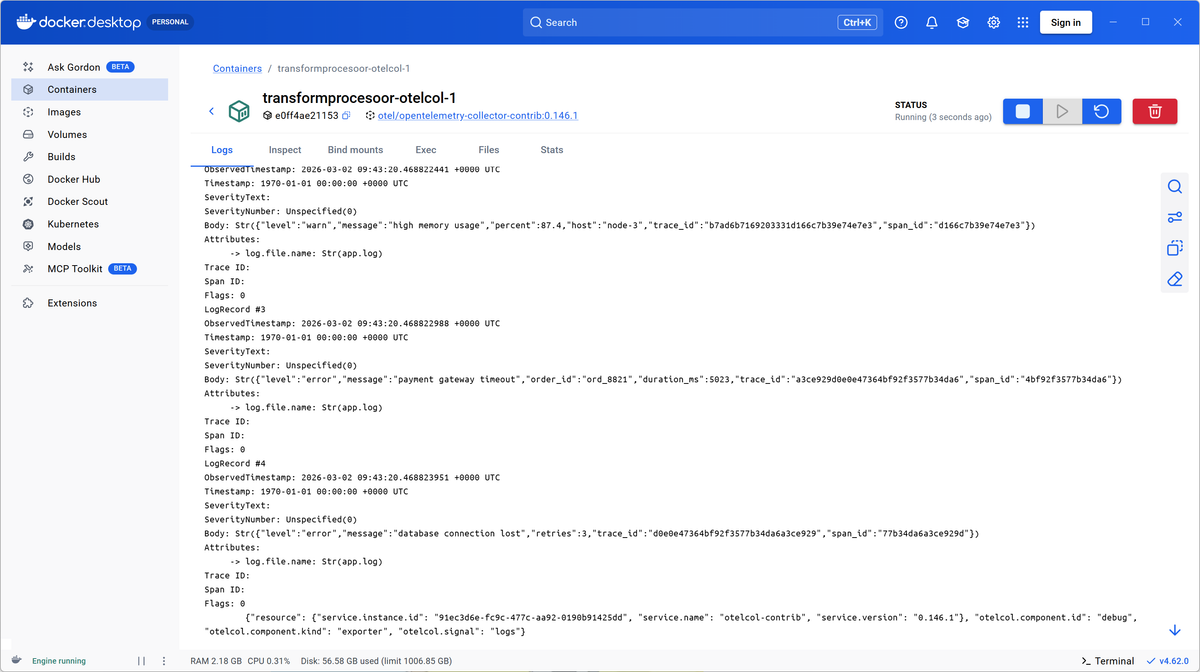
Without the transform processor,
the debug exporter
would show each log record with a raw string body and only the attributes added
by the filelog receiver:
12345678LogRecord #3ObservedTimestamp: ...Body: Str({"level":"error","message":"payment gateway timeout","order_id":"ord_8821","duration_ms":5023,"trace_id":"a3ce929d0e0e47364bf92f3577b34da6"})Attributes:-> log.file.name: Str(app.log)Trace ID:Span ID:Flags: 0
With the transform processor enabled, the same record is decomposed and
normalized before export:
123456789101112131415LogRecord #3ObservedTimestamp: 2026-03-02 07:01:01.578273845 +0000 UTCTimestamp: 1970-01-01 00:00:00 +0000 UTCSeverityText: errorSeverityNumber: Error(17)Body: Str({"level":"error","message":"payment gateway timeout","order_id":"ord_8821","duration_ms":5023,"trace_id":"a3ce929d0e0e47364bf92f3577b34da6","span_id":"4bf92f3577b34da6"})Attributes:-> log.file.name: Str(app.log)-> level: Str(error)-> message: Str(payment gateway timeout)-> order_id: Str(ord_8821)-> duration_ms: Double(5023)Trace ID: a3ce929d0e0e47364bf92f3577b34da6Span ID: 4bf92f3577b34da6Flags: 0
Three important transformations occurred in a single processor:
- The JSON body was parsed and its fields became queryable attributes.
- The severity fields were populated so backends can filter and alert by level.
- The trace IDs were moved from a plain string in the body into the proper OTLP field, enabling automatic correlation with traces.
There are a few patterns here that you'll reuse throughout this guide.
First, the group-level conditions block acts as a gate. The entire set of
statements only runs for records whose body looks like a JSON object. Non-JSON
logs pass through untouched.
Second, ParseJSON() deserializes the body into an OTTL map value, then
merge_maps() writes that map into log.cache, which is a temporary scratch
space available only during evaluation. You'll then extract fields from the
cache and place them into their final locations.
Third, the log.trace_id.string accessor is specific to
OTTL's type system.
The top-level trace_id field expects bytes internally, and the .string
suffix tells OTTL to accept a hex string and convert it automatically. Without
it, the assignment fails silently in ignore mode because the types do not
align.
Now that you have seen the transform processor in action, it is time to look at
a setting that will save you from subtle data loss before you go further:
error_mode.
Understanding and configuring error modes
The error_mode setting is the first thing you should get right, because its
default behavior often surprises people.
At the processor level, the default is propagate. This means if any OTTL
statement encounters a type error, references a missing field, or calls a
function with invalid arguments, the entire batch is rejected and the error is
returned up the pipeline.
In development, this is helpful as it forces you to fix mistakes immediately. In production, however, it can turn messy real-world telemetry into guaranteed data loss since a single malformed record can cause every record in that batch to be dropped.
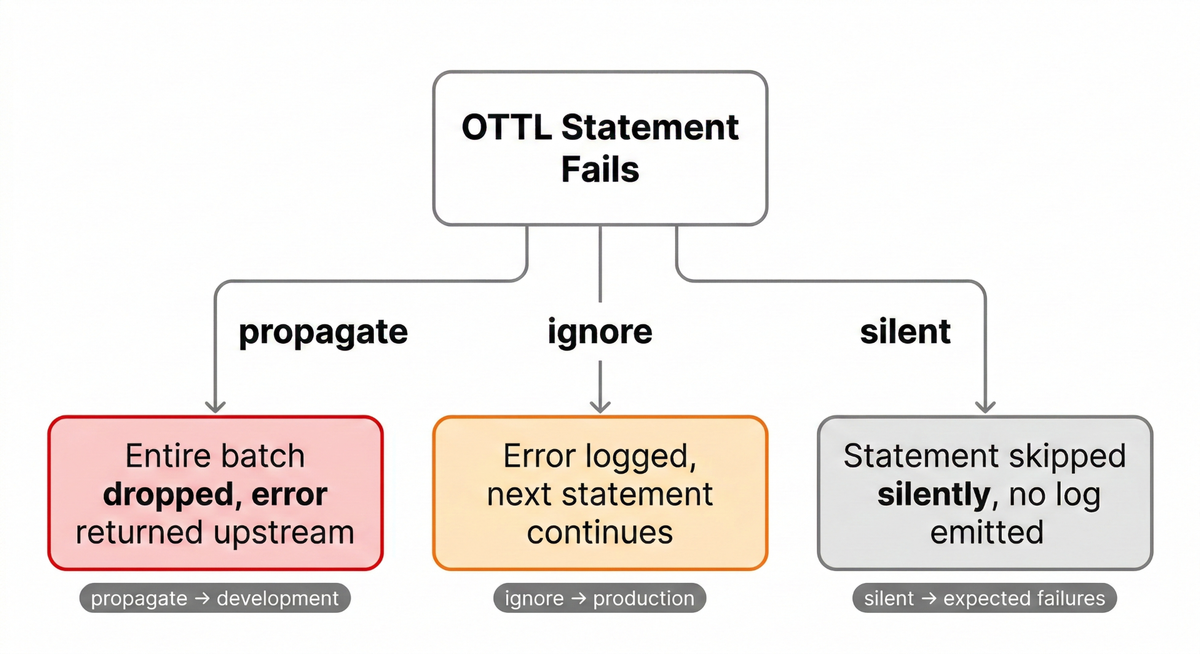
The three available options behave very differently:
ignore: Logs the error and continues with the next statement. This is almost always the right choice in production.silent: Skips the failing statement without logging anything. Use this only when you intentionally expect certain records to fail and want to avoid log noise.propagate: Returns the error upstream and drops the payload. This is useful in development or when a failed transformation should halt the pipeline.
You can define a safe default at the top level and override it for specific statement groups that must succeed:
12345678transform:error_mode: ignore # safe default for most statementslog_statements:- error_mode: propagate # this group must succeed or the batch is droppedstatements:- set(log.attributes["account_id"], log.attributes["required_account_id"])- statements: # inherits top-level "ignore"- set(log.attributes["region"], resource.attributes["cloud.region"])
In this configuration, most statements tolerate imperfect data. However, the first group enforces strict correctness and drops the batch if it fails.
To see why this matters, add the following statement to the demo configuration
from the quick start, immediately after merge_maps():
1- set(log.attributes["x"], Split(log.cache["duration_ms"], ","))
This statement attempts to call Split() on duration_ms. That field is
numeric, not a string, and it does not even exist on every record. The function
therefore fails for multiple reasons.
Run the demo with docker compose up -d --force-recreate and you'll see a
"failed to execute statement" log in the Collector logs:
123456789101112132026-03-02T07:24:36.761Z warn ottl@v0.146.0/parser.go:410 failed to execute statement {"resource": {"service.instance.id": "ea76a497-ab58-4aca-8059-46fb486781ed","service.name": "otelcol-contrib","service.version": "0.146.1"},"otelcol.component.id": "transform","otelcol.component.kind": "processor","otelcol.pipeline.id": "logs","otelcol.signal": "logs","error": "expected string but got nil","statement": "set(log.attributes[\"duration_parts\"], Split(log.cache[\"duration_ms\"], \",\"))"}
Two important observations follow:
-
The Collector logs the error and continues processing. Statements before the failing one have already run, and statements after it still execute for the same record.
-
The error message includes the exact statement and type mismatch. This makes
ignoreboth safe and practical for diagnosing issues while keeping your pipeline operational.
Now switch error_mode to propagate and recreate the Collector again. This
time, no records reach the exporter. Instead, you see an error similar to:
1234567891011122026-03-02T07:37:54.301Z error logs/processor.go:62 failed processing logs {"resource": {"service.instance.id": "ad4bcf8d-101b-4f79-a6c5-7fe95cbbb51e","service.name": "otelcol-contrib","service.version": "0.146.1"},"otelcol.component.id": "transform","otelcol.component.kind": "processor","otelcol.pipeline.id": "logs","otelcol.signal": "logs","error": "failed to execute statement: set(log.attributes[\"duration_parts\"], Split(log.cache[\"duration_ms\"], \",\")), expected string but got nil"}
In this mode, the error bubbles up and the batch is dropped entirely. That is exactly what you want in a controlled test environment where you are validating transformations.
Choosing the right error mode is not just a configuration detail; it determines whether your transform processor behaves like a strict validator or a resilient data normalizer.
The path system: how to address your data
Every OTTL statement operates on paths. They are dot-separated identifiers that point to a specific field in the OpenTelemetry data model. If you don't understand the path system, your statements will either fail to parse or silently operate on the wrong level.
Each signal type exposes a fixed set of top-level prefixes:
| Signal | Available path prefixes |
|---|---|
trace_statements | resource, scope, span, spanevent |
metric_statements | resource, scope, metric, datapoint |
log_statements | resource, scope, log |
If you reference span.attributes inside a log_statements block, or
datapoint.attributes inside a trace_statements block, the Collector fails to
start with a configuration error as the transform processor validates paths at
startup, not at runtime.
Within each prefix, you can reference fields according to the OTLP structure. For example:
1234567891011121314151617181920212223242526272829# Common paths for logslog.body # the log body (any OTTL value type)log.severity_number # numeric severity (SeverityNumber enum)log.severity_text # string severitylog.attributes["key"] # a specific log attributelog.trace_id # the trace ID byteslog.span_id # the span ID bytes# Common paths for spansspan.name # span namespan.kind # SpanKind enumspan.attributes["key"] # a specific span attributespan.status.code # StatusCode enumspan.start_time # start timestampspan.end_time # end timestamp# Common paths for metricsmetric.name # metric name stringmetric.description # metric description stringmetric.unit # metric unit stringmetric.type # MetricDataType enumdatapoint.attributes["key"] # a datapoint attributedatapoint.value # the numeric value (gauge/sum)# Resource and scope paths (available across all signals)resource.attributes["key"]scope.namescope.versionscope.attributes["key"]
Attribute access always uses bracket notation with a string key, such as
log.attributes["http.status_code"]. If the key does not exist, the expression
evaluates to nil rather than throwing an error. You can combine it with
where clauses to guard transformations:
1- set(log.attributes["status_class"], "5xx") where log.attributes["http.status_code"] >= 500
As you write more advanced transformations, you'll often move data across levels. For example, you might promote a log attribute to a resource attribute, or copy a span attribute into an event.
The path prefix tells OTTL exactly which layer of the telemetry hierarchy you're targeting. Getting that prefix right is the difference between a precise mutation and a configuration that never starts.
To see the full list of available paths for each OpenTelemetry signal, refer to the official OTTL context documentation below. Each context defines the fields and accessors that are valid within that specific prefix:
| Telemetry | OTTL context |
|---|---|
Resource | Resource |
Instrumentation Scope | Instrumentation Scope |
Span | Span |
Span Event | SpanEvent |
Metric | Metric |
Datapoint | DataPoint |
Log | Log |
Profile | Profile |
OTTL in the transform processor
If you're new to OTTL,
this guide
walks through its syntax, operators, path expressions, and function library in
detail. Here, we'll focus only on two concepts that are crucial to how the
transform processor embeds and executes OTTL: the cache field and context
inference.
Using cache as a scratch space
When working with OTTL in the transform processor, you'll often see references
to a cache field such as log.cache or span.cache. This is not a built-in
OTLP field that automatically exists on every record. It's simply a conventional
pattern: a temporary map that you create and use as scratch space within a
statement group.
The transform processor allows you to write to cache and read from it within
the same evaluation cycle. Anything stored there exists only while the current
record is being processed and is not available downstream unless you explicitly
copy it somewhere else.
This pattern is especially useful when a transformation cannot be expressed cleanly in a single statement. JSON parsing is the most common example as seen in the previous examples:
1234log_statements:- merge_maps(log.cache, ParseJSON(log.body), "upsert")- set(log.attributes["level"], log.cache["level"])- set(log.attributes["request_id"], log.cache["request_id"])
Here, ParseJSON() returns a map and merge_maps() writes that map into
log.cache. Subsequent statements then read values from the cache and promote
them into structured log attributes.
You can apply the same approach for intermediate computations. If several
statements depend on a derived value, compute it once, store it in cache, and
reference it in later statements. This keeps your configuration readable and
avoids repeating complex expressions across multiple lines.
Context inference
The transform processor does not execute all statements at the same level of the telemetry hierarchy. Instead, it infers the correct OTTL context from the path prefixes used in your statements, then iterates at that level.
Possible contexts include resource, scope, span, spanevent, metric,
datapoint, and log. In most cases, this inference is automatic and
invisible.
It becomes relevant when you mix paths that belong to incompatible contexts within the same statement group.
For example, convert_sum_to_gauge() operates at the metric context level,
while datapoint.attributes belongs to the datapoint context:
123metric_statements:- convert_sum_to_gauge() where metric.name == "process.cpu.time"- limit(datapoint.attributes, 10, ["host.name"])
This configuration fails at startup because the processor cannot infer a single valid context for the group. You'll see an error similar to:
12345678Error: invalid configuration: processors::transform:unable to infer a valid context (["resource" "scope" "metric" "datapoint"])from statements ["convert_sum_to_gauge() where metric.name == \"process.cpu.time\"""limit(datapoint.attributes, 10, [\"host.name\"])"]and conditions []:inferred context "datapoint" does not support the function "convert_sum_to_gauge"
The fix is to split the statements into separate groups so each group can be inferred independently:
12345metric_statements:- statements:- convert_sum_to_gauge() where metric.name == "process.cpu.time"- statements:- limit(datapoint.attributes, 10, ["host.name"])
If the Collector refuses to start with a context-related parse error, this is almost always the reason. Separate incompatible contexts into distinct statement groups and let the processor infer each one cleanly.
Configuring conditions and statement groups
At its simplest, the transform processor accepts a flat list of statements.
This works well for simple use cases, but it starts to fall apart once you need
different error modes, different contexts, or a shared gate that should apply to
multiple statements.
Statement groups solve that problem by creating an object with its own
context, error_mode, and conditions, plus a statements list. You can
think of it as a mini-rule block: match some records, then run a set of
statements against them.
123456789101112131415161718transform:error_mode: ignorelog_statements:- conditions:- IsMatch(log.body, "^\\{")statements:- merge_maps(log.cache, ParseJSON(log.body), "upsert")- set(log.attributes["parsed.level"], log.cache["level"])- set(log.attributes["parsed.message"], log.cache["message"])- set(log.attributes["parsed.timestamp"], log.cache["timestamp"])- conditions:- log.severity_number == SEVERITY_NUMBER_UNSPECIFIEDstatements:- set(log.severity_number, SEVERITY_NUMBER_INFO) where IsMatch(log.body, "\\sINFO[:\\s]")- set(log.severity_number, SEVERITY_NUMBER_WARN) where IsMatch(log.body, "\\sWARN(ING)?[:\\s]")- set(log.severity_number, SEVERITY_NUMBER_ERROR) where IsMatch(log.body, "\\sERROR[:\\s]")
Two details about conditions matter more than they look:
-
Group conditions are ORed together. If you list three conditions, the group runs when any one of them evaluates to true. If you need
ANDlogic, write it as a single expression withand, or push the logic down into statement-levelwhereclauses.For example, this group runs only when both checks pass:
yaml1234- conditions:- IsString(log.body) and IsMatch(log.body, "^\\{")statements:- merge_maps(log.cache, ParseJSON(log.body), "upsert") -
Group conditions are evaluated before statement guards. A record must pass the group's
conditionsto enter the group at all. Once it enters, each statement'swhereclause is evaluated independently.
In other words, the group condition is the coarse gate, while where clauses
are fine-grained guards. This layering is what makes statement groups useful for
large configurations: you can cheaply route records into the right group, then
apply precise logic statement by statement without repeating the same top-level
checks.
The flatten_data option for log transformations
To understand why this option exists, you need to understand how OTLP groups log records on the wire.
OTLP does not transmit log records as a flat list. Instead, it groups them
hierarchically with multiple records nested under a shared ScopeLogs, which is
nested under a shared ResourceLogs. If a hundred records all come from the
same resource, there's no point in repeating the same resource
attributes a hundred times.
123456ResourceLogsresource.attributes: {service.name: "payments", host.name: "node-3"}ScopeLogsLogRecord #1 ← shares the resource aboveLogRecord #2 ← shares the resource aboveLogRecord #3 ← shares the resource above
This is efficient for transport, but it can lead to subtle data corruption the moment you write
to resource.attributes based on a per-record value.
The silent data loss problem
Consider this transformation, which promotes kubernetes.pod.name from a log
attribute to the resource level:
1234transform:log_statements:- set(resource.attributes["k8s.pod.name"], log.attributes["kubernetes.pod.name"])- delete_key(log.attributes, "kubernetes.pod.name")
Now imagine a batch arrives with three records that share a single resource, but originate from different pods:
123456ResourceLogsresource.attributes: {service.name: "payments"}ScopeLogsLogRecord #1 log.attributes["kubernetes.pod.name"] = "payments-7d4b-xkqvp"LogRecord #2 log.attributes["kubernetes.pod.name"] = "payments-7d4b-xkqvp"LogRecord #3 log.attributes["kubernetes.pod.name"] = "payments-7d4b-mnrtz"
Without flatten_data, the processor walks the records sequentially and writes
to the shared resource each time. The last writer wins:
123456789ResourceLogsresource.attributes: {service.name: "payments",k8s.pod.name: "payments-7d4b-mnrtz" ← last writer wins}ScopeLogsLogRecord #1 ← pod name deleted, now attributed to wrong podLogRecord #2 ← pod name deleted, now attributed to wrong podLogRecord #3 ← correct
Two out of three records are now misattributed. No error is raised, and nothing
in the Collector output makes the loss obvious. This is the failure mode that
flatten_data is designed to prevent.
What flatten_data actually does
When you enable flatten_data: true, each log record gets its own private copy of the resource and scope:
123LogRecord #1 + private copy of resourceLogRecord #2 + private copy of resourceLogRecord #3 + private copy of resource
Transformations now write to isolated copies, so there is no contention. After
all statements have executed, the processor regroups records by their final
resource and scope attribute sets. Records that end up with identical resources
are collapsed together again. Records that diverge become separate
ResourceLogs entries.
For the example above, you end up with two resource groups:
12345678910ResourceLogsresource.attributes: {service.name: "payments", k8s.pod.name: "payments-7d4b-xkqvp"}ScopeLogsLogRecord #1LogRecord #2ResourceLogsresource.attributes: {service.name: "payments", k8s.pod.name: "payments-7d4b-mnrtz"}ScopeLogsLogRecord #3
Each record is now attributed to the correct pod.
Enabling flatten_data
This capability is behind a feature gate, which means it's not enabled by default and may still evolve. You must pass the flag explicitly at startup:
1234567# docker-compose.yamlservices:otelcol:image: otel/opentelemetry-collector-contrib:0.146.1command: ["--config=/etc/otelcol-contrib/config.yaml", "--feature-gates=transform.flatten.logs"]volumes:- ./otelcol.yaml:/etc/otelcol-contrib/config.yaml
If you set flatten_data: true in the config but omit the feature gate, the
Collector will refuse to start. If you pass the feature gate but omit
flatten_data: true, nothing changes. You need both.
Because this is a feature gate, review the Collector changelog when upgrading. Feature-gated options may become stable (no flag required) or be removed in a later release. If you depend on this behavior, pin the Collector image and upgrade intentionally.
When flatten_data is the wrong solution
Before you reach for flatten_data, make sure that attribute promotion to the resource
level is actually the right goal.
Resource attributes describe the origin of telemetry, not the content of an individual record, so a pod name belongs on the resource because it identifies where the telemetry was produced, but an order ID does not.
If all you need is promotion and regrouping, the groupbyattrs processor is purpose-built for that job and does not require a feature gate.
12345processors:groupbyattrs:keys:- kubernetes.pod.name- kubernetes.namespace.name
Reserve flatten_data for cases where you need per-record resource isolation
and the full expressiveness of OTTL in the same pipeline, and where
groupbyattrs alone is not enough.
Debugging OTTL statements
Even with a solid mental model of paths, contexts, and error modes, you will eventually write a statement that appears to do nothing. The Collector starts cleanly, no errors are logged, and yet the data looks unchanged downstream.
This almost always comes down to one of three causes:
- The specified
conditions are evaluating tofalse. - The path you are referencing does not exist on the records.
- A type mismatch is being quietly skipped because you are running with
error_mode: ignore.
Rather than guessing, you can make the processor show you exactly what it's doing. The following techniques give you visibility into statement execution and make OTTL behavior much easier to reason about.
Enable debug logging
The transform processor can emit detailed debug logs that show the full
TransformContext before and after each statement. This includes the evaluated
condition result and the exact field values.
Here's how to enable debug-level logging in the Collector:
1234service:telemetry:logs:level: debug
With this enabled, you will see entries similar to:
123456789101112debug ottl/parser.go TransformContext after statement execution{"statement": "set(log.attributes[\"environment\"], \"production\")","condition matched": true,"TransformContext": {"log_record": {"attributes": {"environment": "production"}}}}
If the "condition matched" field is false, your where clause or
group-level condition is preventing execution. If it's true but the field does
not change as expected, you likely have a type mismatch or are writing to a
different path than you intended.
Debug logging is extremely verbose, so it'll generate an overwhelming amount of output in a production-volume pipeline. Use it with a test Collector and a controlled data source, then disable it before deploying changes.
Use the debug exporter to verify results
Another practical technique is to pair the transform processor with the debug
exporter and
split your pipeline into a before-and-after chain
to give you a clear comparison view.

Compare the two outputs and the change should be immediately visible. If the before and after are identical, your statement isn't matching anything — which narrows the problem down to the condition or the path.
Production best practices for safe transformations
The following practices help you avoid the most common operational and semantic
pitfalls when using the transform processor in production environments.
1. Treat metric transformations with care
Not all metric conversions are semantically safe.
Functions such as convert_gauge_to_sum() and convert_sum_to_gauge()
reinterpret the meaning of the data, and the OpenTelemetry data model does not
define a canonical mapping between these types. If a Gauge represents an
instantaneous measurement, converting it into a cumulative Sum asserts a
property that may not be true.
Before converting metric types, confirm that the underlying data really has the semantics you are assigning to it. Otherwise, backends may process the transformed metric incorrectly.
Be equally cautious when modifying metric identity. Changing metric.name,
removing datapoint attributes, or altering dimensions can cause a metric stream
to disappear and a new one to appear from your backend's perspective. Dashboards
and alert rules tied to the original name or label set will break.
Adding attributes is generally safe. Removing attributes or renaming metrics should be done deliberately and with full awareness of the impact.
2. Preserve trace and log relationships
Trace context fields are structural, not cosmetic. Modifying span.trace_id,
span.span_id, span.parent_span_id, log.trace_id, or log.span_id can
disconnect spans from their parents and break log-to-trace correlation.
Promoting an existing attribute into the correct top-level field is fine as long as the value is already correct. Generating or rewriting IDs arbitrarily will produce orphaned telemetry that is difficult or impossible to reconstruct.
3. Choose the right error mode
Real telemetry is rarely perfectly clean. With propagate, a single unexpected
nil value can cause an entire batch to be dropped. Use propagate in testing
to surface errors early, then switch to ignore for live traffic.
4. Keep transformations focused and modular
Long, monolithic statement lists are difficult to reason about and even harder to debug. If you find yourself mixing unrelated concerns such as normalization, enrichment, and redaction in one processor, split them into multiple named instances:
transform/normalizetransform/enrichtransform/redact
The Collector supports multiple instances of the same processor type using the
/name suffix. Smaller, purpose-built processors are easier to validate and
maintain.
5. Scope statements with where clauses
Every statement without a condition runs on every record. In high-volume
pipelines, unconditional regex matching or complex expressions add up quickly.
Use where clauses aggressively to limit work to the records that actually need
transformation.
6. Be explicit about nil handling
Accessing a missing attribute returns nil, not an error. Passing nil into a
function that expects a specific type will fail under strict error modes or be
silently skipped. Therefore, guard optional fields explicitly:
12- set(span.attributes["normalized"], ToLower(span.attributes["optional_key"]))where span.attributes["optional_key"] != nil
This pattern prevents an entire class of subtle failures.
7. Respect statement ordering
Statements execute sequentially so if statement B depends on the output of statement A, it must come after A. If statement C deletes an attribute that statement D needs, D must come first. When transformations grow beyond a few lines, sketch the dependency order before writing the configuration.
8. Validate before deploying
Always validate changes with the debug exporter or a controlled test pipeline
before rolling them into production. This is especially critical for metric
transformations, where identity changes can silently break dashboards for as
long as it takes someone to notice.
The transform processor is at its best when used deliberately and with a clear
mental model. Apply transformations conservatively, validate them carefully, and
preserve the meaning of your telemetry above all.
Final thoughts
The transform processor is the most versatile component in the Collector's
processor ecosystem for manipulating telemetry data in transit. Once you
internalize the path prefix system, understand context inference, and get
comfortable with OTTL's expression model, the configuration becomes both
predictable and powerful.
The patterns covered in this guide, including JSON parsing, trace context correlation, attribute promotion, severity extraction, and normalization, represent the majority of real-world production use cases.
When the transformed data reaches an OpenTelemetry-native platform such as Dash0, which is natively built on OTLP, clean structure turns directly into practical benefits. Queries become simpler, alerting becomes more reliable, and traces, logs, and metrics correlate in the way they were designed to.
If you'd like to see the difference well-shaped telemetry makes, you can try Dash0 for free and explore your data with the structure preserved end to end.
