Last updated: May 19, 2026
Bridging Python's Logging Module to OpenTelemetry (Complete Guide)
Python's logging module gives you structured output with hierarchical loggers, handlers, and formatters, but the records it produces are disconnected from the rest of your observability stack by default.
Those records need to reach an observability pipeline where they can be transformed into OpenTelemetry-compliant log records, correlated with traces, enriched with resource attributes, and shipped to whatever observability backend your team uses.
The OpenTelemetry Python SDK includes a LoggingHandler that bridges this gap.
It plugs into Python's standard logging infrastructure as a regular handler,
converts each LogRecord into an OTel log record, and exports it via the
OpenTelemetry Protocol (OTLP) without requiring you to change your logging
calls.
This guide walks through the full setup: from wiring the OTel handler, to inspecting the resulting OTel log records in a Collector, correlating them with traces, and shipping everything to a production backend.
Prerequisites
You'll need the following to follow along:
- Python 3.14 or later.
- A Python web application (we'll use FastAPI in the examples, but any framework works).
- An OpenTelemetry Collector instance to see the pipeline in action.
- Familiarity with Python's standard
loggingmodule (see our Python logging guide if you need a refresher).
Setting up the demo: a FastAPI app with JSON logging
To demonstrate the concepts we'll be exploring in this tutorial, let's set up a small FastAPI application with JSON logging. If you've read our Python logging guide, this is a condensed version of the patterns covered there.
Create a project directory and a virtual environment:
123mkdir python-otel-logging && cd python-otel-loggingpython -m venv .venvsource .venv/bin/activate
Then install the necessary dependencies:
1pip install fastapi uvicorn python-json-logger pyyaml
Create a logging.yaml that configures a JSON formatter via
python-json-logger and routes
both your application logs and uvicorn's logs through the same handler:
123456789101112131415161718192021222324# logging.yamlversion: 1disable_existing_loggers: falseformatters:json:class: pythonjsonlogger.json.JsonFormatterformat: >-%(asctime)s %(name)s %(levelname)s %(message)shandlers:console:class: logging.StreamHandlerformatter: jsonstream: ext://sys.stdoutloggers:uvicorn:handlers: [console]level: ERRORpropagate: falseroot:level: INFOhandlers: [console]
The explicit uvicorn entry ensures that uvicorn's own log output goes through
the JSON formatter instead of its default text format. It is also set to ERROR
so that console output stays focused on the log calls you've explicitly added
rather than uvicorn's per-request access lines.
Now create the application in main.py. The logging config loads at module
level so it's applied before uvicorn configures its own loggers:
123456789101112131415161718192021222324252627282930313233343536373839404142434445464748495051525354555657# main.pyimport loggingimport logging.configfrom contextlib import asynccontextmanagerfrom pathlib import Pathimport yamlfrom fastapi import FastAPIfrom fastapi.responses import JSONResponselogger = logging.getLogger(__name__)def load_logging_config():config_path = Path(__file__).parent / "logging.yaml"with open(config_path) as f:config = yaml.safe_load(f)logging.config.dictConfig(config)@asynccontextmanagerasync def lifespan(app: FastAPI):load_logging_config()logger.info("Application started")yieldlogger.info("Application shutting down")app = FastAPI(lifespan=lifespan)@app.get("/orders/{order_id}")async def get_order(order_id: int):logger.info("Processing order",extra={"order_id": order_id,"total": 99.99,"currency": "USD",},)if order_id > 1000:try:raise ValueError(f"Order ID {order_id} exceeds maximum")except ValueError:logger.exception("Invalid order ID",extra={"order_id": order_id},)return JSONResponse({"error": "invalid order ID"},status_code=400,)return {"order_id": order_id, "status": "completed"}
Pass --log-config to uvicorn so it uses the same YAML instead of applying its
own defaults on top:
1uvicorn main:app --port 8000 --log-config logging.yaml
Then make a request to the /orders endpoint:
1curl http://localhost:8000/orders/123
Everything comes out as newline-delimited JSON:
12{"asctime": "2026-05-19 12:12:00,885", "name": "main", "levelname": "INFO", "message": "Application started"}{"asctime": "2026-05-19 12:12:03,035", "name": "main", "levelname": "INFO", "message": "Processing order", "order_id": 123, "total": 99.99, "currency": "USD"}
This is your baseline for producing useful logs in a production environment, but the problem is that these records are isolated. They don't carry trace context, they don't follow the OpenTelemetry data model, and correlating them with traces from other services requires parsing and post-processing on the backend side.
In the upcoming sections, we'll add the OTel LoggingHandler to this setup so
that the same logging calls also produce records that follow the OpenTelemetry
logs data model instead of just structured JSON.
How the OpenTelemetry LoggingHandler works
In Python's logging module, handlers control where log records end up. A
StreamHandler writes to a stream (usually stdout), a SocketHandler sends
them to a network socket, and so on. Formatting the log is normally left to a
logging.Formatter instance that's attached to the handler as seen in the
previous section.
However, the OpenTelemetry LoggingHandler does both. It translates each
logging.LogRecord into an OpenTelemetry
LogRecord and
routes it through the OTel Logs SDK.
Timestamps map to OTel's nanosecond-precision fields, Python log levels become
OTel severity numbers, the message becomes the record body, and anything you
passed through extra becomes typed OTel attributes. If there's an active trace
span on the current thread, the handler grabs its trace and span IDs and
attaches those too.
From there, the SDK's processing pipeline takes over: batching records, applying any configured processors, and handing the batch to an exporter that serializes everything as OTLP and ships it to your Collector sidecar or observability backend.
The net effect is that your logging calls stay the same, but what comes out the other end is a first-class OTel signal, with trace context, resource metadata, and typed attributes that match the same data model your traces and metrics use.
Setting up the OpenTelemetry Logs SDK
In this section, you'll add the OpenTelemetry SDK as a second handler alongside the JSON console output you already have. Each logging call will then produce both a JSON line on stdout and an OTel log record routed through the SDK's export pipeline.
Start by installing Python's OpenTelemetry SDK:
1pip install opentelemetry-sdk
This pulls in a few packages:
1234+ opentelemetry-api==1.42.0+ opentelemetry-sdk==1.42.0+ opentelemetry-semantic-conventions==0.63b0+ typing-extensions==4.15.0
- The
opentelemetry-apidefines the interfaces (theLoggerProvider,Logger, andLogRecordcontracts), opentelemetry-sdkprovides the concrete implementations, including theLoggingHandler, processors, and exporters we'll use throughout this guide,- And
opentelemetry-semantic-conventionscontains the standardized attribute names that keep your telemetry consistent across languages and services.
Create an otel_setup.py that initializes the LoggerProvider and registers it
globally. We'll start with the ConsoleLogExporter so you can see the OTel
representation of each log record alongside your JSON console output:
123456789101112131415161718192021222324# otel_setup.pyfrom opentelemetry._logs import set_logger_providerfrom opentelemetry.sdk._logs import LoggerProviderfrom opentelemetry.sdk._logs.export import (SimpleLogRecordProcessor,ConsoleLogExporter,)from opentelemetry.sdk.resources import Resourcedef setup_otel():resource = Resource.create({"service.name": "order-service",})provider = LoggerProvider(resource=resource)provider.add_log_record_processor(SimpleLogRecordProcessor(ConsoleLogExporter()))set_logger_provider(provider)return provider
We're using SimpleLogRecordProcessor so that every record flushes immediately.
Later on, you'll swap this for BatchLogRecordProcessor with an OTLP exporter
to buffer records and reduce network round trips when exporting to a Collector
instance.
A quick note on the import paths: opentelemetry.sdk._logs uses a leading
underscore because the Logs signal in the Python SDK is still
officially experimental.
The underlying OTel spec has marked the Logs SDK as stable, but the Python
implementation hasn't been promoted yet. In practice, the API has been usable in
production for several releases, but be aware that breaking changes in minor
versions are technically possible.
Now add the otel handler to logging.yaml alongside your existing JSON
console handler:
123456789101112131415161718192021222324252627# logging.yamlversion: 1disable_existing_loggers: falseformatters:json:class: pythonjsonlogger.json.JsonFormatterformat: >-%(asctime)s %(name)s %(levelname)s %(message)shandlers:console:class: logging.StreamHandlerformatter: jsonstream: ext://sys.stdoutotel:class: opentelemetry.sdk._logs.LoggingHandlerloggers:uvicorn:handlers: [console]level: ERRORpropagate: falseroot:level: INFOhandlers: [console, otel]
The otel handler doesn't need an explicit logger_provider argument since it
falls back to whatever provider was registered globally through
set_logger_provider(), which is why setup_otel() must run before the logging
config is loaded.
Update main.py to initialize the OTel provider before loading the logging
config:
12345678910111213141516171819202122232425262728293031323334# main.pyimport loggingimport logging.configfrom contextlib import asynccontextmanagerfrom pathlib import Pathimport yamlfrom fastapi import FastAPIfrom otel_setup import setup_oteldef load_logging_config():config_path = Path(__file__).parent / "logging.yaml"with open(config_path) as f:config = yaml.safe_load(f)logging.config.dictConfig(config)provider = setup_otel()load_logging_config()logger = logging.getLogger(__name__)@asynccontextmanagerasync def lifespan(app: FastAPI):logger.info("Application started")yieldlogger.info("Application shutting down")provider.shutdown()app = FastAPI(lifespan=lifespan)# [...]
The ordering matters: setup_otel() registers the global provider, then
load_logging_config() instantiates the LoggingHandler from the YAML, which
discovers that provider automatically.
Seeing the console output
Try it out by restarting the application and sending a request once again:
1curl http://localhost:8000/orders/123
Every logging call now produces two outputs: a JSON line on stdout from the
console handler, and an OTel log record from the otel handler via the
ConsoleLogExporter. The JSON line looks the same as before:
123456789{"asctime": "2026-05-19 12:37:16,952","name": "main","levelname": "INFO","message": "Processing order","order_id": 123,"total": 99.99,"currency": "USD"}
The OTel equivalent is a different shape entirely:
1234567891011121314151617181920212223242526272829{"body": "Processing order","severity_number": 9,"severity_text": "INFO","attributes": {"order_id": 123,"total": 99.99,"currency": "USD","code.file.path": "/home/ayo/dev/dash0/demo/python-logging-otel/main.py","code.function.name": "get_order","code.line.number": 38},"dropped_attributes": 0,"timestamp": "2026-05-19T11:37:16.952331Z","observed_timestamp": "2026-05-19T11:37:16.952781Z","trace_id": "0x00000000000000000000000000000000","span_id": "0x0000000000000000","trace_flags": 0,"resource": {"attributes": {"telemetry.sdk.language": "python","telemetry.sdk.name": "opentelemetry","telemetry.sdk.version": "1.42.0","service.name": "order-service"},"schema_url": ""},"event_name": ""}
The otel handler did more than just copy fields over. It translated the Python
LogRecord into a different data model, and that mapping is worth
understanding.
How Python logging maps to OTel log records
When the bridge converts Python's LogRecord into an OTel log record, it maps
the fields as follows:
-
The
asctimefield becomes OTel'stimestamp, whileobserved_timestamprecords when the SDK processed the record. -
The log message (
"Processing order") becomes the OTel record'sbody. -
Python's log levels are mapped to OTel's severity scale using a static offset:
Python level Value severity_numberseverity_textDEBUG10 5 DEBUG INFO20 9 INFO WARNING30 13 WARN ERROR40 17 ERROR CRITICAL50 21 FATAL If you've defined custom log levels (which are just integers in Python), they'll map to the nearest OTel severity by the same offset arithmetic.
-
The
order_id,total, andcurrencyfields you passed throughextraappear as typed OTelattributes. -
The
code.file.path,code.function.name, andcode.line.numberattributes are derived from the LogRecord'spathname,funcName, andlinenofields. They've been renamed by the Handler to ensure compliance with semantic conventions for source code context. -
When you log an exception (try it with
curl http://localhost:8000/orders/1230), the handler automatically extracts the exception details and maps them to semantic convention attribute names for exceptions:json123456789101112{"attributes": {"order_id": 1230,"code.file.path": "/home/ayo/dev/dash0/demo/python-logging-otel/main.py","code.function.name": "get_order","code.line.number": 51,"exception.type": "ValueError","exception.message": "Order ID 1230 exceeds maximum","exception.stacktrace": "Traceback (most recent call last):\n File \"/home/ayo/dev/dash0/demo/python-logging-otel/main.py\", line 49, in get_order\nraise ValueError(f\"Order ID {order_id} exceeds maximum\")\nValueError: Order ID 1230 exceeds maximum\n"},} -
The
resourceblock carries metadata about the entity producing the telemetry, not about any individual log event. Theservice.nameentry came from theResourceyou configured insetup_otel(), whiletelemetry.sdk.*attributes were attached automatically by the SDK.These sit at the resource level in the OpenTelemetry Protocol, separate from per-event attributes, and are what observability backends use for infrastructure-level grouping and filtering.
-
The trace context fields (
trace_id,span_id, andtrace_flags) are zeroed out because tracing is not active for the application. We'll fix that in the trace correlation section.
Note that this JSON output is only ConsoleLogExporter's debug representation
of an OTel LogRecord. When you switch to the OTLP exporter later, this same
data gets serialized into the actual
OTLP wire format
that will be sent to your Collector or observability backend.
Setting up log-trace correlation
When the LoggingHandler is set up alongside an active tracer, your logs will
automatically carry the trace ID and span ID from whatever span is active. Your
backend can then connect a failing request to the exact logs emitted during its
execution, and vice versa.
In the previous section, the trace and span IDs were all zeros because there was
no active span. Let's change that by providing a TracerProvider that creates
spans, and instrumentation that starts spans for incoming HTTP requests.
Start by installing the FastAPI instrumentation:
1pip install opentelemetry-instrumentation-fastapi
Then update otel_setup.py to initialize both a LoggerProvider and a
TracerProvider sharing the same Resource:
12345678910111213141516171819202122232425262728293031323334# otel_setup.pyfrom opentelemetry import tracefrom opentelemetry._logs import set_logger_providerfrom opentelemetry.sdk._logs import LoggerProviderfrom opentelemetry.sdk._logs.export import (ConsoleLogExporter,SimpleLogRecordProcessor,)from opentelemetry.sdk.resources import Resourcefrom opentelemetry.sdk.trace import TracerProviderfrom opentelemetry.sdk.trace.export import (ConsoleSpanExporter,SimpleSpanProcessor,)def setup_otel():resource = Resource.create({"service.name": "order-service",})tracer_provider = TracerProvider(resource=resource)tracer_provider.add_span_processor(SimpleSpanProcessor(ConsoleSpanExporter()))trace.set_tracer_provider(tracer_provider)logger_provider = LoggerProvider(resource=resource)logger_provider.add_log_record_processor(SimpleLogRecordProcessor(ConsoleLogExporter()))set_logger_provider(logger_provider)return tracer_provider, logger_provider
Both providers share the same Resource so your logs and traces carry identical
service metadata. We're still using Simple* processors and Console*
exporters so that everything prints to stdout immediately. An upcoming section
will cover switching to OTLP with batch processors for production.
In main.py, you need to instrument the FastAPI app and update the shutdown
sequence:
1234567891011121314151617181920212223242526# main.py# [...]from opentelemetry.instrumentation.fastapi import (FastAPIInstrumentor,)from otel_setup import setup_otel# [...]tracer_provider, logger_provider = setup_otel()load_logging_config()logger = logging.getLogger(__name__)@asynccontextmanagerasync def lifespan(app: FastAPI):logger.info("Application started")yieldlogger.info("Application shutting down")tracer_provider.shutdown()logger_provider.shutdown()app = FastAPI(lifespan=lifespan)FastAPIInstrumentor.instrument_app(app)# [...]
Now when you make a request and check the console output, you'll see populated trace context on each log record that's emitted during an active request:
1234567891011121314{"body": "Processing order","severity_number": 9,"severity_text": "INFO","attributes": {...},"dropped_attributes": 0,"timestamp": "2026-05-19T12:34:07.963078Z","observed_timestamp": "2026-05-19T12:34:07.963221Z","trace_id": "0xb90efa268a5a44e50ac68be00643f2aa","span_id": "0xaea888c5a344b0cf","trace_flags": 3,"resource": {...},"event_name": ""}
You'll also see the corresponding span and its debug representation in stdout:
123456789{"name": "GET /orders/{order_id}","context": {"trace_id": "0xb90efa268a5a44e50ac68be00643f2aa","span_id": "0xaea888c5a344b0cf","trace_state": "[]"},[...]}
The trace ID and span ID now match the span that FastAPI's instrumentation created for the HTTP request. This lets your backend link each log entry to the exact request trace.
Replacing the span event API with logging
OpenTelemetry's tracing API has a span.add_event() method for attaching
timestamped annotations to a span:
1234567from opentelemetry import tracespan = trace.get_current_span()span.add_event("cache miss",attributes={"key": "user:42"},)
You might have used this to record milestones during a span's lifetime. The problem was that it gave you two separate mechanisms for recording the same kind of data: span events through the Tracing API and log records through the Logs API. Both carried timestamps and attributes, but they ended up in different pipelines.
The OpenTelemetry project has since
deprecated the span event API
in favor of using log records for this purpose. Since the LoggingHandler
already correlates logs with the active span, you already get span-event-like
behavior without a separate API.
If you want a stable, queryable identifier for an event type (the role a span event name used to fill), you only need to pass it as an otel.event.name attribute:
123456789101112131415logger.info("Processing order",extra={"otel.event.name": "order.processing","order_id": order_id,},)logger.info("Order completed",extra={"otel.event.name": "order.completed","order_id": order_id,},)
Ideally the LoggingHandler would automatically promote otel.event.name to
the top-level event_name field, but it doesn't at the time of writing. You can
fix this in the Collector with the
transform processor:
1234567processors:transform/event_name:log_statements:- context: logstatements:- set(event_name, attributes["otel.event.name"]) where attributes["otel.event.name"] != nil- delete_key(attributes, "otel.event.name")
This moves the attribute into the correct top-level field before export, so your backend can filter and group by event name directly.
Naming log attributes with semantic conventions
One of the things you get by adopting OpenTelemetry is a shared vocabulary for telemetry attributes across every service in your stack. The semantic conventions define standardized, dot-separated names for common attributes so that a Python service, a Go service, and a .NET service all describe the same concept the same way.
You saw this in action in the OpenTelemetry output for the "Processing order"
log record. The code.file.path, code.function.name, and code.line.number
attributes that the LoggingHandler attached automatically all follow the
convention, while the order_id, total, and currency fields from your
extra dict don't, because you named them yourself.
That inconsistency matters once you're querying across services. If your Python
logs use order_id, your Go service uses orderID, and your .NET service uses
OrderId, you've adopted a shared protocol without gaining the interoperability
it's supposed to give you.
The semantic convention registry defines standardized names for common attributes. Before inventing a name, check whether one already exists. Some common ones worth knowing:
| Instead of | Use |
|---|---|
user_id | user.id |
status_code | http.response.status_code |
request_path | url.path |
request_method | http.request.method |
client_ip | client.address |
Domain-specific attributes like order_id or currency
don't map to anything in the registry, and that's fine. For
these, adopt the same dot-separated lowercase pattern and
use a namespace prefix that identifies your domain or organization
(e.g. come.acme.order.id, com.acme.order.currency).
Where you can't control attribute names at the source (third-party libraries,
framework-generated fields), the Collector's transform processor can rename
them in transit using the
OpenTelemetry Transform Languages.
The important thing is picking a convention and keeping it consistent across services so that queries and dashboards work the same way regardless of which service emitted the data.
Moving to OTLP and the Collector
The Console* exporters are good for verifying that everything is wired up and
for debugging during development, but they won't get your telemetry to a
observability backend.
For that, you need to switch to OTLP exporters and send data through an OpenTelemetry Collector.
Start by installing the OTLP HTTP exporter:
1pip install opentelemetry-exporter-otlp-proto-http
Then update otel_setup.py to use OTLP exporters for both traces and logs.
Switch to batch processors at the same time so records are buffered and flushed
in bulk rather than exported one at a time:
12345678910111213141516171819202122232425262728293031323334# otel_setup.pyfrom opentelemetry import tracefrom opentelemetry._logs import set_logger_providerfrom opentelemetry.exporter.otlp.proto.http._log_exporter import (OTLPLogExporter,)from opentelemetry.exporter.otlp.proto.http.trace_exporter import (OTLPSpanExporter,)from opentelemetry.sdk._logs import LoggerProviderfrom opentelemetry.sdk._logs.export import (BatchLogRecordProcessor,)from opentelemetry.sdk.resources import Resourcefrom opentelemetry.sdk.trace import TracerProviderfrom opentelemetry.sdk.trace.export import BatchSpanProcessordef setup_otel():resource = Resource.create({"service.name": "order-service",})tracer_provider = TracerProvider(resource=resource)tracer_provider.add_span_processor(BatchSpanProcessor(OTLPSpanExporter()))trace.set_tracer_provider(tracer_provider)logger_provider = LoggerProvider(resource=resource)logger_provider.add_log_record_processor(BatchLogRecordProcessor(OTLPLogExporter()))set_logger_provider(logger_provider)return tracer_provider, logger_provider
The OTLP exporters default to http://localhost:4318, which matches the
standard Collector HTTP endpoint. If your Collector runs elsewhere, override it
with the OTEL_EXPORTER_OTLP_ENDPOINT
environment variable.
Next, let's set up a local Collector to receive the data. The
debug exporter
prints received telemetry to the Collector's stdout, which is the fastest way
to verify that your pipeline is working end to end.
Create Collector configuration file in your project root:
12345678910111213141516171819# otelcol.yamlreceivers:otlp:protocols:http:endpoint: 0.0.0.0:4318exporters:debug:verbosity: detailedservice:pipelines:traces:receivers: [otlp]exporters: [debug]logs:receivers: [otlp]exporters: [debug]
The otlp receiver listens for incoming telemetry on port 4318 over HTTP, which
matches the default endpoint that the Python OTLP exporters connect to, while
the debug exporter prints everything it receives to the Collector's stdout
with detailed verbosity, so you can inspect the full contents of each span and
log record.
Both traces and logs share the same receiver but flow through separate pipelines, which means you can add different processors or exporters to each signal independently later on.
Now spin up a Collector instance with Docker Compose:
12345678910# docker-compose.ymlservices:otelcol:image: otel/opentelemetry-collector-contrib:0.152.0container_name: otelcolports:- 4318:4318volumes:- ./otelcol.yaml:/etc/otelcol-contrib/config.yamlrestart: unless-stopped
1docker compose up -d
Restart the application, send a request, and tail the Collector's output:
1docker compose logs --no-log-prefix -f otelcol
You should see both the trace span and the correlated log record come through. The log output will look something like this:
12345678910111213141516171819202122232425262026-05-19T13:06:15.549Z info ResourceLog #0Resource SchemaURL:Resource attributes:-> telemetry.sdk.language: Str(python)-> telemetry.sdk.name: Str(opentelemetry)-> telemetry.sdk.version: Str(1.42.0)-> service.name: Str(order-service)ScopeLogs #0ScopeLogs SchemaURL:InstrumentationScope mainLogRecord #0ObservedTimestamp: 2026-05-19 13:06:14.921912569 +0000 UTCTimestamp: 2026-05-19 13:06:14.921751552 +0000 UTCSeverityText: INFOSeverityNumber: Info(9)Body: Str(Processing order)Attributes:-> order_id: Int(123)-> total: Double(99.99)-> currency: Str(USD)-> code.file.path: Str(/home/ayo/dev/dash0/demo/python-logging-otel/main.py)-> code.function.name: Str(get_order)-> code.line.number: Int(44)Trace ID: d3e70f4d6599fad9b0667fe8775bb020Span ID: 41b3b124bffc05baFlags: 3
The trace and span IDs now match the span that FastAPI's instrumentation created for the request. If you scroll through the Collector's output, you'll find the corresponding trace span with the same IDs.
Sending Python logs to Dash0
Once your logs are flowing through the Collector and you've confirmed that resource attributes, trace correlation, and semantic conventions all look correct, you're ready to point the pipeline at a production backend.
Dash0 is built natively on the OpenTelemetry data model, so there's no translation layer between what the Collector exports and what Dash0 stores and queries.
Add an OTLP exporter to your Collector config pointed at your Dash0 ingress endpoint as follows:
1234567891011121314151617exporters:debug:verbosity: detailedotlphttp/dash0:endpoint: "https://ingress.eu1.dash0.com"headers:Authorization: "Bearer ${DASH0_AUTH_TOKEN}"service:pipelines:traces:receivers: [otlp]exporters: [otlphttp/dash0]logs:receivers: [otlp]exporters: [otlphttp/dash0]
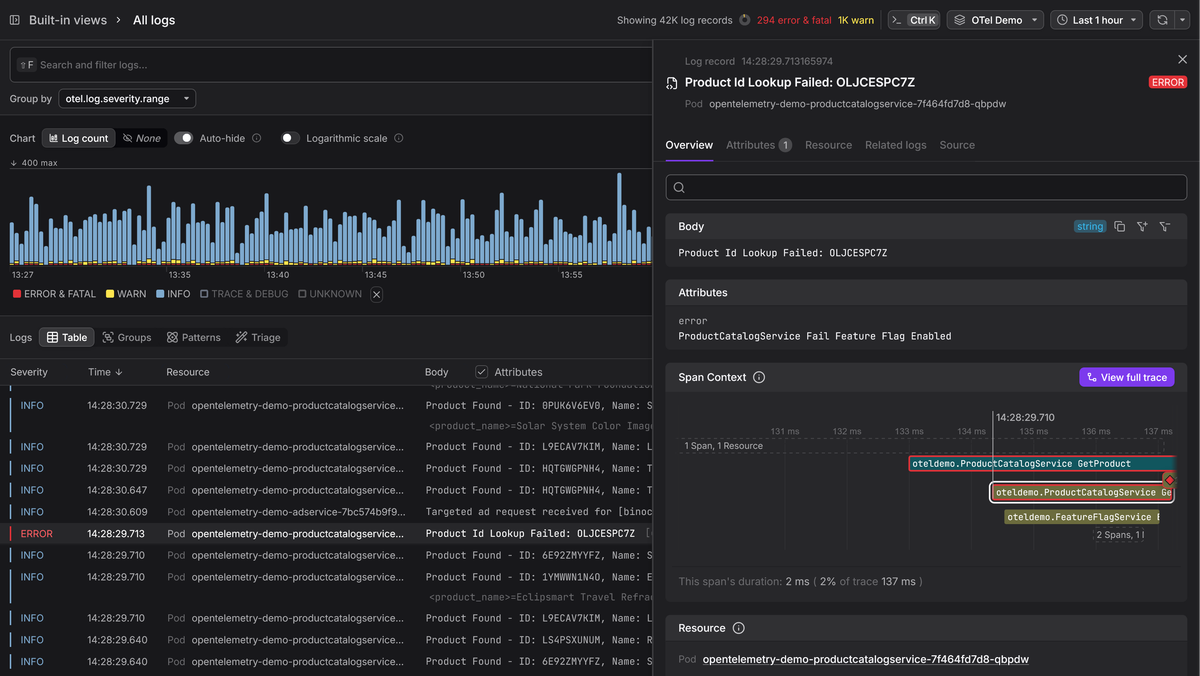
This is where everything you've built in this guide comes together. the
structured attributes you passed through extra arrive as typed, queryable
fields, the resource attributes let you scope an investigation to a specific
service, and the trace correlation fields let you jump from a log record
directly into the trace that produced it.
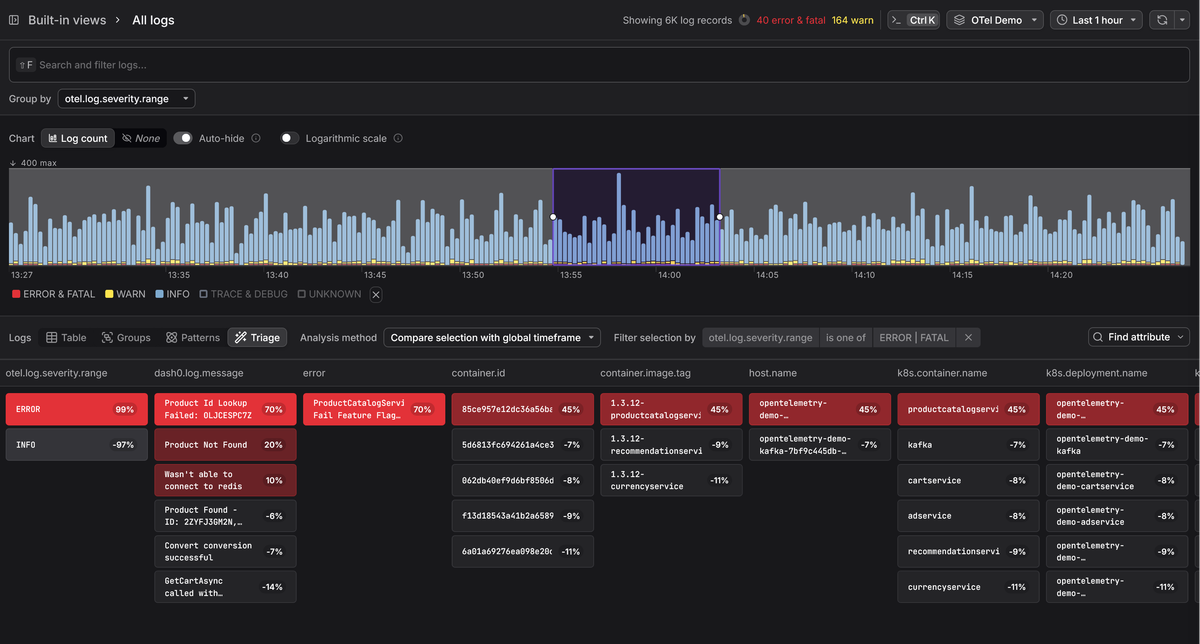
Dash0's Triage takes this further by performing automated comparative analysis across your log (and trace) data, and surfacing which attribute values correlate with the group you're investigating.
Whether you're comparing error logs against healthy ones, or looking at a spike on a subset of endpoints, Triage highlights the distinguishing attributes without you having to guess which dimension to filter by first.
An alternative approach: Collector-side conversion
The setup we've built so far converts log records into OTel model inside your
application process. For most services, the additional overhead is negligible,
but if you're in a situation where logging throughput is a measured bottleneck,
there's another path: writing structured JSON to stdout or a file and letting
the Collector handle the conversion to the OTel model
The tradeoff is automatic trace correlation as the LoggingHandler reads the
active span's trace and span IDs from the OTel context automatically. If you
skip it, you need to inject those IDs into your JSON output yourself. The
opentelemetry-instrumentation-logging package handles this:
1pip install opentelemetry-instrumentation-logging
12345from opentelemetry.instrumentation.logging import (LoggingInstrumentor,)LoggingInstrumentor().instrument(set_logging_format=True)
Once instrumented, every LogRecord gets otelTraceId, otelSpanId, and
otelTraceSampled attributes injected into it, and these fields appear
automatically in the JSON output:
12345678910111213{"asctime": "2026-05-19 15:18:19,383","name": "main","levelname": "INFO","message": "Processing order","otelSpanID": "e05e410ca6f16e62","otelTraceID": "dfa72d6e41d363e48a7b5c05e3938bae","otelTraceSampled": true,"otelServiceName": "","order_id": 123,"total": 99.99,"currency": "USD"}
The Collector can inject these entries using the appropriate receiver for your
environment, parse these fields and map them to the canonical fields in the OTel
log data model during ingestion, giving you the identical result without the
in-process LoggingHandler.
The important difference is that the Collector can only work with what's already in the JSON. Any context you want in the final OTel record, whether that's trace IDs, resource metadata, or custom attributes, has to be present in the log line at the time it's written.
The LoggingHandler automatically maps Python severity levels to OTel severity
numbers, attaches code.* source location attributes, and excludes redundant
LogRecord fields. With the Collector-side approach, you're responsible for
including the right fields upfront, and for writing OTTL statements to map them
to their semantic convention equivalents during ingestion.
For most teams, the in-process LoggingHandler is the simpler path. The
Collector-side approach is worth considering when you have a specific reason to
keep OTel SDK dependencies out of your application, or when you're dealing with
services that already produce well-structured JSON and you'd rather not (or are
unable to) change them.
Final thoughts
The OpenTelemetry LoggingHandler connects Python's familiar logging API to the
OTel ecosystem without requiring you to rewrite how your application logs. Once
it's wired up, every logging call flows into your observability pipeline as a
first-class OTel log record, with trace context, typed attributes, and resource
metadata attached.
For more on the Python logging fundamentals that feed into this pipeline, see our Python logging guide. If you're evaluating Python logging libraries, our comparison guide covers the tradeoffs between the standard module, structlog, and Loguru.
For the Collector side of things, our Collector guide and OTLP receiver walkthrough cover the receiving end in detail.
And if you want to understand how OpenTelemetry logging works at the protocol level, we have a deep dive on that too.
