Last updated: May 25, 2026
Logging in .NET with Serilog: A Practitioner's Guide
If you've spent any time debugging production systems, you already know the uncomfortable truth about logs: they're either your best friend or a noisy liability.
Most teams don't fail at logging because they don't log enough. They fail because their logs aren't reliable data. Messages are inconsistent, context is missing, sensitive values sneak in, and the whole thing devolves into grepping text while an incident clock keeps ticking.
Serilog is popular because it pushes you toward logs as events instead of strings. You still get readable output, but you also get structured properties you can query, aggregate, alert on, and correlate with traces.
This guide is long on purpose. But by the end, you should be able to:
- Set up Serilog correctly in modern .NET (including ASP.NET Core)
- Use message templates properly (and avoid the common traps)
- Enrich events with consistent context like request IDs, user IDs, and trace IDs
- Control volume with levels, overrides, and filtering
- Log exceptions in a way that's actually actionable
- Keep secrets out of your logs with destructuring policies and redaction
- Route logs to files, async sinks, and OpenTelemetry backends
All examples target .NET 10 (the current LTS at the time of writing) and Serilog 4.x.
Why Serilog, specifically?
.NET already has Microsoft.Extensions.Logging (MEL), and it's gotten
significantly better in recent releases. The [LoggerMessage] source generator
(introduced in .NET 8) gives you compile-time validation of message templates
and zero-allocation logging at the call site, which is something Serilog's
runtime template parsing doesn't match.
So why add Serilog? Because MEL defines the logging interface, while Serilog
gives you a richer pipeline. You typically use both together: ILogger<T> in
your application code, with Serilog as the provider behind it. What Serilog adds
on top is a deep ecosystem for controlling what happens to your log events after
they're emitted:
- Sinks to route events to files, consoles, backends, and OTLP endpoints
- Enrichers to attach consistent context (machine name, environment, request IDs, trace IDs)
- Filters and expressions to control noise without scattering
ifstatements everywhere - Destructuring policies to control how complex objects are serialized
Serilog integrates cleanly with ASP.NET Core's hosting model through
Serilog.AspNetCore.
Getting started with Serilog
To begin using Serilog, add the package to your project:
1dotnet add package Serilog
Then add a destination for the logs:
1dotnet add package Serilog.Sinks.Console
Once both packages are installed, wire up a logger:
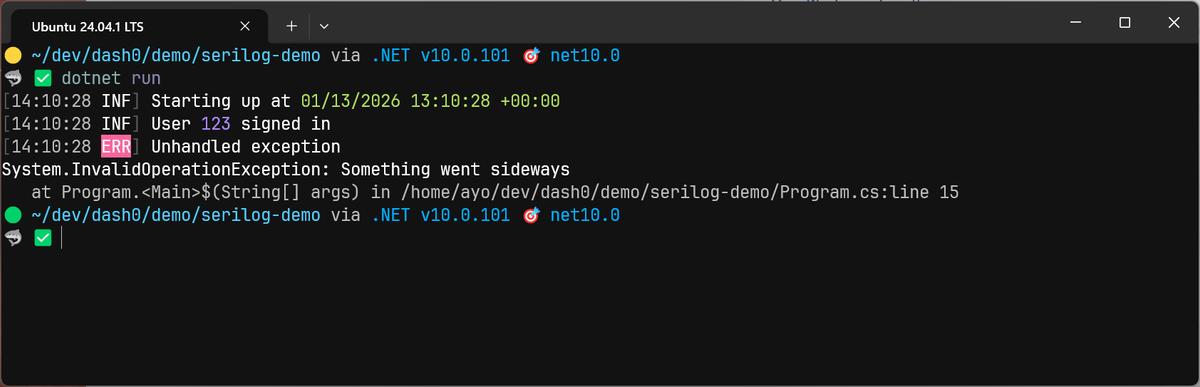
12345678910111213141516171819202122232425262728using Serilog;Log.Logger = new LoggerConfiguration().WriteTo.Console().CreateLogger();try{Log.Information("Starting up at {StartedAt}",DateTimeOffset.UtcNow);var userId = 123;Log.Information("User {UserId} signed in", userId);throw new InvalidOperationException("Something went sideways");}catch (Exception ex){Log.Error(ex, "Unhandled exception");}finally{Log.CloseAndFlush();}
This configures Serilog's root logger, which is stored in Log.Logger. The
LoggerConfiguration defines a console sink and then builds the logger,
assigning it as the process-wide default used by all subsequent Log.* calls.
Log.CloseAndFlush() at shutdown ensures that any buffered events are written
before the process exits. Even with just a console sink, it's a good habit
because some sinks batch events and can lose data on shutdown.
This is the simple, "it works" version. The rest of the guide is about making it actually useful for solving production challenges.
Configuring Serilog through appsettings.json
Hardcoding log levels and sinks works fine until you need to turn up verbosity
on a production instance and realize that means a code change, a build, and a
deploy. Moving configuration into appsettings.json lets you adjust logging
behavior per environment without touching code.
First, install the
Serilog.Settings.Configuration
package:
1dotnet add package Serilog.Settings.Configuration
Then create a Serilog section in your appsettings.json (or create the file
if it doesn't exist already):
123456789101112131415{"Serilog": {"Using": ["Serilog.Sinks.Console"],"MinimumLevel": {"Default": "Information","Override": {"Microsoft": "Warning","Microsoft.Hosting.Lifetime": "Information","System": "Warning"}},"Enrich": ["FromLogContext"],"WriteTo": [{ "Name": "Console" }]}}
MinimumLevel.Default sets the baseline severity, and Override lets you raise
the threshold for specific namespaces so framework noise doesn't drown out your
application logs (more on this in the
log levels section). WriteTo defines your
sinks, Enrich lists enrichers to apply globally, and Using tells Serilog
which assemblies to scan for both.
To load this configuration, you'll need the
Microsoft.Extensions.Configuration.Json package:
1dotnet add package Microsoft.Extensions.Configuration.Json
Then build your logger from the configuration object:
12345678910using Microsoft.Extensions.Configuration;using Serilog;var configuration = new ConfigurationBuilder().AddJsonFile("appsettings.json", reloadOnChange: true).Build();Log.Logger = new LoggerConfiguration().ReadFrom.Configuration(configuration).CreateLogger();
reloadOnChange: true tells the configuration system to watch the file for
edits. When Serilog detects a change, it applies the appropriate updates to
logger without a restart.
Console projects don't copy appsettings.json to the output directory by
default, so you'll need to add
<CopyToOutputDirectory>PreserveNewest</CopyToOutputDirectory> for it in your
.csproj, or pass the full path instead.
123456<!-- serilog-demo.csproj --><ItemGroup><None Update="appsettings.json"><CopyToOutputDirectory>PreserveNewest</CopyToOutputDirectory></None></ItemGroup>
Running this setup produces the same console output as the hardcoded version. The payoff comes later when you can modify your logging behavior per environment without redeploying the entire application.
What to do if you're not seeing logs
If a sink referenced in configuration can't be loaded or fails at runtime,
Serilog won't crash your application, but it also won't tell you by default. You
need to enable SelfLog in your code to surface these errors:
123using Serilog.Debugging;SelfLog.Enable(Console.Out);
This writes Serilog's internal diagnostics to the console, which is helpful for
catching configuration mistakes early. For example, if your appsettings.json
references the File sink but you haven't installed Serilog.Sinks.File,
SelfLog surfaces the problem:
1232026-05-12T06:39:27.7922116Z Unable to find a method called File. Candidate methods are:Serilog.LoggerConfiguration Console(Serilog.Configuration.LoggerSinkConfiguration, Serilog.Events.LogEventLevel, System.String, System.IFormatProvider, Serilog.Core.LoggingLevelSwitch, System.Nullable`1[Serilog.Events.LogEventLevel], Serilog.Sinks.SystemConsole.Themes.ConsoleTheme, Boolean, System.Object)[...]
Without SelfLog enabled, this fails silently and you're left wondering why
logs aren't appearing where you expect them.
How log levels work in Serilog
Log levels are the primary control for log volume as they determine which events get recorded and which are discarded before they ever reach a sink. The filtering happens early, which matters for both performance and cost.
Serilog defines six levels, ordered from least to most severe:
| Level | Typical use case |
|---|---|
| Verbose | Extremely fine-grained internal detail for short-term, targeted diagnostics. |
| Debug | Understanding why the system followed a specific code path. |
| Information | Normal, expected application behavior and meaningful business events. |
| Warning | Unexpected or risky condition that didn't cause failure but may need attention. |
| Error | Failed operations or broken expectations. |
| Fatal | Critical condition that causes a process shutdown. |
These levels are all exposed through simple method calls:
123456Log.Verbose("A verbose message");Log.Debug("A debug message");Log.Information("An information message");Log.Warning("A warning message");Log.Error("An error message");Log.Fatal("A fatal message");
Serilog also exposes a generic Log.Write() method that accepts the level as a
parameter, which is useful when the severity is determined at runtime:
12345678using Serilog;using Serilog.Events;var level = success? LogEventLevel.Information: LogEventLevel.Error;Log.Write(level, "Batch completed with status {Status}", status);
Setting the minimum log level
The minimum level defines the lowest severity that Serilog will capture which means anything below this threshold is discarded immediately, before it reaches enrichers or sinks.
In code, you can set it on the logger configuration:
1234Log.Logger = new LoggerConfiguration().MinimumLevel.Warning() // Defaults to Information if not set.WriteTo.Console().CreateLogger();
In most applications, the minimum level is driven by configuration so it can vary by environment:
1234567{"Serilog": {"MinimumLevel": {"Default": "Debug"}}}
With this setting in place, only Debug, Information, Warning, Error, and
Fatal events are emitted, while Verbose events are suppressed entirely.
Discarded events don't reach enrichers or sinks, so they don't incur serialization or I/O costs. This makes the minimum level your primary lever for controlling log volume and cost.
Changing log levels at runtime
Serilog supports changing log verbosity while the application is running through dynamic level switches. This lets you temporarily increase or decrease log output without restarting.
If you're configuring via a file, and the file is loaded with reloadOnChange,
updates to MinimumLevel, existing overrides, and declared level switches are
applied at runtime without a restart.
To make this work, declare a named level switch and reference it with the $
prefix:
1234567891011{"Serilog": {"LevelSwitches": {"controlSwitch": "Information"},"MinimumLevel": {"ControlledBy": "$controlSwitch"},"WriteTo": [{ "Name": "Console" }]}}
With this in place, changing "controlSwitch" from "Information" to "Debug"
takes effect immediately. This pattern lets you capture detailed diagnostics for
a short period and then return to a quieter baseline after collecting the data
you need to troubleshoot without disrupting the running process.
Overriding the minimum level
If you've ever set your minimum level to Debug and watched your console fill
with Entity Framework query plans and ASP.NET Core routing decisions, you've
already hit the problem that overrides solve. They let you keep a low threshold
for your own code while silencing the framework noise.
The most common form of override is by namespace:
123456789{"MinimumLevel": {"Default": "Information","Override": {"Microsoft": "Warning","System": "Warning"}}}
With this configuration, your application continues to emit Information logs,
while framework components only surface warnings and errors.
Note that an override for Microsoft affects Microsoft.AspNetCore,
Microsoft.EntityFrameworkCore, and any deeper source unless a more specific
override exists. You can use this to target individual components that are known
to be chatty:
12345678{"MinimumLevel": {"Override": {"Microsoft": "Warning","Microsoft.EntityFrameworkCore.Database.Command": "Error"}}}
Level overrides can also be applied to sinks via LoggingLevelSwitch instances,
which lets you route different levels to different destinations if desired.
123456789101112131415161718192021222324{"Serilog": {"MinimumLevel": {"ControlledBy": "$defaultSwitch"},"LevelSwitches": {"defaultSwitch": "Information","fileSwitch": "Error"},"WriteTo": [{"Name": "Console"},{"Name": "File","Args": {"path": "logs/errors.log","rollingInterval": "Day","controlLevelSwitch": "$fileSwitch"}}]}}
Regardless of where they're applied, overrides are evaluated after the default
MinimumLevel. They can only further restrict output, but never widen it beyond
the global setting.
For a broader look at how log levels fit into a modern logging strategy, see our log levels reference.
Understanding Serilog message templates
Every Serilog log call takes a message template as its first argument: a
string with named placeholders like {OrderId} or {ElapsedMs}, followed by
the values that fill them.
12345Log.Information("Charged order {OrderId} in {ElapsedMs} ms",orderId,elapsedMs);
This looks like string interpolation, and in the console output you've seen so far, it behaves the same way: placeholders get replaced with values and you see a readable line. So why use this syntax instead of an interpolated string?
The difference is in what Serilog captures behind the scenes. A message template tells Serilog to store both the static template and each placeholder as a separate, queryable property, while string interpolation gives you only the rendered string.
1234// Not great: produces text, loses structured fieldsLog.Information($"Charged order {orderId} in {elapsedMs} ms");
That distinction doesn't matter much when you're reading console output, but it becomes critical once you switch to JSON (which we'll do in the next section) and start querying logs in a backend.
It also aligns with how OpenTelemetry models log records: the message body should be a static template, and variable data belongs in attributes.
By default, Serilog records values as scalars. If you want to capture a complex
object as structured fields, prefix the placeholder with @:
123var order = new { Id = 123, Total = 49.99, Currency = "USD" };Log.Information("Order received {@Order}", order);
This is powerful, but it also captures every public property on the object, which is how secrets and oversized payloads end up in logs, so keep that in mind.
Logging in JSON
Console output is fine for local development, but production systems need logs that machines can parse. Switching to JSON output is where the structured properties from your message templates actually become visible and queryable.
Serilog supports JSON output natively through JSON formatters. Instead of rendering a human-friendly string, the logger emits structured fields directly as JSON.
The simplest way to emit JSON logs is to use JsonFormatter on the console
sink:
123456789101112{"Serilog": {"WriteTo": [{"Name": "Console","Args": {"formatter": "Serilog.Formatting.Json.JsonFormatter"}}]}}
With this in place, a log call like:
12345Log.Information("User {UserId} signed in from {Region}","usr-8821","eu-west-1");
Produces the following output (pretty printed for readability):
123456{"Timestamp": "2026-05-13T05:51:10.9655038+01:00","Level": "Information","MessageTemplate": "User {UserId} signed in from {Region}","Properties": { "UserId": "usr-8821", "Region": "eu-west-1" }}
The compact JSON formatter
Serilog also supports a more space-efficient JSON formatter through the
Serilog.Formatting.Compact
package:
1dotnet add package Serilog.Formatting.Compact
Once added, replace the default JSON formatter with CompactJsonFormatter by
providing its assembly-qualified type name:
123456789101112{"Serilog": {"WriteTo": [{"Name": "Console","Args": {"formatter": "Serilog.Formatting.Compact.CompactJsonFormatter, Serilog.Formatting.Compact"}}]}}
The same log call now produces a much leaner JSON object:
123456{"@t": "2026-05-13T05:10:41.7311525Z","@mt": "User {UserId} signed in from {Region}","UserId": "usr-8821","Region": "eu-west-1"}
There are a few differences compared to the default JSON formatter:
- Field names
are shortened (
@tfor timestamp,@mtfor message template) to reduce payload size. - Properties from the message template are promoted to top-level fields instead
of being nested under a
Propertiesobject. - The timestamp uses UTC ISO 8601 format with a
Zsuffix, rather than a local offset, which makes logs easier to sort and correlate across systems. - The log level (
@l) is omitted forInformationentries to save space, and only included for other levels:
123{"@t":"2026-01-28T08:48:48.87Z","@mt":"A verbose message","@l":"Verbose"}{"@t":"2026-01-28T08:48:48.90Z","@mt":"A debug message","@l":"Debug"}{"@t":"2026-01-28T08:48:48.90Z","@mt":"An information message"}
Together, these choices make the compact format significantly smaller and roughly twice as fast to produce, according to benchmarks.
If you prefer to see the rendered message instead of the @mt field, you can
use RenderedCompactJsonFormatter:
123456789101112{"Serilog": {"WriteTo": [{"Name": "Console","Args": {"formatter": "Serilog.Formatting.Compact.RenderedCompactJsonFormatter, Serilog.Formatting.Compact"}}]}}
This renders the message in a @m field, omits @mt, and adds an event ID
(@i) to the output:
1234567{"@t": "2026-05-13T05:14:11.1798124Z","@m": "User \"usr-8821\" signed in from \"eu-west-1\"","@i": "696d6a0d","UserId": "usr-8821","Region": "eu-west-1"}
For the rest of this guide, we'll use the CompactJsonFormatter because of its
efficiency.
Setting up Serilog in ASP.NET Core
So far we've configured Serilog in a console application. In ASP.NET Core, the setup is slightly different because the host builder manages configuration and dependency injection for you. This section walks through the production setup for wiring Serilog into an ASP.NET Core application.
Start by adding the core packages:
12dotnet add package Serilog.AspNetCoredotnet add package Serilog.Formatting.Compact
The Serilog.AspNetCore
provides the UseSerilog() host extension and the request logging middleware.
It also pulls in Serilog.Settings.Configuration, so you don't need to install
that separately.
Serilog.Formatting.Compact
gives you the compact JSON formatter covered earlier.
The appsettings.json configuration is similar to what we set up before, with
the addition of a Using array and overrides for ASP.NET Core's noisy internal
logging:
1234567891011121314151617181920212223{"AllowedHosts": "*","Serilog": {"Using": ["Serilog.Sinks.Console", "Serilog.Formatting.Compact"],"MinimumLevel": {"Default": "Information","Override": {"Microsoft": "Warning","Microsoft.Hosting.Lifetime": "Information","System": "Warning"}},"Enrich": ["FromLogContext"],"WriteTo": [{"Name": "Console","Args": {"formatter": "Serilog.Formatting.Compact.CompactJsonFormatter, Serilog.Formatting.Compact"}}]}}
The Using array tells Serilog which assemblies to scan for sinks and
formatters. Serilog can auto-discover assemblies that follow its naming
convention, but listing them explicitly avoids surprises when a formatter or
sink can't be resolved at runtime. The Override block pushes Microsoft.* up
to Warning so route matching decisions and middleware transitions don't drown
out your application logs.
In Program.cs, the recommended pattern uses a short-lived bootstrap logger to
capture any failures that occur during host startup, before the full logger is
configured:
12345678910111213141516171819202122232425262728293031323334353637383940414243using Serilog;using Serilog.Formatting.Compact;Log.Logger = new LoggerConfiguration().MinimumLevel.Information().WriteTo.Console(new CompactJsonFormatter()).CreateBootstrapLogger();try{Log.Information("Starting web application");var builder = WebApplication.CreateBuilder(args);builder.Host.UseSerilog((context, services, configuration) => configuration.ReadFrom.Configuration(context.Configuration).ReadFrom.Services(services).Enrich.FromLogContext());builder.Services.AddControllers();builder.Services.AddOpenApi();var app = builder.Build();if (app.Environment.IsDevelopment()){app.MapOpenApi();}app.UseHttpsRedirection();app.UseAuthorization();app.MapControllers();app.Run();}catch (Exception ex){Log.Fatal(ex, "Application terminated unexpectedly");}finally{Log.CloseAndFlush();}
The bootstrap logger is created before WebApplication.CreateBuilder(args) so
that if the host itself fails to start, the exception is captured and logged
rather than disappearing silently. Without it, startup failures may produce no
output at all.
ReadFrom.Configuration(context.Configuration) pulls the Serilog section from
appsettings.json, meaning the bootstrap logger is only active for the brief
window before the host is built. Once the host is running, the full
configuration takes over.
ReadFrom.Services(services) connects Serilog to the DI container, which
matters if you later register custom enrichers as services.
Log.CloseAndFlush() in the finally block ensures any buffered events are
flushed before the process exits. This matters more for sinks that batch writes,
but it's a good habit regardless.
With Serilog registered as the logging provider, ASP.NET Core's standard
ILogger<T> injection works as normal. You don't need to reference Serilog
directly in your application code:
123456789101112131415161718192021222324252627282930313233343536373839404142434445464748495051525354555657using Microsoft.AspNetCore.Mvc;namespace serilog_app.Controllers;[ApiController][Route("[controller]")]public class DemoController : ControllerBase{private readonly ILogger<DemoController> _logger;public DemoController(ILogger<DemoController> logger){_logger = logger;}[HttpGet("hello/{name}")]public IActionResult Greet(string name){_logger.LogInformation("Greeting user {UserName}", name);return Ok($"Hello, {name}!");}[HttpGet("order/{id}")]public IActionResult GetOrder(int id){var order = new{Id = id, Total = 99.99,Currency = "USD",Items = new[] { "Widget", "Gizmo" }};_logger.LogInformation("Processing order {@Order}", order);return Ok(order);}[HttpGet("error")]public IActionResult CauseError(){try{throw new InvalidOperationException("Something went sideways in the demo");}catch (Exception ex){_logger.LogError(ex,"An error occurred while demonstrating logging");return StatusCode(500,"Look at your logs to see the exception detail!");}}}
This keeps your application code decoupled from Serilog. The structured properties in your message templates are captured as first-class fields in the JSON output:
123456789101112131415161718{"@t": "2026-05-13T10:36:12.4390742Z","@mt": "Processing order {@Order}","@tr": "59ecf7e804a6c6f9af8597e82b3902f8","@sp": "930e210675a032de","Order": {"Id": 123,"Total": 99.99,"Currency": "USD","Items": ["Widget", "Gizmo"]},"SourceContext": "serilog_app.Controllers.DemoController","ActionId": "e190689c-75a1-4944-ae3d-1a2430879f64","ActionName": "serilog_app.Controllers.DemoController.GetOrder (serilog-app)","RequestId": "0HNLGM3IVL8MK:00000001","RequestPath": "/demo/order/123","ConnectionId": "0HNLGM3IVL8MK"}
Notice SourceContext in the output. Serilog automatically attaches this when
you use ILogger<T>, giving you the fully qualified type name of the logger.
This is useful for filtering and for understanding where a log event originated
without reading the message.
The @tr and @sp fields are the trace ID and span ID from the current
System.Diagnostics.Activity. ASP.NET Core creates an Activity for each
incoming request automatically, and Serilog 4.x picks it up and includes it in
the compact JSON output without any extra packages. These fields are what allow
an observability backend to correlate logs with distributed traces, which we'll
cover in a dedicated guide on connecting Serilog to OpenTelemetry.
Adding contextual attributes to .NET logs
Structured logs aren't useful if every event is isolated. You need a thread of continuity, something that ties together all the log events from a single request, user session, or background job.
Serilog does this with enrichers and LogContext.
Global context
Global enrichers attach application-wide properties to all logs, establishing a consistent baseline of context for every event your application emits.
To get started, install the standard enricher packages:
123dotnet add package Serilog.Enrichers.Environmentdotnet add package Serilog.Enrichers.Processdotnet add package Serilog.Enrichers.Thread
Then update your appsettings.json to include them in the Enrich array. It's
also good practice to add them to Using so Serilog explicitly knows where to
find them:
1234567891011121314151617{"Serilog": {"Using": ["Serilog.Sinks.Console","Serilog.Formatting.Compact","Serilog.Enrichers.Environment","Serilog.Enrichers.Process","Serilog.Enrichers.Thread"],"Enrich": ["WithMachineName","WithEnvironmentName","WithProcessId","WithThreadId"]}}
This results in the following fields in all your log records:
123456{"MachineName": "falcon","EnvironmentName": "Development","ProcessId": 42979,"ThreadId": 6}
If you plan to standardize your logs according to the OpenTelemetry data model,
note that static process and environment metadata like MachineName,
ProcessID, and EnvironmentName belong in
resource attributes,
not attached to every individual log event.
If you're using an OpenTelemetry Collector sidecar, it's usually better to skip the enrichers in Serilog entirely and let the Collector handle the correct placement of such metadata using the resourcedetectionprocessor or the k8sattributes processor.
That said, keeping the enrichers is perfectly fine if you handle the mapping downstream. You can let Serilog attach the properties, and then use the transform processor in your OpenTelemetry Collector to promote those specific log attributes to resource attributes before exporting them.
Per-request context with LogContext
While global context covers the whole application, LogContext is for the
specific operation. This is the feature that turns scattered logs into a
coherent story for a single request.
Make sure it's included in your appsettings.json:
12345{"Serilog": {"Enrich": ["FromLogContext"]}}
Instead of manually passing fields down through five layers of method calls just
to log them, you push them onto the LogContext:
1234567891011121314151617181920212223242526272829303132333435363738394041using Microsoft.AspNetCore.Mvc;using Serilog.Context;namespace serilog_app.Controllers;[ApiController][Route("[controller]")]public class DemoController : ControllerBase{private readonly ILogger<DemoController> _logger;public DemoController(ILogger<DemoController> logger){_logger = logger;}[HttpPost("checkout")]public IActionResult Checkout([FromQuery] string orderId,[FromQuery] string customerId){using (LogContext.PushProperty("OrderId", orderId))using (LogContext.PushProperty("CustomerId", customerId)){_logger.LogInformation("Starting charge flow");ProcessPayment();return Ok(new{OrderId = orderId,Status = "Success"});}}private void ProcessPayment(){_logger.LogInformation("Calling payment gateway");}}
Every event written within that using block, including events from methods
called deeper in the stack, will carry both OrderId and CustomerId
properties. Once the block ends, the properties are removed automatically.
The resulting JSON for the ProcessPayment() log event proves that the context
flowed down the stack without having to resort to parameter drilling:
12345678910{"@t": "2026-05-13T10:53:53.1469644Z","@mt": "Calling payment gateway","CustomerId": "cust-123","OrderId": "ord-99","MachineName": "falcon","EnvironmentName": "Development","ProcessId": 42979,"ThreadId": 6}
Setting up HTTP request logging with Serilog
If you leave the Microsoft namespace log level at Information, ASP.NET Core
generates a lot of noise. A single successful HTTP request can scatter 5 to 10
separate log events across your system, detailing routing decisions, middleware
transitions, and endpoint execution:
1234567{"@mt":"Failed to determine the https port for redirect.","SourceContext":"Microsoft.AspNetCore.HttpsPolicy.HttpsRedirectionMiddleware"}{"@mt":"Executing endpoint '{EndpointName}'","SourceContext":"Microsoft.AspNetCore.Routing.EndpointMiddleware"}{"@mt":"Route matched with {RouteData}. Executing controller action with signature {MethodInfo} on controller {Controller} ({AssemblyName}).","SourceContext":"Microsoft.AspNetCore.Mvc.Infrastructure.ControllerActionInvoker"}{"@mt":"Executing {ObjectResultType}, writing value of type '{Type}'.","SourceContext":"Microsoft.AspNetCore.Mvc.Infrastructure.ObjectResultExecutor"}{"@mt":"Executed action {ActionName} in {ElapsedMilliseconds}ms","SourceContext":"Microsoft.AspNetCore.Mvc.Infrastructure.ControllerActionInvoker"}{"@mt":"Executed endpoint '{EndpointName}'","SourceContext":"Microsoft.AspNetCore.Routing.EndpointMiddleware"}{"@mt":"Request finished {Protocol} {Method} {Scheme}://{Host}{PathBase}{Path}{QueryString} - {StatusCode} {ContentLength} {ContentType} {ElapsedMilliseconds}ms","SourceContext":"Microsoft.AspNetCore.Hosting.Diagnostics"}
While you can correlate these events using trace IDs, it's ultimately just log spam that clutters your dashboards, pushes the important application logs out of view, and drives up your ingestion costs.
This is exactly why we pushed the Microsoft override up to Warning in our
appsettings.json earlier:
123456789101112{"Serilog": {"MinimumLevel": {"Default": "Information","Override": {"Microsoft": "Warning","Microsoft.Hosting.Lifetime": "Information","System": "Warning"}}}}
However, silencing the logs completely means you lose basic visibility into which endpoints are being called and how long they take. Serilog's request logging middleware steps in to fill that gap, replacing the scattered framework noise with a single, high-density summary event for the entire request.
In your Program.cs, add app.UseSerilogRequestLogging(). The placement
matters: add it after middleware whose requests you want to ignore (like static
files) but before your controllers and routing:
123456789101112var app = builder.Build();app.UseHttpsRedirection();app.UseStaticFiles();app.UseSerilogRequestLogging();app.UseRouting();app.UseAuthorization();app.MapControllers();app.Run();
Once enabled, Serilog waits for the request to finish and emits one clean JSON object that summarizes the entire lifecycle:
123456789101112131415161718{"@t": "2026-05-14T10:21:32.0653914Z","@mt": "HTTP {RequestMethod} {RequestPath} responded {StatusCode} in {Elapsed:0.0000} ms","@r": ["40.1508"],"@tr": "9ab8c6022d03f7fec2c84e9959468091","@sp": "23543f0b62e12c1d","RequestMethod": "POST","RequestPath": "/demo/checkout","StatusCode": 200,"Elapsed": 40.150838,"SourceContext": "Serilog.AspNetCore.RequestLoggingMiddleware","RequestId": "0HNLHKA8QKV32:00000001","ConnectionId": "0HNLHKA8QKV32","MachineName": "falcon","EnvironmentName": "Development","ProcessId": 72246,"ThreadId": 9}
You can customize this summary further by injecting properties directly into the
completion event using IDiagnosticContext:
1234567891011121314151617181920app.UseSerilogRequestLogging(options =>{options.EnrichDiagnosticContext =(diagnosticContext, httpContext) =>{diagnosticContext.Set("RequestHost",httpContext.Request.Host.Value);diagnosticContext.Set("ClientIp",httpContext.Connection.RemoteIpAddress?.ToString());var userId = httpContext.User?.FindFirst("sub")?.Value;if (!string.IsNullOrWhiteSpace(userId)){diagnosticContext.Set("UserId", userId);}};});
Now your request log becomes queryable by UserId and ClientIp, allowing you
to pull up all requests for a specific customer.
If you want to add request-wide metadata that shows up in all logs (not just the
summary), use the LogContext pattern from the previous section. Place the
middleware right before app.UseSerilogRequestLogging():
123456789using Serilog.Context;app.Use(async (ctx, next) =>{using var _ = LogContext.PushProperty("SomeKey", "SomeValue");await next();});
Logging .NET errors and exceptions
When an incident happens, your exception logs are often the first place you look. But if they're formatted poorly or duplicated endlessly across the stack, they just add to the noise while the clock is ticking.
If you enabled the request logging middleware from the previous section, you already have a built-in safety net. When an unhandled exception escapes your controller and triggers a 500 error, ASP.NET Core catches it to keep the server alive, and Serilog automatically attaches the full exception object to your request summary log.
With the CompactJsonFormatter, it outputs the standard .NET exception trace
into a dedicated @x field:
1throw new InvalidOperationException("An uncaught exception");
123456{"@mt": "HTTP {RequestMethod} {RequestPath} responded {StatusCode} in {Elapsed:0.0000} ms","@l": "Error","@x": "System.InvalidOperationException: An uncaught exception\n at serilog_app.Controllers.DemoController.CauseError() in /home/ayo/dev/dash0/demo/serilog-app/Controllers/DemoController.cs:line 61\n ...\n at Serilog.AspNetCore.RequestLoggingMiddleware.Invoke(HttpContext httpContext)","SourceContext": "Serilog.AspNetCore.RequestLoggingMiddleware"}
After Serilog logs this summary, it re-throws the exception so the framework can generate the actual HTTP 500 response. When ASP.NET Core's internal exception handler catches it, it logs the exact same exception a second time:
123456{"@mt": "An unhandled exception has occurred while executing the request.","@l": "Error","@x": "System.InvalidOperationException: An uncaught exception\n at serilog_app.Controllers.DemoController.CauseError() in /home/ayo/dev/dash0/demo/serilog-app/Controllers/DemoController.cs:line 61\n ...\n at Microsoft.AspNetCore.Diagnostics.DeveloperExceptionPageMiddlewareImpl.Invoke(HttpContext context)","SourceContext": "Microsoft.AspNetCore.Diagnostics.DeveloperExceptionPageMiddleware"}
Because it's logged at the Error level, it bypasses the
"Microsoft": "Warning" override we set up earlier.
If you don't want the duplicate, silence Microsoft's diagnostic logging in your
appsettings.json overrides. Add the exception handler and developer exception
page middleware namespaces and set them to Fatal:
12345678910111213{"Serilog": {"MinimumLevel": {"Default": "Information","Override": {"Microsoft": "Warning","Microsoft.Hosting.Lifetime": "Information","Microsoft.AspNetCore.Diagnostics.ExceptionHandlerMiddleware": "Fatal","Microsoft.AspNetCore.Diagnostics.DeveloperExceptionPageMiddleware": "Fatal"}}}}
With the framework duplicate suppressed, you're left with one structured JSON payload per request containing the stack trace, the exact path that failed, the user who triggered it, and the latency of the failure.
Catching and logging exceptions manually
When you manually catch exceptions in your application code, always pass the
exception object as the first argument so Serilog can populate the @x field:
1234567891011try{throw new InvalidOperationException("Something went sideways in the demo");}catch (Exception ex){_logger.LogError(ex,"An error occurred while demonstrating logging");}
123456{"@t": "2026-05-13T12:37:40.4079162Z","@mt": "An error occurred while demonstrating logging","@l": "Error","@x": "System.InvalidOperationException: Something went\nsideways in the demo\n at serilog_app.Controllers.DemoController.CauseError() in /home/ayo/dev/dash0/demo/serilog-app/Controllers/DemoController.cs:line 63"}
Most exceptions should be logged at Error. If the application is going to
crash and the process will exit, that's Fatal. If the application can safely
return an HTTP 5xx and continue serving the next request, it's Error.
Structured exceptions with Serilog.Exceptions
The @x field captures the exception, but the stack trace is still a multi-line
string. If you want to run queries like finding every error where a specific
method appears in the stack, or extracting custom properties from third-party
exceptions (like SqlException.Number), a flat string isn't enough.
The Serilog.Exceptions package destructures exceptions into fully queryable JSON:
1dotnet add package Serilog.Exceptions
Enable it in your appsettings.json:
123456{"Serilog": {"Using": ["Serilog.Exceptions"],"Enrich": ["WithExceptionDetails"]}}
Once enabled, Serilog includes a deeply nested ExceptionDetail object with
queryable fields:
12345678910111213{"@t": "2026-05-13T13:09:39.2866632Z","@mt": "An error occurred while demonstrating logging","@l": "Error","@x": "System.InvalidOperationException: Something went\nsideways...","ExceptionDetail": {"Type": "System.InvalidOperationException","HResult": -2146233079,"Message": "Something went sideways in the demo","Source": "serilog-app","TargetSite": "Microsoft.AspNetCore.Mvc.IActionResult CauseError()"}}
Routing your logs to files and other destinations
In modern application architecture, the universally accepted
best practice is to treat logs as an event stream.
You write them as structured JSON directly to stdout or stderr (using
Serilog.Sinks.Console), and you let your hosting infrastructure (whether
that's Kubernetes, Docker,
or a systemd daemon) collect, buffer, and ship those logs to your observability
platform.
This approach decouples your application from the destination since your code doesn't need to know about network retries, API keys, or disk space.
But if you're deploying to an environment where that isn't possible, you can install one of the other available sinks to ship logs to local storage or external services.
For example, the file sink can be installed using:
1dotnet add package Serilog.Sinks.File
When configuring this sink, think about disk usage, retention, and ownership.
Ideally, a dedicated utility like
logrotate should
handle rotation, but the file sink supports a few built-in safety options
directly in appsettings.json:
12345678910111213141516{"Serilog": {"WriteTo": [{"Name": "File","Args": {"path": "logs/app.log","rollingInterval": "Day","retainedFileCountLimit": 14,"shared": true,"flushToDiskInterval": "00:00:01"}}]}}
A few defaults to be aware of: fileSizeLimitBytes defaults to 1GB, after which
the sink silently stops writing. Set it explicitly or add
"rollOnFileSizeLimit": true to start a new file instead. The shared option
enables cross-process file access using a mutex, which has a measurable
performance cost. Only enable it if multiple processes write to the same file.
Async and batching
By default, many Serilog sinks (including Console and File) write synchronously. The thread processing your HTTP request blocks while the sink performs I/O. In high-throughput services, this logging overhead can show up as increased tail latency.
The Serilog.Sinks.Async
package solves this by decoupling your application thread from sink I/O through
an in-memory buffer and a background writer:
1dotnet add package Serilog.Sinks.Async
Then wrap your target sinks with Async in appsettings.json:
123456789101112131415161718192021{"Serilog": {"WriteTo": [{"Name": "Async","Args": {"bufferSize": 50000,"blockWhenFull": false,"configure": [{"Name": "Console","Args": {"formatter": "Serilog.Formatting.Compact.CompactJsonFormatter"}}]}}]}}
Two settings here deserve attention. bufferSize controls how many events can
queue in memory before the sink has to make a decision (the default is 10,000).
blockWhenFull determines what happens when that limit is reached: true (the
default) means the calling thread waits for queue space, which preserves every
log but can stall your request pipeline under load. false means new events are
dropped silently, which keeps your application responsive but risks losing logs
during exactly the kind of spike you'd want to investigate.
For user-facing APIs, it's usually better to lose a few log events than to cause
cascading latency because your request threads are blocked on a full logging
buffer. Increase bufferSize to 50,000 or 100,000 if your server has the
memory, and the drops become even less likely.
The other risk with async logging is crashes. Because events sit in memory
before being written, a process that terminates abruptly loses whatever is in
the buffer. This is why Log.CloseAndFlush() in the finally block of
Program.cs matters as it drains the buffer on graceful shutdown.
If losing error-level logs is unacceptable, you can route them to a separate synchronous sink while keeping everything else async. This gives you the throughput benefits for the bulk of your logging while making sure the events you care about most are written immediately.
Filtering: controlling noise at the source
Every log event you emit consumes CPU to format, memory to buffer, bandwidth to transmit, and money to store. You'll eventually need to drop events before they leave the process, whether that's health check spam, a chatty third-party library, or known-benign exceptions.
The cheapest filter is the one we've already set up: MinimumLevel overrides.
When you configure an override like
"Microsoft.EntityFrameworkCore": "Warning", Serilog evaluates the rule at call
time. If the event doesn't meet the threshold, Serilog returns immediately
without evaluating the message template, allocating strings, or building the log
event object. No work is done, and no memory is spent. This is why namespace
overrides should always be your first line of defense.
Sometimes level overrides aren't precise enough. You want HTTP request logs
enabled, but you don't need thousands of successful pings to your /health
endpoint filling up your backend.
Serilog.Expressions gives
you a SQL-like filtering language that you can configure in appsettings.json,
no recompilation needed:
1dotnet add package Serilog.Expressions
12345678910111213{"Serilog": {"Using": ["Serilog.Expressions"],"Filter": [{"Name": "ByExcluding","Args": {"expression": "RequestPath like '/health%' or RequestPath = '/metrics'"}}]}}
This is much cleaner than scattering if (path == "/health") checks through
your middleware, and you can adjust the rules per environment without
redeploying.
Some exceptions are noisy but harmless. The classic ASP.NET Core example is a
client closing their browser tab before a response finishes. Kestrel cancels the
request and throws an OperationCanceledException or TaskCanceledException,
which generates a full stack trace at Error level. You can't "fix" a user
closing their browser, so these events are pure noise.
You can filter them out by matching against the exception string (@x in
Serilog's expression syntax), which contains the exception type, message, and
stack trace:
12345678910111213141516171819{"Serilog": {"Using": ["Serilog.Expressions"],"Filter": [{"Name": "ByExcluding","Args": {"expression": "RequestPath like '/health%' or RequestPath = '/metrics'"}},{"Name": "ByExcluding","Args": {"expression": "@x like 'System.OperationCanceledException%' or @x like 'System.Threading.Tasks.TaskCanceledException%'"}}]}}
This is less precise than a type check in C# since it matches on the string representation of the exception, but it has the advantage of being adjustable without redeploying.
A word of caution on exception filtering: if you filter too aggressively, you'll
mask real failures. A safer approach is to catch these exceptions in your
middleware, log them at Information or Warning level with a property like
Benign=true, and reserve Error for actual failures. This keeps your
error-rate metrics clean while preserving an audit trail in case an
OperationCanceledException turns out to be something less innocent than a
closed browser tab.
If your filtering needs go beyond dropping events and into routing them to
different destinations based on level or content (for example, sending errors to
an alerting service while shipping everything else to cold storage), look into
Serilog's
sub-logger
pattern via the Logger sink. We already covered per-sink level switches in the
log levels section, which handles the common
case, but sub-loggers give you full independent pipelines with their own
enrichers, filters, and sinks.
Redaction and privacy
If your logs contain secrets, you've already had an incident. You just might not know it yet.
The most effective protection is also the simplest: don't log sensitive data in
the first place. Log identifiers and outcomes, not raw values. UserId rather
than Email. OrderId rather than the full order object.
PaymentProvider=Stripe and Result=Declined rather than card numbers. This is
where the message template discipline from earlier pays off: if you log
{UserId} instead of {@User}, you control exactly what enters the pipeline.
When you do need to log objects, Serilog's destructuring policies let you
control which properties are captured. Instead of relying on every developer to
remember not to use @ on sensitive types, you can define a policy that strips
fields at the logger level:
1234567891011121314151617181920212223242526public class CustomerDestructuringPolicy: IDestructuringPolicy{public bool TryDestructure(object value,ILogEventPropertyValueFactory factory,out LogEventPropertyValue? result){if (value is Customer c){result = new StructureValue(new[]{new LogEventProperty("Id",factory.CreatePropertyValue(c.Id)),new LogEventProperty("Plan",factory.CreatePropertyValue(c.Plan)),});return true;}result = null;return false;}}
Register the policy in your appsettings.json using the Destructure array:
123456789101112{"Serilog": {"Destructure": [{"Name": "With","Args": {"policy": "MyApp.Logging.CustomerDestructuringPolicy, MyApp"}}]}}
Now Log.Information("Customer {@Customer}", customer) only captures Id and
Plan, regardless of what other properties exist on the object. Fields like
Email, PaymentMethod, or Address never reach the log pipeline.
1234567{"@t": "2026-05-15T13:07:34.6380130Z","@mt": "Processing customer {@Customer}","@tr": "82414fb5006776519add14af084d1d37","@sp": "46c4c186449b0515","Customer": { "Id": 42, "Plan": "Premium" }}
For a broader safety net, you can write an enricher that scans every log event for property names that match sensitive patterns and replaces their values:
12345678910111213141516171819202122232425public class RedactingEnricher : ILogEventEnricher{private static readonly HashSet<string> Sensitive = new(StringComparer.OrdinalIgnoreCase){"password", "token", "secret","authorization", "creditcard"};public void Enrich(LogEvent logEvent,ILogEventPropertyFactory factory){var matches = logEvent.Properties.Keys.Where(k => Sensitive.Contains(k)).ToList();foreach (var key in matches){logEvent.AddOrUpdateProperty(factory.CreateProperty(key, "[REDACTED]"));}}}
This runs on every event, so keep the matching logic fast. Exact name lookups
against a HashSet are cheap; regex scanning on property values is not.
Register it in appsettings.json the same way:
12345678910111213{"Serilog": {"Enrich": ["FromLogContext",{"Name": "With","Args": {"enricher": "MyApp.Logging.RedactingEnricher, MyApp"}}]}}
1234567{"@t": "2026-05-15T13:07:34.6390903Z","@mt": "User attempted login","@tr": "82414fb5006776519add14af084d1d37","@sp": "46c4c186449b0515","Password": "[REDACTED]"}
These are application-level defenses. If you're running an OpenTelemetry Collector, you can add a second layer of protection using the redaction processor, which operates on telemetry data after it leaves your application.
This is useful on larger teams where you can't guarantee that every service follows the same logging discipline. See Scrubbing Sensitive Data from OpenTelemetry Logs, Traces & Metrics for a walkthrough of that approach.
Shipping Serilog logs to an observability platform
Everything we've built so far produces well-structured log events with consistent context, queryable properties, and trace IDs. The missing piece is getting those events into a centralized platform where you can search, correlate with traces, and alert on them.
The
Serilog.Sinks.OpenTelemetry
package transforms Serilog events into OpenTelemetry log records and exports
them via OTLP. You can point it at an
OpenTelemetry Collector
or directly at any OTLP-compatible backend. The trace and span IDs that Serilog
4.x captures from System.Diagnostics.Activity are included automatically,
which is what enables log-to-trace correlation on the receiving end.
We'll cover the full OTLP pipeline setup, including Collector configuration and resource attributes, in a dedicated guide on connecting Serilog to OpenTelemetry.
Once your logs are flowing through OTLP, an OpenTelemetry-native platform like Dash0 lets you see your Serilog events alongside traces and metrics in a unified view, with all the structured properties you've carefully attached throughout this guide available as first-class queryable attributes.
Final thoughts
Serilog is easy to adopt, which is why so many .NET teams use it. The harder part is turning it into a logging strategy that scales with your system and your organization.
The difference between "we have logs" and "logs help us" is almost always the same set of decisions: do your events carry consistent context? Can you query by meaningful identifiers? Are your levels meaningful, or are they decorations? Are you emitting data you can trust, or strings you hope are readable? Can you correlate logs with traces without manual archaeology?
If you treat Serilog as a structured event system and wire it into an OpenTelemetry pipeline, you get logs that behave like observability data, not console output you hope to parse later.
For more on structured logging patterns, log formatting strategies, or how OpenTelemetry logging works under the hood, we have guides that go deeper on each topic.
