Last updated: June 29, 2026
Batching, Queuing, and Retries in the OpenTelemetry Collector
Every exporter in the OpenTelemetry Collector that sends data over a network relies on the exporter helper framework under the hood. This shared layer handles the parts that would otherwise be copy-pasted across exporters: batching, queuing, retries, and timeouts. Whether you're using the OTLP gRPC exporter, the OTLP HTTP exporter, or something like the Kafka exporter, the same configuration blocks apply.
Understanding the exporter helper as a standalone concept saves you from re-learning the same knobs for each exporter you configure. It also explains behavior that can seem mysterious if you only read the exporter-specific docs, like why data gets dropped during restarts or why failed batches sometimes succeed on a second attempt without any intervention.
How data flows through a Collector exporter
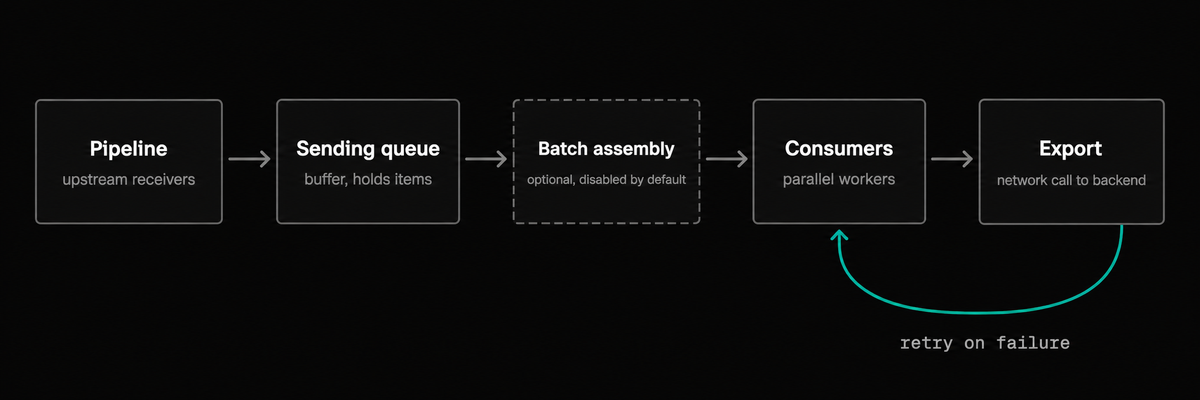
When telemetry reaches an exporter, it doesn't go straight to the network. The exporter helper sits in between and handles buffering and reliability before the actual export call happens.
Incoming data first enters the sending queue, which buffers it in-memory so the pipeline isn't blocked even if the backend is slow or temporarily unavailable.
If batching is enabled, a batcher then assembles queued items into larger payloads to reduce the number of network calls. Finally, a consumer picks up the data and makes the export call.
If the call fails with a retryable error, the built-in retry sender re-attempts it with exponential backoff.
Not every stage is always active. The queue and retries are enabled by default, but batching is off unless you explicitly enable it. The order is fixed though: data enters the queue first, gets batched (if enabled), then is handed to a consumer that makes the export call and retries on failure.
Note that if your pipeline fans out to more than one exporter (or more than one instance of the same exporter), each instance gets its own queue, batcher, and retry sender and they don't share state. If one backend goes down and its queue fills up, the other exporters continue draining and exporting normally.
Configuring the sending queue
The sending_queue is a buffer between your pipeline and the network call to
the backend. Without it, a slow or unavailable backend puts backpressure
directly on the receivers, which can cause data loss upstream. With the queue
enabled, incoming data is buffered and drained by a pool of parallel consumers.
Here are the default settings:
123456789exporters:otlp_grpc:endpoint: my-backend.example.com:4317sending_queue:enabled: truequeue_size: 1000num_consumers: 10sizer: requestsblock_on_overflow: false
The queue is enabled by default, and you'll almost always want it that way as
disabling it means your telemetry data gets dropped the moment the exporter
can't keep up.
The queue_size controls how much data the buffer can hold, and num_consumers
sets how many workers drain it in parallel. Raising the consumer count increases
throughput if the backend can keep up, but if it's already saturated, extra
consumers just pile on more connections without clearing the queue any faster.
How the queue capacity is measured
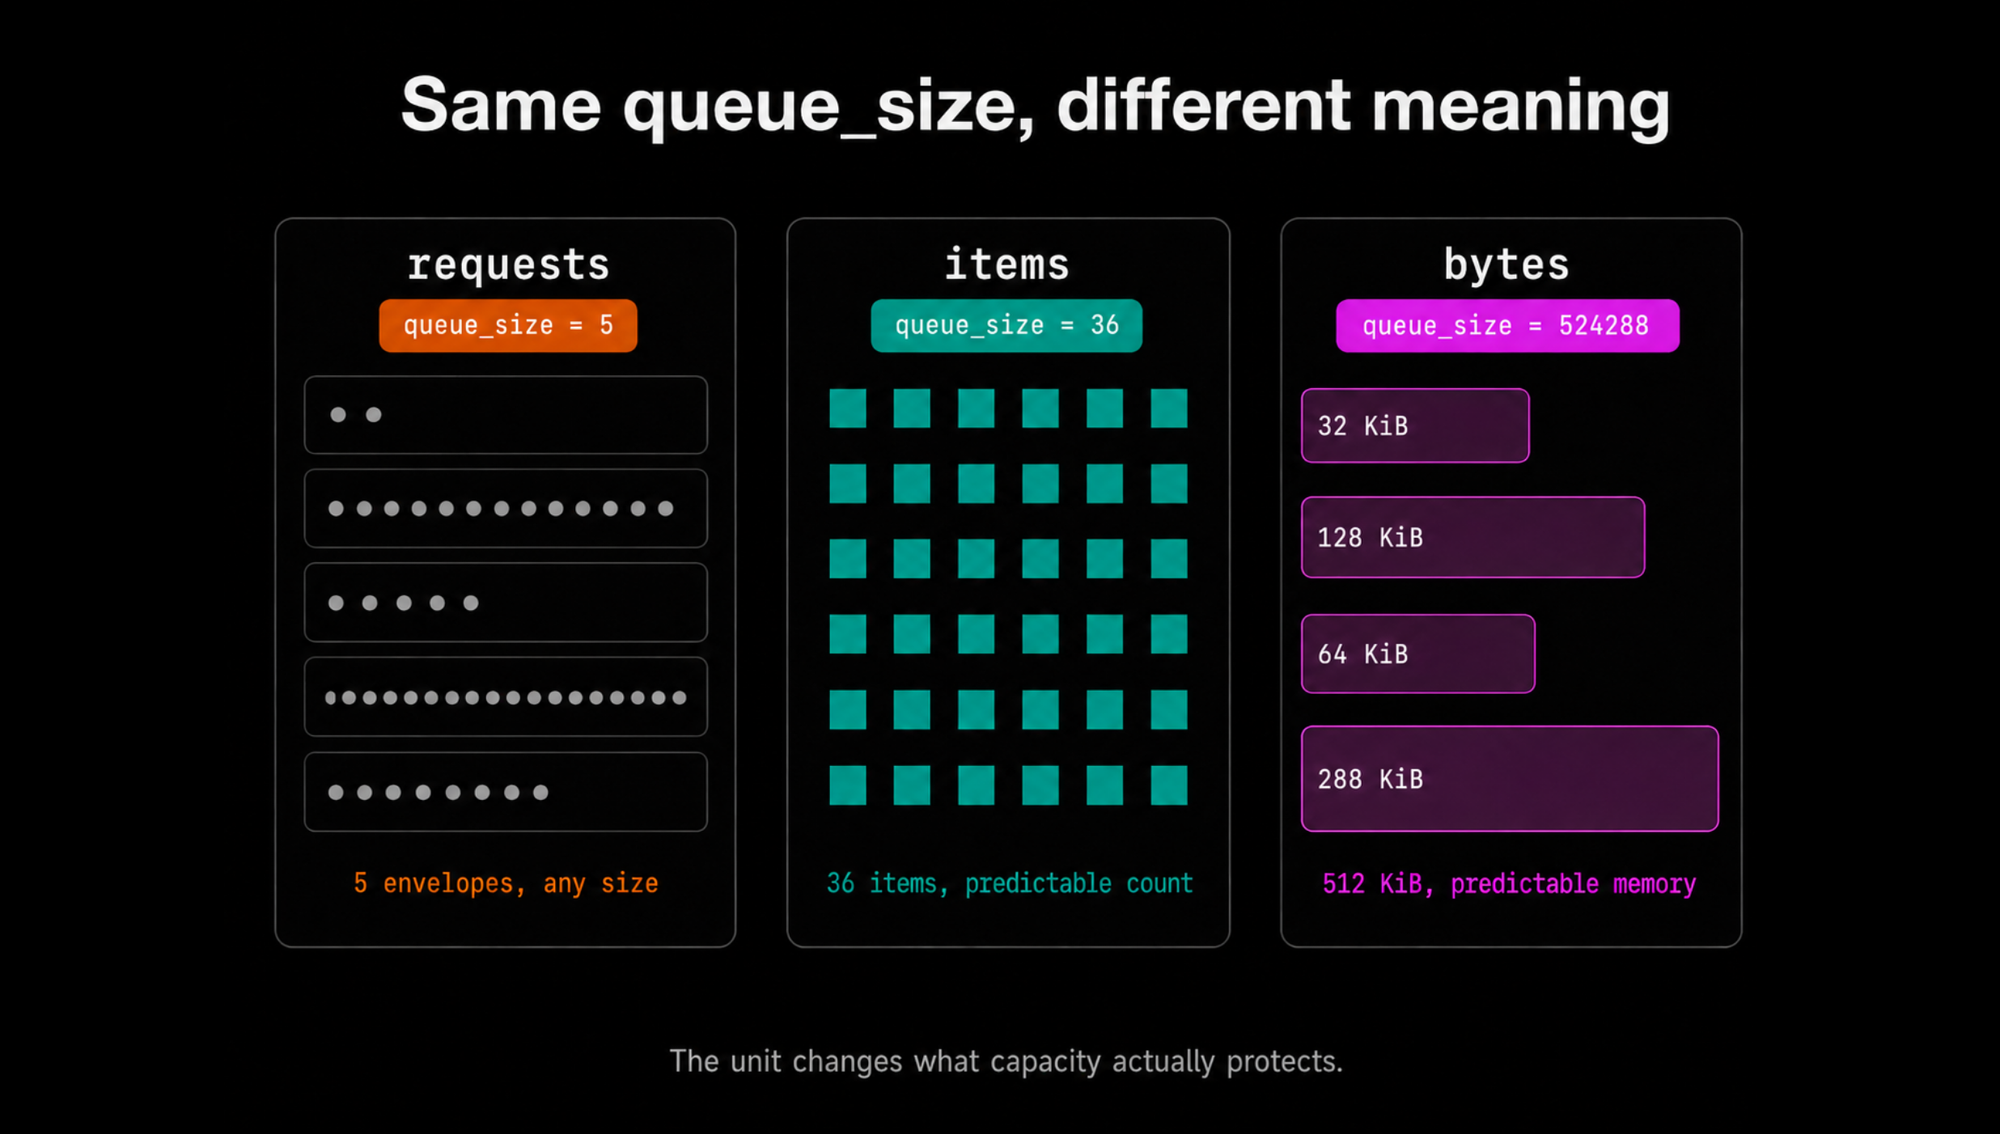
The sizer field determines the unit that queue_size is measured in. It
defaults to requests which counts the incoming requests to the exporter.
What counts as a "request" depends on what's upstream of the exporter. If you're
running the
batch processor,
each batch it produces enters the sending_queue as a single request.
Without any batching, each call from the receiver becomes one request. For an OTLP receiver, that's typically one request per incoming OTLP payload from a client. Since SDK-level batching is usually enabled, a single flush might contain hundreds of spans or logs, but it arrives at the exporter as a single request.
If you're using exporter-level batching, the
queue counts items as they arrive, before the batch block reassembles them
into larger payloads.
With the default sizer: requests, a queue_size of 1,000 means 1,000 queue
entries regardless of how many signals each one contains. This makes it the
cheapest option to compute, but the tradeoff is that you can't predict memory
usage from the queue size alone since one entry might hold 10 spans and
another 1000.
The two alternatives give you more control. items counts individual signals
(spans, data points, log records), so a queue_size of 10,000 means exactly
10,000 spans across all entries. This makes memory usage more predictable, at
the cost of tracking per-item counts on every enqueue. bytes counts serialized
payload size, which is the most precise measure of memory impact but it's also
the most expensive to compute.
For most deployments, the default requests sizer is fine. Switch to items or
bytes if your incoming payloads vary widely in size and you need tighter
control over memory.
The
memory_limiter
processor, which sits upstream in most production pipelines, can refuse data
before it ever reaches the exporter. If the Collector's memory usage crosses the
limiter's threshold, it starts rejecting data at the receiver, and nothing makes
it to the queue at all. A queue_size of 100,000 items won't help if the memory
limiter is already shedding load, so you'll want to size them together.
What happens when the queue is full
If data cannot be enqueued, it's dropped by default and reported by the
otelcol_exporter_enqueue_failed_* metrics. This happens when the queue has
reached its configured queue_size or,
for persistent queues, when the
underlying storage can't accept more data.
If you'd rather block the pipeline than drop incoming data, you can enable
block_on_overflow:
12sending_queue:block_on_overflow: true
With this setting, the pipeline goroutine that feeds data into the queue blocks instead of dropping it. It stays blocked until space opens up in the queue, which means the receiver that called into the pipeline can't accept new data while it waits.
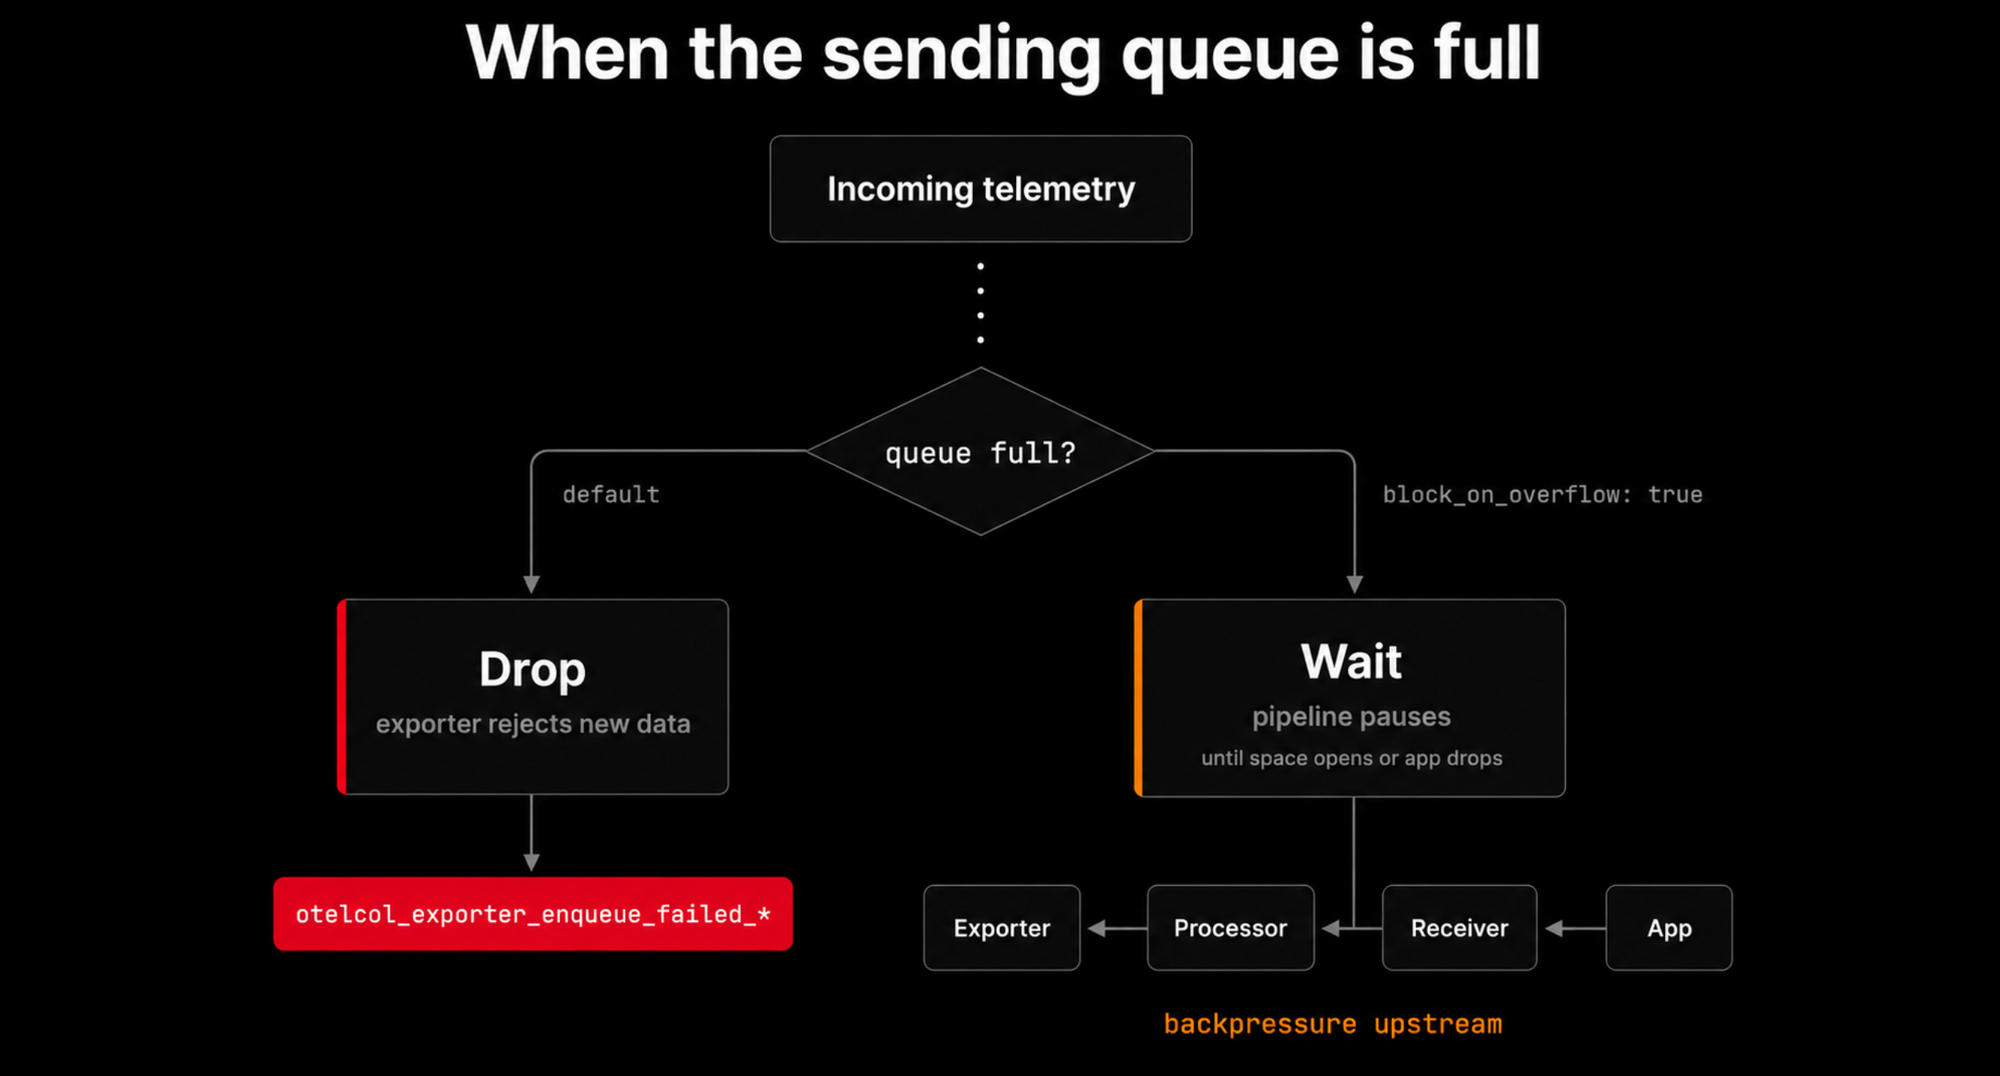
This protects against data loss during short bursts, but if the queue stays full for an extended period, that backpressure propagates upstream through the receivers and eventually to your applications.
Once the SDK's own export queue fills up, your application starts dropping data
at the source. At that point you've moved the data loss from the Collector
(where you can monitor it via otelcol_exporter_enqueue_failed_*) to the
application (where you often can't), which makes the problem harder to detect.
Note that if an exporter with blocking enabled stalls long enough to backpressure the receiver, it stops accepting data for the entire pipeline, which starves all exporters that receive data from it, not just the one that's struggling.
Surviving restarts with persistent queues
An in-memory queue works well for short hiccups, but it disappears the moment the Collector restarts or crashes. To survive restarts, you can back the queue with a persistent storage extension, typically file_storage:
12345678910111213141516171819extensions:file_storage/exporter_queue:directory: /var/lib/otelcol/storagetimeout: 1s # maximum time to wait for a file lockexporters:otlp_grpc:endpoint: my-backend.example.com:4317sending_queue:enabled: truestorage: file_storage/exporter_queuequeue_size: 10000service:extensions: [file_storage/exporter_queue]pipelines:traces:receivers: [otlp]exporters: [otlp_grpc]
With this configuration, batches are written to disk instead of held in memory.
If the Collector shuts down while data is in the queue, it picks up where it
left off on restart. The queue_size parameter still applies, but now it limits
how many batches can be stored on disk (measured in whatever unit sizer is set
to).
You only need to make sure the disk has enough space for the volume you configured, and keep an eye on I/O latency since every enqueue and dequeue now hits the filesystem.
For details on tuning file_storage behavior, see its
documentation
on GitHub.
Auth extensions don't survive the queue
Client metadata (like tenant IDs set via
include_metadata)
and span context are
preserved through persistent queues
as of Collector v0.131.0. However, context set by auth extensions (like
oauth2client, bearertokenauth, or headers_setter) is
still not persisted.
When the Collector comes back up, it reads the queued data and tries to export
it without the original auth tokens, which results in 401s or 403s from the
backend.
If you need both persistent queues and authentication, use static credentials in
the exporter's headers config instead of an auth extension:
1234567exporters:otlp_grpc:endpoint: my-backend.example.com:4317headers:Authorization: "Bearer ${env:API_TOKEN}"sending_queue:storage: file_storage/exporter_queue
Static headers are included on every export call regardless of whether the data came from disk or memory, so they survive the queue. The tradeoff is that you lose the auth extension's token lifecycle management (automatic refresh, rotation), but for long-lived API keys or tokens injected from a secrets manager, this works reliably.
Batching at the exporter level
Sending many small export requests is inefficient so batching is often recommended for queuing items into larger payloads so each network call carries more data with better compression and less overhead.
Historically, most Collector deployments handled this with the standalone
batch processor in the pipeline but the long-term direction is to
retire this processor entirely
in favor of batching within the exporter itself.
The exporter helper now supports this natively through a batch block inside
sending_queue, which moves the assembly step closer to the actual export call.
Batching is disabled by default. When you enable it, the following defaults apply:
12345678910exporters:otlp_grpc:endpoint: my-backend.example.com:4317sending_queue:enabled: truesizer: requestsbatch:min_size: 8192max_size: 0flush_timeout: 200ms
The min_size threshold controls when a batch is considered ready to send. If
the threshold isn't reached, flush_timeout ensures data doesn't sit in the
buffer indefinitely and is flushed out
Setting max_size enables splitting of oversized batches which is helpful when
your backend has a strict request size limit. Leave it at 0 for no upper
limit.
How the batch sizer relates to the queue sizer
The batch has its own sizer field that determines the unit for min_size and
max_size. Unlike the queue, the batch only supports items and bytes (not
requests, since request count isn't meaningful for controlling payload size).
If you don't set batch.sizer explicitly and your batch block contains at least
one field (like min_size), it inherits the queue's sizer. If the queue sizer
is requests or the batch block is empty, the batch defaults to items.
1234567sending_queue:sizer: bytesqueue_size: 10000batch:# Inherits bytes from the parent because min_size is setmin_size: 1048576max_size: 5242880
Be aware that the inheritance logic has
known edge cases
where the batch sizer doesn't inherit as expected, so the safest approach is to
always set batch.sizer explicitly so there's no ambiguity:
1234567sending_queue:sizer: requestsqueue_size: 1000batch:sizer: itemsmin_size: 1000max_size: 2000
There's also ongoing discussion about supporting compound sizers (such as triggering a flush at 8,192 items or 5 MiB, whichever comes first), which would replace the current single-sizer model. Check the exporter helper documentation for the latest configuration format.
Partitioning batches by metadata
If you're using the Collector's
include_metadata
feature on your receivers, different requests may carry different client
metadata (like tenant IDs or auth tokens). By default, the batcher mixes all
incoming data together regardless of metadata.
You can partition batches by specific metadata keys so that data from different clients never gets combined:
1234sending_queue:batch:partition:metadata_keys: [tenant_id]
This creates a separate batcher instance per unique value of tenant_id. Each
partition adds overhead, so only partition on keys with a bounded set of values.
Migrating from the batch processor
If you're running the batch processor today, the migration is straightforward.
The main thing to remember is that you should always set batch.sizer
explicitly rather than relying on inheritance from the queue.
Here's a typical batch processor config and its exporter-level equivalent:
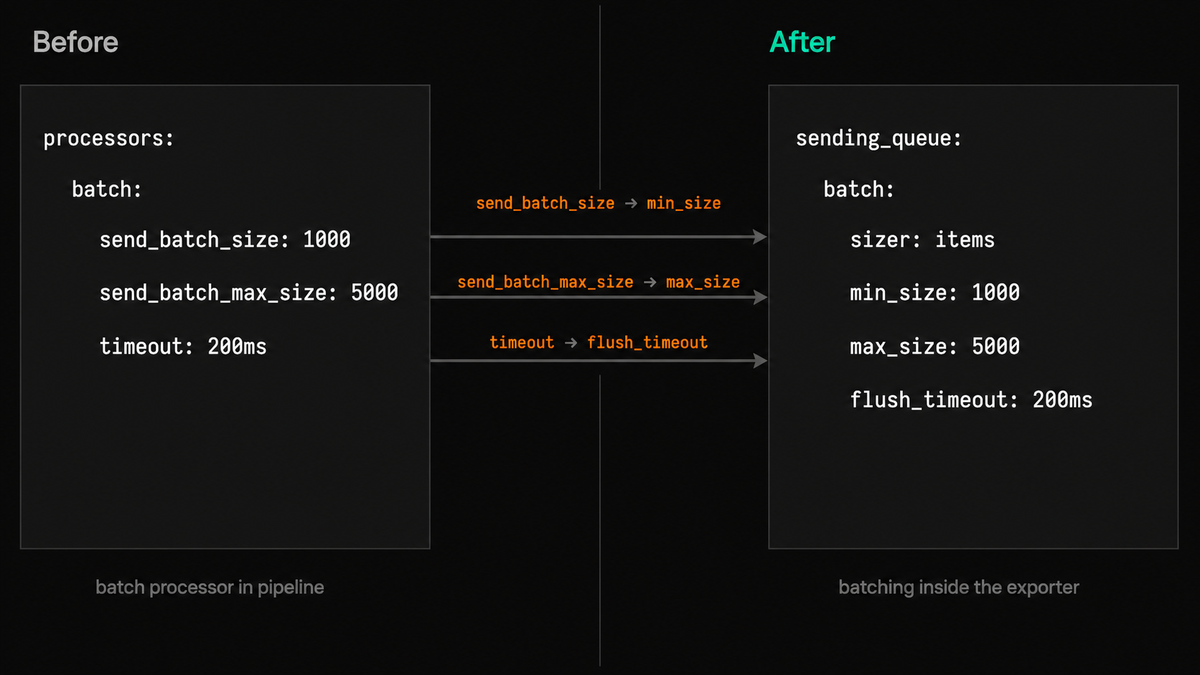
Before (batch processor in the pipeline):
123456789101112processors:batch:send_batch_size: 1000send_batch_max_size: 5000timeout: 200msservice:pipelines:traces:receivers: [otlp]processors: [batch]exporters: [otlp_grpc]
After (batching inside the exporter):
12345678910111213141516exporters:otlp_grpc:endpoint: my-backend.example.com:4317sending_queue:enabled: truebatch:sizer: itemsmin_size: 1000max_size: 5000flush_timeout: 200msservice:pipelines:traces:receivers: [otlp]exporters: [otlp_grpc]
The mapping is:
send_batch_sizebecomesmin_size,send_batch_max_sizebecomesmax_size, andtimeoutbecomesflush_timeout.
How the queue and batcher work together
The queue accepts whatever the pipeline hands it and holds each unit as a single
queue entry. One entry is one call to the exporter's consume function, which
typically maps to one incoming OTLP export from an SDK or one batch from the
batch processor (if configured). An entry is opaque to the queue: it could
contain 5 spans or 5,000, and the queue doesn't unpack it.
This is also what the sizer setting requests actually counts: queue entries,
one per pipeline call. The name is misleading because "request" sounds like an
outbound network call, but it refers to the inbound unit of data.
Without exporter-level batching, a consumer grabs one entry from the queue and
exports it directly regardless of how big or small the payload is. With
num_consumers: 10, up to 10 entries are drained from the sending queue in
parallel.
But when batching is enabled, the batcher sits between the queue and the
consumers. Instead of consumers pulling entries directly, the batcher drains
them and assembles them into larger payloads. Once a payload hits min_size (or
flush_timeout fires), the batcher hands it to a consumer as a single export
call.
To see how this plays out, say ten OTLP calls arrive from SDKs, each containing
200 spans. The queue now holds 10 entries (10 requests in sizer terms, or
2,000 items).
Without batching, each of the 10 consumers grabs one "request" and fires off an export call containing 200 spans in parallel. The queue drains quickly, but the backend handles 10 separate requests where one or two larger ones would have been more efficient.
With batching (assuming sizer: items, min_size: 1000), the batcher pulls
entries from the queue and assembles them. After 5 entries (5 × 200 = 1,000
spans), it hits min_size and hands a single 1,000-span payload to a consumer
for export. The remaining five entries go into the next batch so the backend now
handles 2 requests instead of 10, each carrying more data and compressing
better.
If only 3 requests arrive, the batcher has 600 items so it waits for
flush_timeout to elapse before sending the 600-span payload as-is rather than
holding it indefinitely. In practice, this timeout-triggered flush is more
common than hitting min_size, especially during off-peak hours or for
lower-volume signal types like traces.
This behavior is also why the queue and batch can use different sizer units.
The queue measures what's sitting in the buffer, while the batch measures what
gets packaged into a single export call.
Controlling the per-export timeout
Each individual export attempt has a timeout, configured via the timeout
field:
1234exporters:otlp_grpc:endpoint: my-backend.example.com:4317timeout: 5s # the default
If an export call takes longer than this, it's cancelled and treated as a
failure, which then feeds into the retry logic covered in the next section. If
you're seeing frequent DeadlineExceeded errors, this is the first thing to
check, especially if your payloads are large or the network path to the backend
has high latency.
Retrying failed exports
The retry mechanism is the exporter helper's first line of defense when an export request fails. It's enabled by default and handles transient errors like brief network failures or a rolling restart of the backend.
Not every error triggers a retry. For gRPC-based exporters, only status codes that indicate a temporary, recoverable problem are retried:
UNAVAILABLE: the service is temporarily unreachable (the most common case).RESOURCE_EXHAUSTED: a downstream service is overloaded.ABORTED: the operation was aborted, often due to a concurrency issue.
For HTTP-based exporters, the equivalent signals are 503, 429, and similar
status codes.
Tuning retry behavior
Retries are controlled by the retry_on_failure block. The defaults are shown
below:
123456789exporters:otlp_grpc:endpoint: my-backend.example.com:4317retry_on_failure:enabled: trueinitial_interval: 5smultiplier: 1.5max_interval: 30smax_elapsed_time: 300s
initial_interval sets the wait before the first retry, and each subsequent
attempt multiplies the previous wait by multiplier, which creates the
exponential backoff curve.
The max_interval caps how long any single wait can grow, and
max_elapsed_time caps the total retry window for one batch. After that window
expires, the batch is dropped permanently. Setting max_elapsed_time to 0
means retries continue indefinitely.
With the default config above, the timing plays out like this:
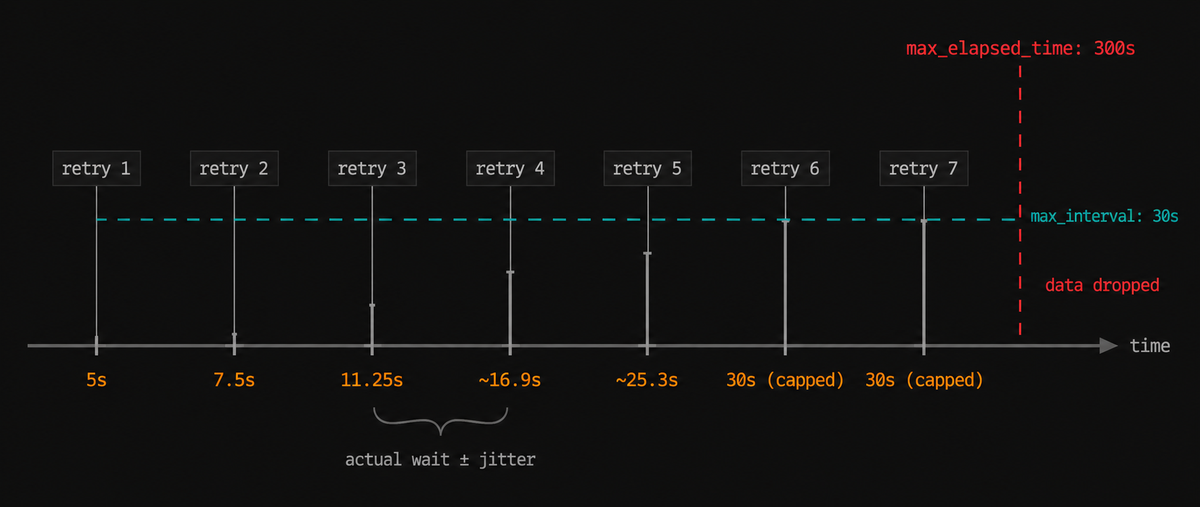
Note that these intervals are idealized. In practice, the Collector adds random jitter to each backoff to prevent multiple Collectors from retrying in lockstep and overwhelming the backend the moment it recovers (a thundering herd problem). The actual wait times will vary around these values, not match them exactly.
The relationship between retries and the queue
Understanding how retries and the queue interact is important for capacity planning. When a consumer picks up a batch and the export fails, that consumer is busy retrying and unavailable to process other items. Meanwhile, new data keeps entering the queue.
If your backend goes down for several minutes and you only have 10 consumers,
all 10 can end up stuck in retry loops. At that point no one is draining the
queue, and it fills up. Once it's full, new data gets dropped (or blocked, if
block_on_overflow is on).
Increasing num_consumers helps here, but only up to a point. If the backend is
completely unreachable, more consumers just means more concurrent connections
timing out.
A better approach is usually a combination of a larger queue_size to absorb
the backlog, a reasonable max_elapsed_time so consumers don't stay stuck
forever, and persistent storage so the data can survive a full restart of the
Collector process.
Preventing data loss when retries are exhausted
Data that fails to export is not returned to the queue. The consumer holds onto
it for the entire retry window, and if max_elapsed_time is reached, the data
is dropped permanently.
The Collector logs this as "Exporting failed. Dropping data." with a specific
no more retries left" error message along with a dropped_items count:
12026-05-26T12:10:15.899Z error internal/queue_sender.go:50 Exporting failed. Dropping data. {"resource": {"service.instance.id": "85b28da9-9258-4c3e-88fa-b937a384216d", "service.name": "otelcol-contrib", "service.version": "0.153.0"}, "otelcol.component.id": "otlp_grpc/blackhole", "otelcol.component.kind": "exporter", "otelcol.signal": "traces", "error": "no more retries left: rpc error: code = Unavailable desc = connection error: desc = \"transport: Error while dialing: dial tcp 127.0.0.1:55555: connect: connection refused\"", "dropped_items": 2}
For non-retryable errors (like gRPC INVALID_ARGUMENT or HTTP 400), the data
is dropped immediately without any retry attempt, logged as
"Exporting failed. Dropping data." with "not retryable error".
This means a backend outage can cause data loss in two places:
-
Consumers stuck in retry loops eventually give up and drop the data they're holding.
-
While those consumers are busy retrying, they aren't draining the queue. If the queue fills up before the backend recovers, incoming data gets dropped at the queue entrance (counted by
otelcol_exporter_enqueue_failed_*).
Increasing num_consumers helps absorb short outages by giving more workers a
chance to retry independently, but if the backend is completely unreachable,
more consumers just means more connections timing out in parallel.
The real mitigation is a combination of a persistent queue (so data survives
restarts), a queue_size large enough to absorb the expected backlog, and a
max_elapsed_time that matches the acceptable downtime for the endpoint.
With a persistent queue configured, setting max_elapsed_time: 0 (retry
indefinitely) is worth considering. The data is already on disk and will survive
restarts, so there's no reason to throw it away after an arbitrary timeout. The
consumer stays busy, but the data eventually gets through once the endpoint
recovers.
12345678910exporters:otlp_grpc:endpoint: my-backend.example.com:4317retry_on_failure:enabled: truemax_elapsed_time: 0sending_queue:enabled: truestorage: file_storage/exporter_queuequeue_size: 10000
The obvious effect during an extended outage is that nothing leaves the system
while the backend is down, so the queue fills up and new incoming data gets
dropped at the entrance. A larger queue_size and adequate disk space help, but
the Collector's built-in queue has limits.
For pipelines where even that level of data loss is unacceptable, you can place a message queue like Kafka between the Collector and the backend so that data accumulates in Kafka's own durable storage while the backend is unavailable.
Monitoring exporter health
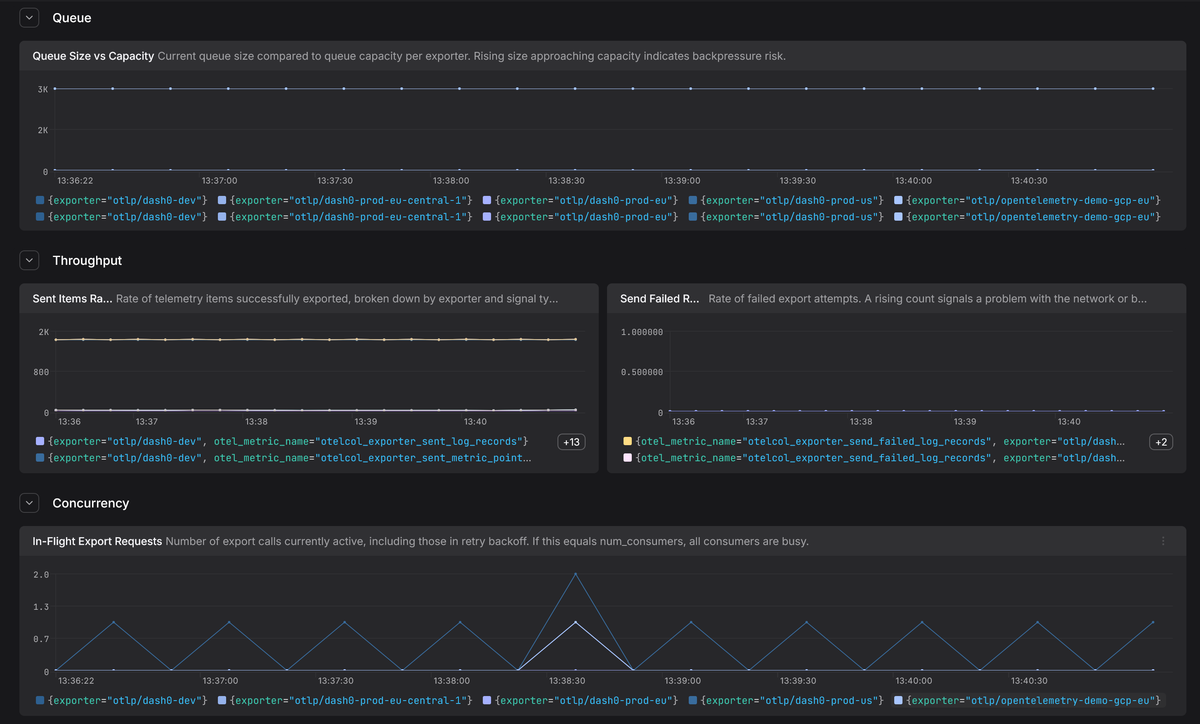
The Collector exposes internal metrics that let you see how the exporter helper is performing in real time. A few metrics are worth watching:
-
otelcol_exporter_queue_sizetells you how much data is sitting in the sending queue right now, measured in whatever unitsizeris set to. If the sizer isrequests(the default), this counts queue entries. If it'sitems, it counts individual spans, data points, or log records. If it'sbytes, it's the serialized payload size. Compare it tootelcol_exporter_queue_capacity(which uses the same unit) to see how full the buffer is. If the current occupancy keeps climbing toward capacity, it could mean the pipeline is under backpressure and you're at risk of dropping data. -
otelcol_exporter_sent_<spans|metric_points|log_records>shows how much telemetry has been delivered successfully. In a healthy pipeline this counter would steadily increase. -
otelcol_exporter_in_flight_requestscounts how many export calls are currently active, including consumers stuck in retry backoff. If this number matchesnum_consumers, every consumer is busy and nobody is pulling new data from the queue. This could be an early warning that the backend is struggling before the queue itself starts filling up. -
otelcol_exporter_send_failed_<spans|metric_points|log_records>counts failed export attempts. A rising count doesn't necessarily mean data loss (retries may still succeed), but it does signal a problem with the network or backend. -
otelcol_exporter_enqueue_failed_<spans|metric_points|log_records>counts items that never made it into the queue at all. If this one starts climbing, the queue is either full or misconfigured, and you're losing data.
Watching these signals gives you an early warning system for exporter health. They tell you whether data is flowing, stuck in the queue, or being dropped outright.
Final thoughts
The exporter helper's defaults work fine for getting started, but they're not
optimized for production resilience at scale. An in-memory queue with a 5-minute
retry cap and no batching will lose data the first time your backend has a rough
morning. Switching to a persistent queue, setting max_elapsed_time: 0, and
enabling exporter-level batching are small config changes that make a real
difference in how much telemetry survives an outage.
If you're sending data to an OpenTelemetry-native backend like Dash0, getting this layer right means the telemetry data you've carefully instrumented upstream don't get silently lost before they reach the place where they're actually useful.
