Last updated: October 1, 2026
Mastering the OpenTelemetry K8s Attributes Processor
Telemetry leaving your application usually knows its own service name and not much else. The span that recorded a slow database call has no idea which Pod emitted it, what namespace that Pod runs in, or which node it landed on, so when you go looking for a noisy neighbor or a single bad replica, there's nothing to group by.
The Kubernetes Attributes Processor is how you get that context back. It watches the Kubernetes API, holds a cache of Pod metadata in memory, matches each incoming span, log record, or metric point to a Pod, and copies the attributes you asked for onto the resource.
Almost everything that goes wrong with the processor goes wrong at that match, and the right association rule depends entirely on how you've deployed your Collector.
The frustrating part is that a failed match doesn't raise an error. Your
telemetry keeps flowing through the pipeline looking perfectly healthy, minus
every k8s.* attribute, and you often only notice when a dashboard filter or
query unexpectedly returns nothing.
The rest of this guide walks through Pod association for the topologies you're most likely to run, which metadata is worth extracting, and the RBAC required for it. It then covers what changes when you're enriching telemetry from a few thousand Pods and how to troubleshoot attributes that never show up.
How the k8sattributes processor works
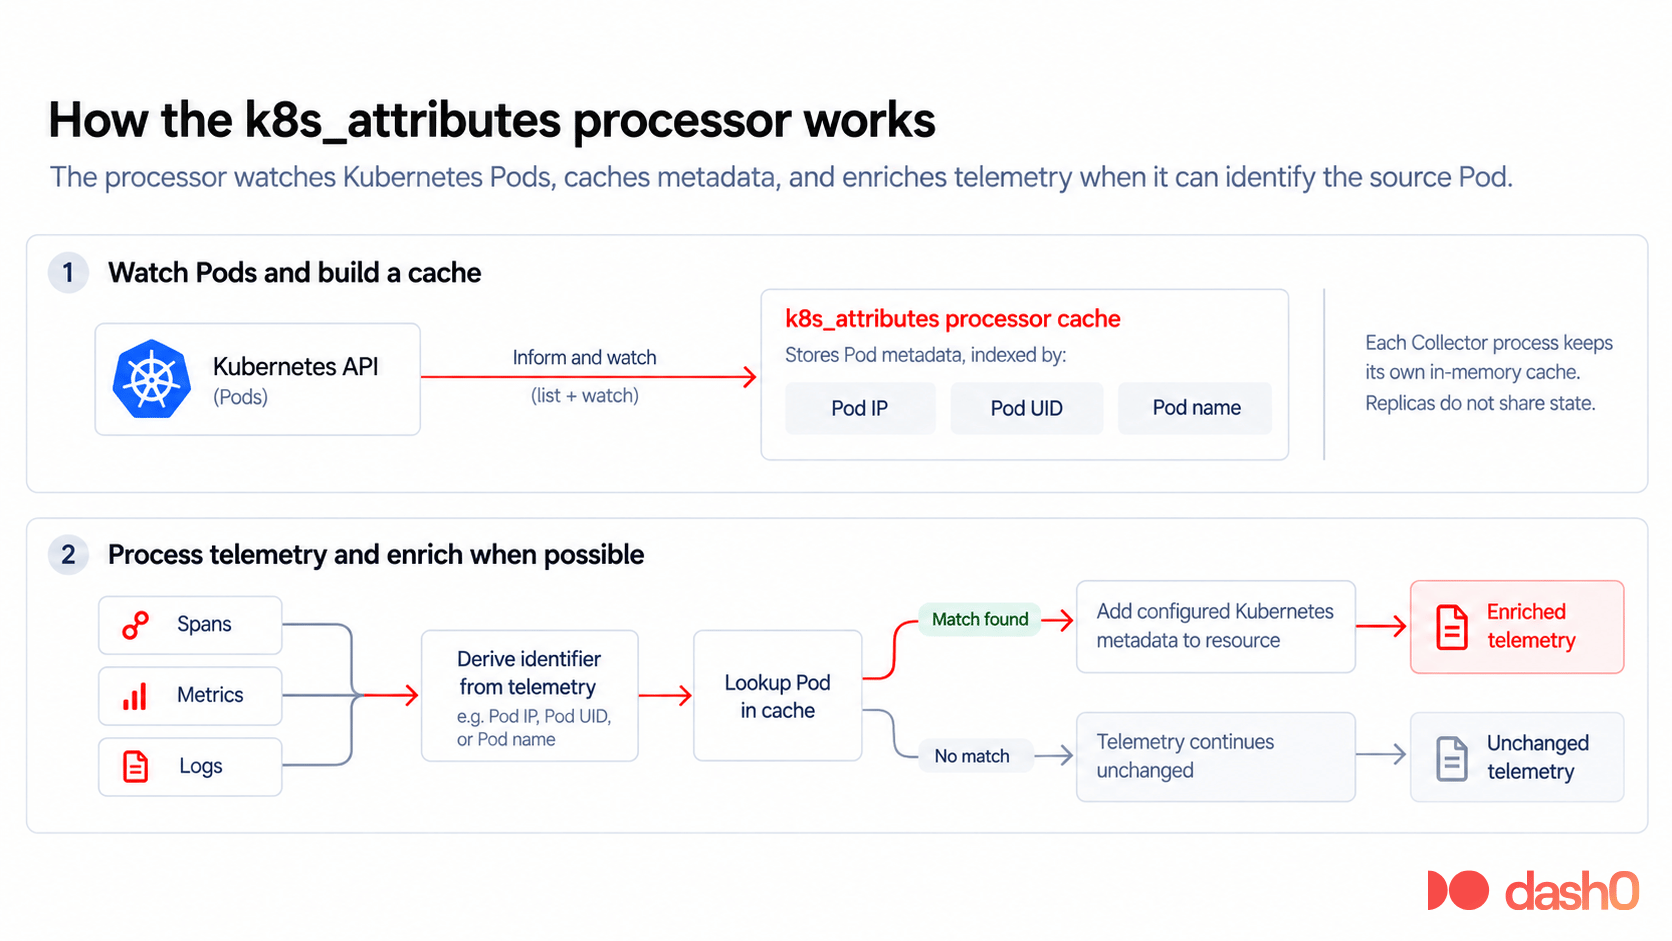
The processor watches the Kubernetes API through informers and keeps an in-memory cache of Pod metadata, indexed by identifiers such as Pod IP, UID, and name.
When spans, metrics, or logs pass through the Collector, the processor derives an identifier from the telemetry, looks for a matching Pod in the cache, and adds the configured Kubernetes metadata to the resource.
This lookup depends on the identifier being present and correct. If the processor can't match the telemetry to a Pod in its cache, there's nothing to enrich, so the telemetry continues through the pipeline unchanged.
Each Collector process maintains its own cache. Replicas don't share state, and the cache is rebuilt from the Kubernetes API after a restart. If you run six gateway replicas, you also have six independent watch clients and six copies of the relevant metadata.
The processor is included in the
Collector Contrib distribution
and in otelcol-k8s. It isn't part of the core Collector distribution, so a
configuration that uses it won't load with the otel/opentelemetry-collector
image.
The k8s_attributes naming change
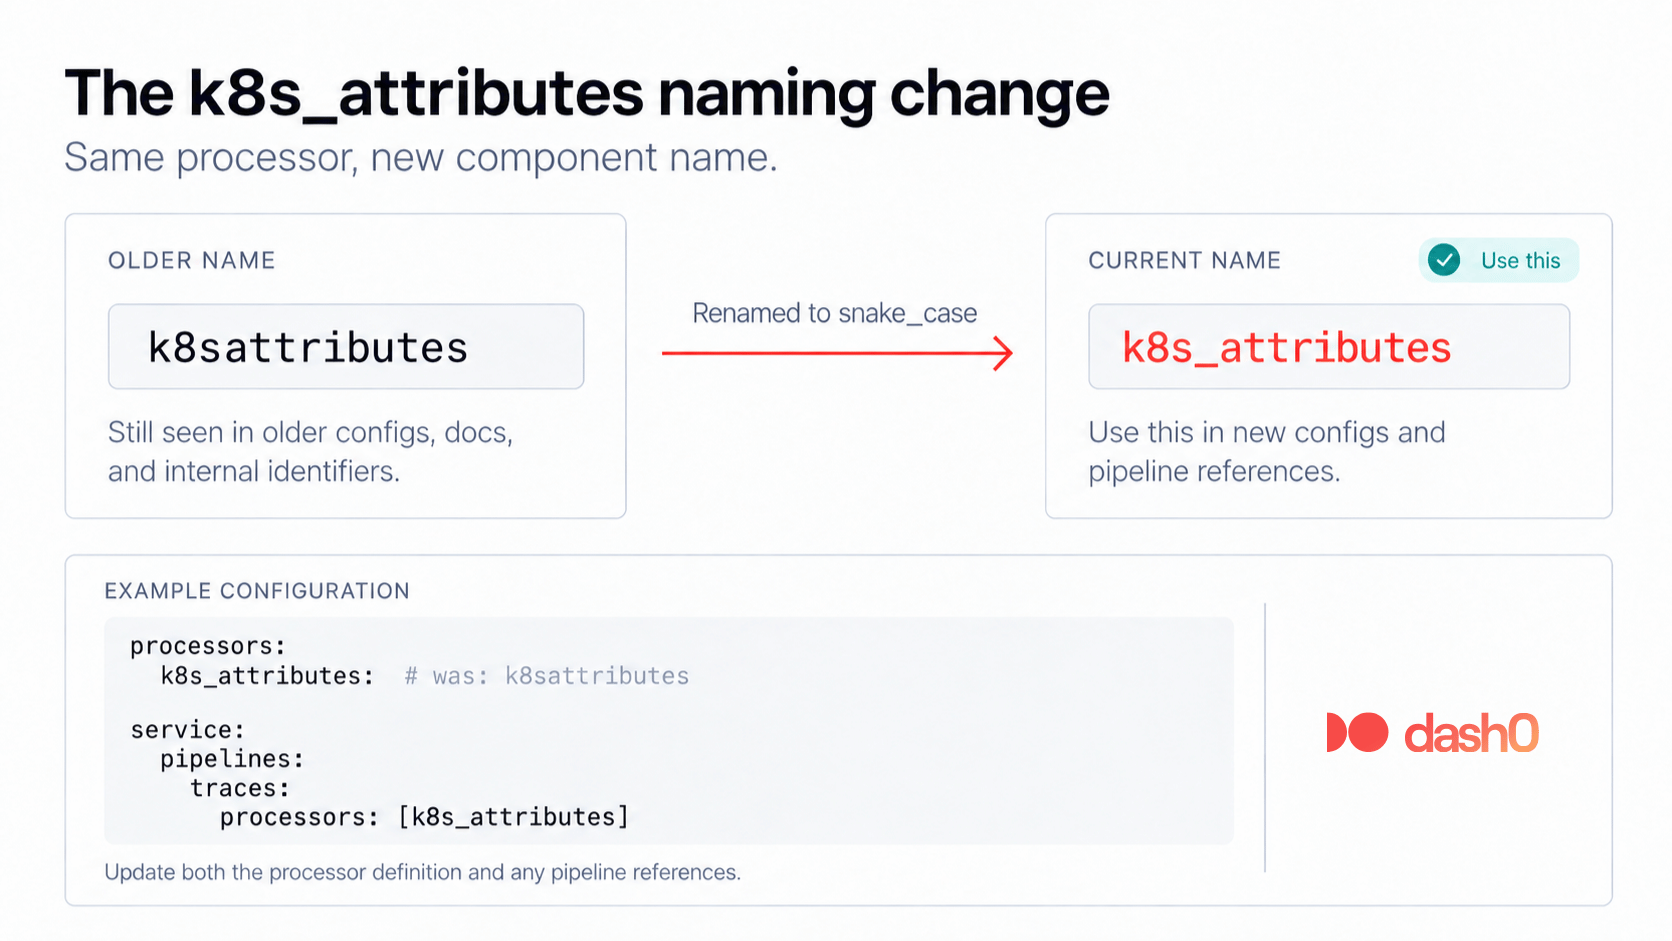
The processor was originally configured as k8sattributes, but newer Collector
releases use k8s_attributes instead, following the move toward
lower_snake_case component names. The old name still appears in older
configurations, documentation, and some internal identifiers, but we'll stick to
the latest convention throughout this article.
The processor reached v1.0.0 and Stable status in September 2026. All runtime behavior and output in this guide were verified against this stable release.
Quick start: a working Pod-UID setup
This example runs the Collector as a node-local agent and associates telemetry
with Pods using k8s.pod.uid. Because the workload supplies the UID itself, the
association doesn't depend on the source IP seen by the Collector.
Start by giving the Collector read access to Pods and namespaces:
12345678910111213141516171819202122232425262728# rbac.yamlapiVersion: v1kind: ServiceAccountmetadata:name: otel-collectornamespace: default---apiVersion: rbac.authorization.k8s.io/v1kind: ClusterRolemetadata:name: otel-collectorrules:- apiGroups: [""]resources: ["pods", "namespaces"]verbs: ["get", "watch", "list"]---apiVersion: rbac.authorization.k8s.io/v1kind: ClusterRoleBindingmetadata:name: otel-collectorsubjects:- kind: ServiceAccountname: otel-collectornamespace: defaultroleRef:kind: ClusterRolename: otel-collectorapiGroup: rbac.authorization.k8s.io
The Collector configuration below leaves out extract, so the processor uses
its default metadata set. The pod_association rule looks for k8s.pod.uid on
the incoming resource and uses it to find the corresponding Pod:
12345678910111213141516171819202122232425262728293031323334# collector-config.yamlreceivers:otlp:protocols:grpc:endpoint: 0.0.0.0:4317processors:k8s_attributes:auth_type: serviceAccountpod_association:- sources:- from: resource_attributename: k8s.pod.uidexporters:debug:verbosity: detailedservice:telemetry:metrics:readers:- pull:exporter:prometheus:host: 0.0.0.0port: 8888pipelines:traces:receivers: [otlp]processors: [k8s_attributes]exporters: [debug]
That file becomes the ConfigMap the agent mounts:
12kubectl create configmap otel-agent-conf \--from-file=config.yaml=collector-config.yaml
Run the Collector as a DaemonSet so each node has a local agent. Mount the configuration and expose the OTLP port on the node:
1234567891011121314151617181920212223242526# otel-agent.yamlapiVersion: apps/v1kind: DaemonSetmetadata:name: otel-agentnamespace: defaultspec:selector:matchLabels: { app: otel-agent }template:metadata:labels: { app: otel-agent }spec:serviceAccountName: otel-collectorcontainers:- name: collectorimage: otel/opentelemetry-collector-contrib:0.161.0args: ["--config=/conf/config.yaml"]ports:- { containerPort: 4317, hostPort: 4317 }- { containerPort: 8888 }volumeMounts:- { name: conf, mountPath: /conf }volumes:- name: confconfigMap: { name: otel-agent-conf }
Your application also needs to add its Pod UID to its OpenTelemetry resource. The Kubernetes downward API can expose both the Pod UID and the node IP as environment variables:
12345678910111213141516# Add under spec.template.spec.containers[]env:- name: HOST_IPvalueFrom:fieldRef:fieldPath: status.hostIP- name: K8S_POD_UIDvalueFrom:fieldRef:fieldPath: metadata.uid- name: OTEL_RESOURCE_ATTRIBUTESvalue: "k8s.pod.uid=$(K8S_POD_UID)"- name: OTEL_EXPORTER_OTLP_ENDPOINTvalue: "http://$(HOST_IP):4317"- name: OTEL_EXPORTER_OTLP_PROTOCOLvalue: grpc
Apply the RBAC and Collector DaemonSet:
1kubectl apply -f rbac.yaml -f otel-agent.yaml
Then apply or restart your application workload after adding the environment variables above.
The application now sends telemetry to the Collector on its own node and includes the identifier the processor needs for association.
Because the debug exporter prints resource attributes, you can inspect the Collector logs to confirm that enrichment worked:
1kubectl logs ds/otel-agent
For a Deployment named payments in the default namespace, the resource
contains attributes like these:
12345678910111213ResourceSpan #0Resource attributes:-> k8s.pod.uid: Str(f92d7346-1dd0-4bb2-84c9-511fed878d26)-> service.name: Str(payments)-> k8s.deployment.name: Str(payments)-> k8s.node.name: Str(qs-verify-control-plane)-> k8s.pod.name: Str(payments-79455d6b-pct47)-> k8s.namespace.name: Str(default)-> k8s.pod.start_time: Str(2026-09-24T10:43:48Z)-> container.image.name: Str(ghcr.io/open-telemetry/opentelemetry-collector-contrib/telemetrygen)-> container.image.tags: Slice(["v0.161.0"])
The two container.image.* attributes appear here because this workload runs in
a single-container Pod, so the processor can identify the container
unambiguously. In a multi-container Pod, those attributes are not added unless
the incoming resource includes a container discriminator such as container.id
or k8s.container.name.
Notice that k8s.deployment.name appears even though the ClusterRole doesn't
grant access to ReplicaSets. The processor can derive the Deployment name from
the ReplicaSet name, so this setup only needs access to Pods and namespaces.
You can also check the processor's own metrics. This gives you a more direct signal that Pod association succeeded:
1kubectl port-forward ds/otel-agent 8888:8888
12curl -s localhost:8888/metrics \| grep otelcol_k8s_pod_association
1otelcol_k8s_pod_association{otelcol_signal="traces",pod_identifier="resource_attribute/k8s.pod.uid",status="success"} 13
Here, status="success" confirms that the processor found a matching Pod, while
pod_identifier tells you which association rule matched.
The rest of the guide explains the choices behind this setup, including why a carried Pod UID is more reliable than connection-based association, what additional metadata you can extract, which Kubernetes permissions those options require, and how to troubleshoot failed associations.
Matching telemetry to Kubernetes Pods
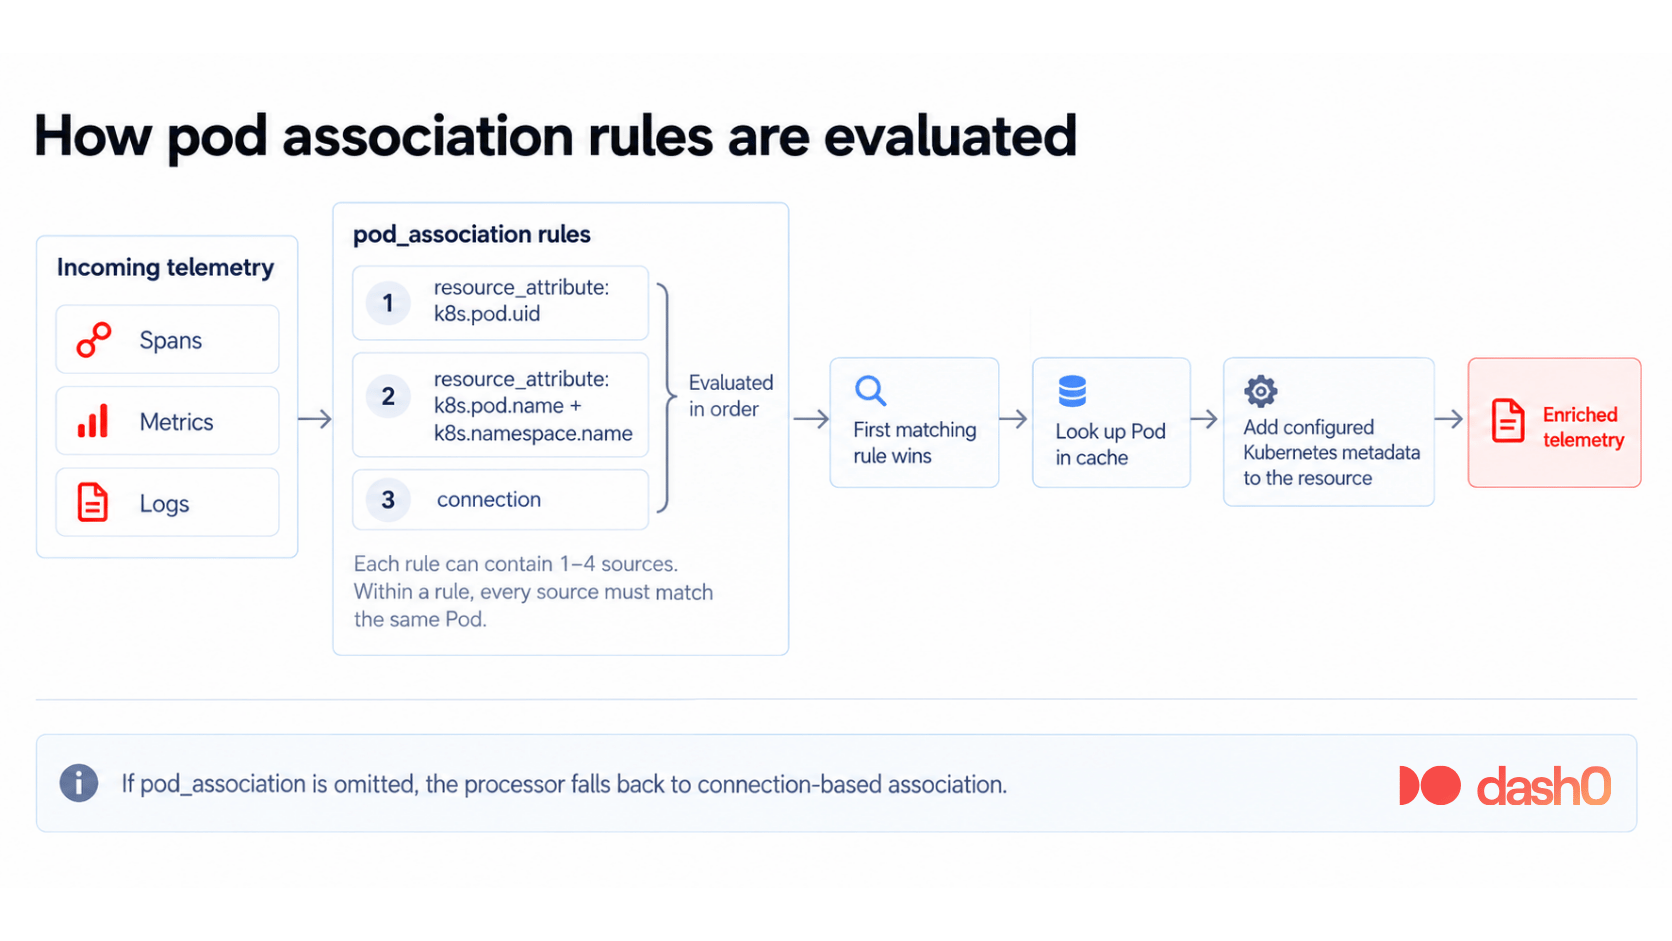
The pod_association setting defines how the processor identifies the Pod that
produced a piece of telemetry. Each rule can contain up to four sources, using
either of these source types:
connection, which uses the source IP of the incoming connection.resource_attribute, which reads a named attribute from the incoming resource.
If you omit pod_association, the processor falls back to connection-based
association.
The processor evaluates rules in order and stops at the first match. Within a
rule, every source must match. For example, a rule using both k8s.pod.name and
k8s.namespace.name only succeeds when both attributes are present and identify
the same Pod.
Each rule can contain at most four sources. The Collector rejects a configuration that exceeds that limit with the following error:
1too many association sources. limit is 4
Duplicate rules are rejected as well, even when their sources appear in a different order. These two rules are therefore equivalent:
12345678910# collector-config.yamlprocessors:k8s_attributes:pod_association:- sources:- { from: resource_attribute, name: k8s.pod.name }- { from: resource_attribute, name: k8s.namespace.name }- sources:- { from: resource_attribute, name: k8s.namespace.name }- { from: resource_attribute, name: k8s.pod.name }
The Collector reports the duplication during validation:
1duplicate pod association: resource_attribute/k8s.namespace.name,resource_attribute/k8s.pod.name
A resource_attribute source also has to refer to an attribute that appears in
extract.metadata. If you associate on k8s.pod.uid, for example, that
attribute must also be available for extraction.
There are a few exceptions. service.version and service.instance.id can't be
used as association sources, while container.id can only be used when at least
one container is included in extract.metadata.
The short-circuit rule
A common pod_association pattern tries a resource attribute first, then falls
back to the connection:
123456789# collector-config.yamlprocessors:k8s_attributes:pod_association:- sources:- from: resource_attributename: k8s.pod.ip- sources:- from: connection
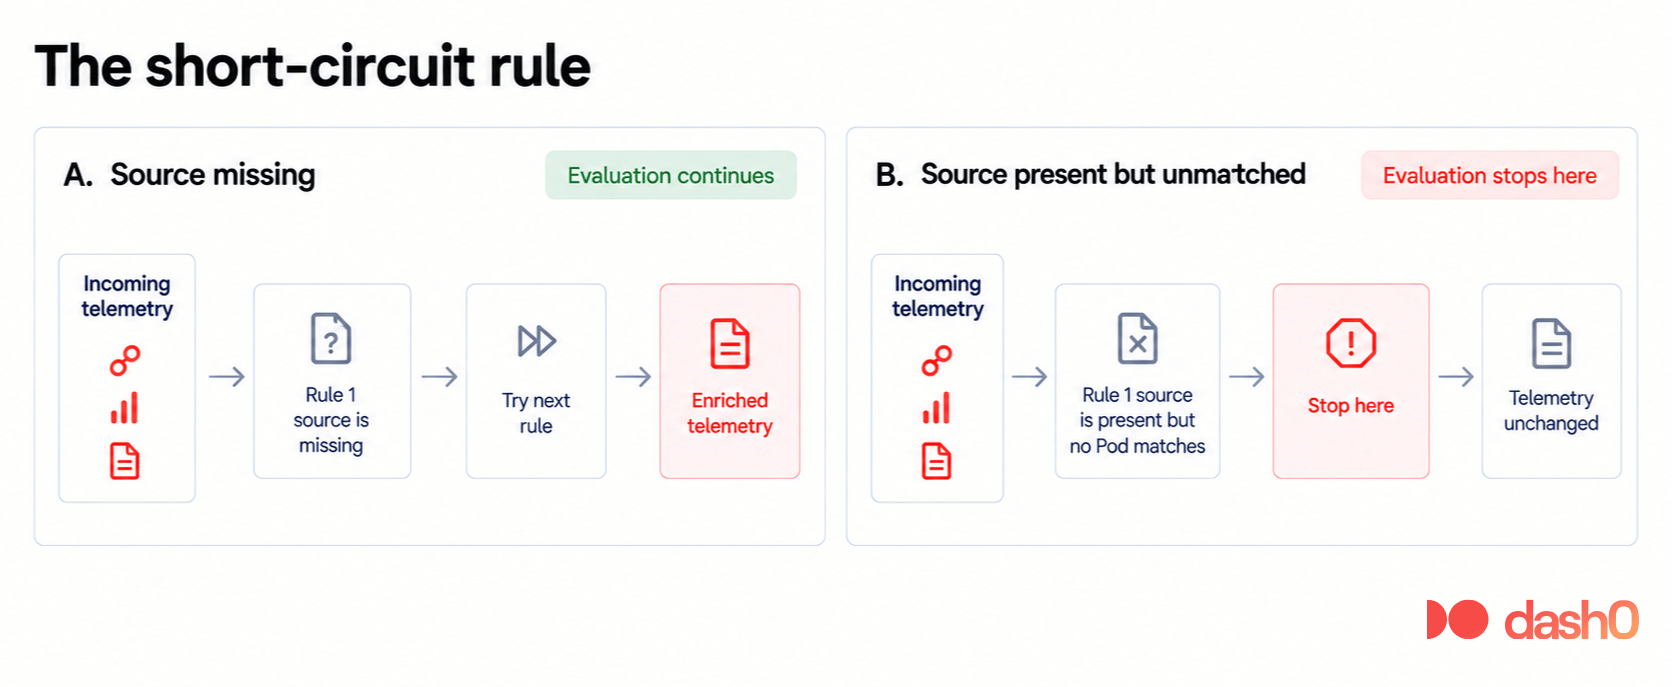
If k8s.pod.ip is absent, the processor skips the first rule and evaluates the
connection rule, and enrichment proceeds normally if that rule matches.
If k8s.pod.ip is present but doesn't match a Pod in the processor's cache, the
first rule fails and the processor doesn't continue to the connection rule.
For example, a stale or incorrect Pod IP leaves the resource unenriched:
123Resource attributes:-> k8s.pod.ip: Str(10.255.255.254)-> service.name: Str(telemetrygen)
The processor's internal metrics show the failed association against the first rule:
1otelcol_k8s_pod_association{pod_identifier="resource_attribute/k8s.pod.ip",status="error"} 9
A missing source lets evaluation continue to the next rule, while a source that's present but can't be matched stops evaluation at that rule. Rule ordering should therefore favor identifiers you trust over the most specific identifier available. Adding an unreliable rule ahead of a working connection rule can prevent enrichment that would otherwise have succeeded.
When you can provide it, k8s.pod.uid is a good association key. Kubernetes can
inject the Pod UID through the downward API, and the value remains fixed for the
lifetime of the Pod:
1234567env:- name: K8S_POD_UIDvalueFrom:fieldRef:fieldPath: metadata.uid- name: OTEL_RESOURCE_ATTRIBUTESvalue: "k8s.pod.uid=$(K8S_POD_UID)"
You can then use that UID as the first association rule:
1234567891011# collector-config.yamlprocessors:k8s_attributes:extract:metadata: [k8s.namespace.name, k8s.pod.name, k8s.pod.uid, k8s.node.name]pod_association:- sources:- from: resource_attributename: k8s.pod.uid- sources:- from: connection
Matching association to your deployment topology
Connection-based association works only when the address observed by the
Collector still identifies the workload Pod. A node-local Collector makes that
possible, but does not guarantee it since Services, hostPort, proxies, load
balancers, and other network hops may rewrite or hide the original source
address.
With a DaemonSet agent receiving telemetry directly from workload Pods, the
Collector may see the workload Pod's source IP and connection association can
work. Whether it does depends on the network path and the cluster's networking
implementation.
Once telemetry is forwarded through another Collector, the downstream gateway
normally sees the forwarding Collector's connection rather than the original
workload's. In that topology, carry a Pod identifier such as k8s.pod.uid or
k8s.pod.ip with the telemetry and associate on that resource attribute
instead.
In a gateway deployment, the path is different. Agents receive telemetry first and forward it over OTLP to a central Collector. The gateway sees the agent's IP, not the workload Pod's IP, so connection-based association there would identify the forwarding agent rather than the original workload.
One way to preserve the Pod identity across that hop is to run the agent in
passthrough mode:
12345# collector-config.yaml# Agent DaemonSetprocessors:k8s_attributes:passthrough: true
The gateway can then associate telemetry using the k8s.pod.ip resource
attribute carried by the agent:
12345678# collector-config.yaml# Gatewayprocessors:k8s_attributes:pod_association:- sources:- from: resource_attributename: k8s.pod.ip
With passthrough: true, the agent only adds the Pod IP and skips the normal
Kubernetes metadata set, leaving association and enrichment to the downstream
Collector.
Gateway scaling also affects API usage. Each Collector replica maintains its own cache and watches the Kubernetes API independently, so adding replicas adds more watch clients and more copies of the cached metadata.
Where the processor must sit in the pipeline
If any association rule uses connection, k8s_attributes needs to run before
a processor that no longer preserves the original connection context.
It should also run before processors that depend on Kubernetes metadata. Tail
sampling is a good example. A policy that matches on k8s.namespace.name cannot
evaluate that attribute until k8s_attributes has added it.
123456service:pipelines:traces:receivers: [otlp]processors: [k8s_attributes, tail_sampling]exporters: [otlp]
Where connection/IP-based association becomes unreliable
IP-based association breaks whenever the Collector can't see an address that uniquely identifies the workload Pod.
Host-network Pods are one example. Because they share the node's network namespace, their traffic uses the node's IP rather than a Pod-specific address. The upstream documentation therefore recommends using a non-IP association rule for these workloads.
Sidecar deployments have the same problem. The Collector can't reliably infer the application Pod from the connection alone, so the downward API is the safer way to carry Pod identity.
Service meshes introduce another variation. The sidecar proxy terminates and recreates the connection, which means the Collector may see the proxy's address rather than the original workload's.
The same limitation applies more broadly to anything that rewrites or hides the source address, including some Services and load balancers on the path to a gateway. Some receivers don't have workload connection context in the first place. A receiver tailing log files or scraping a Prometheus endpoint, for example, isn't receiving a direct connection from the application Pod.
In these cases, don't rely on the incoming connection IP. Prefer an explicit Pod
identifier such as k8s.pod.uid when your telemetry path can carry one.
Choosing Kubernetes metadata to extract
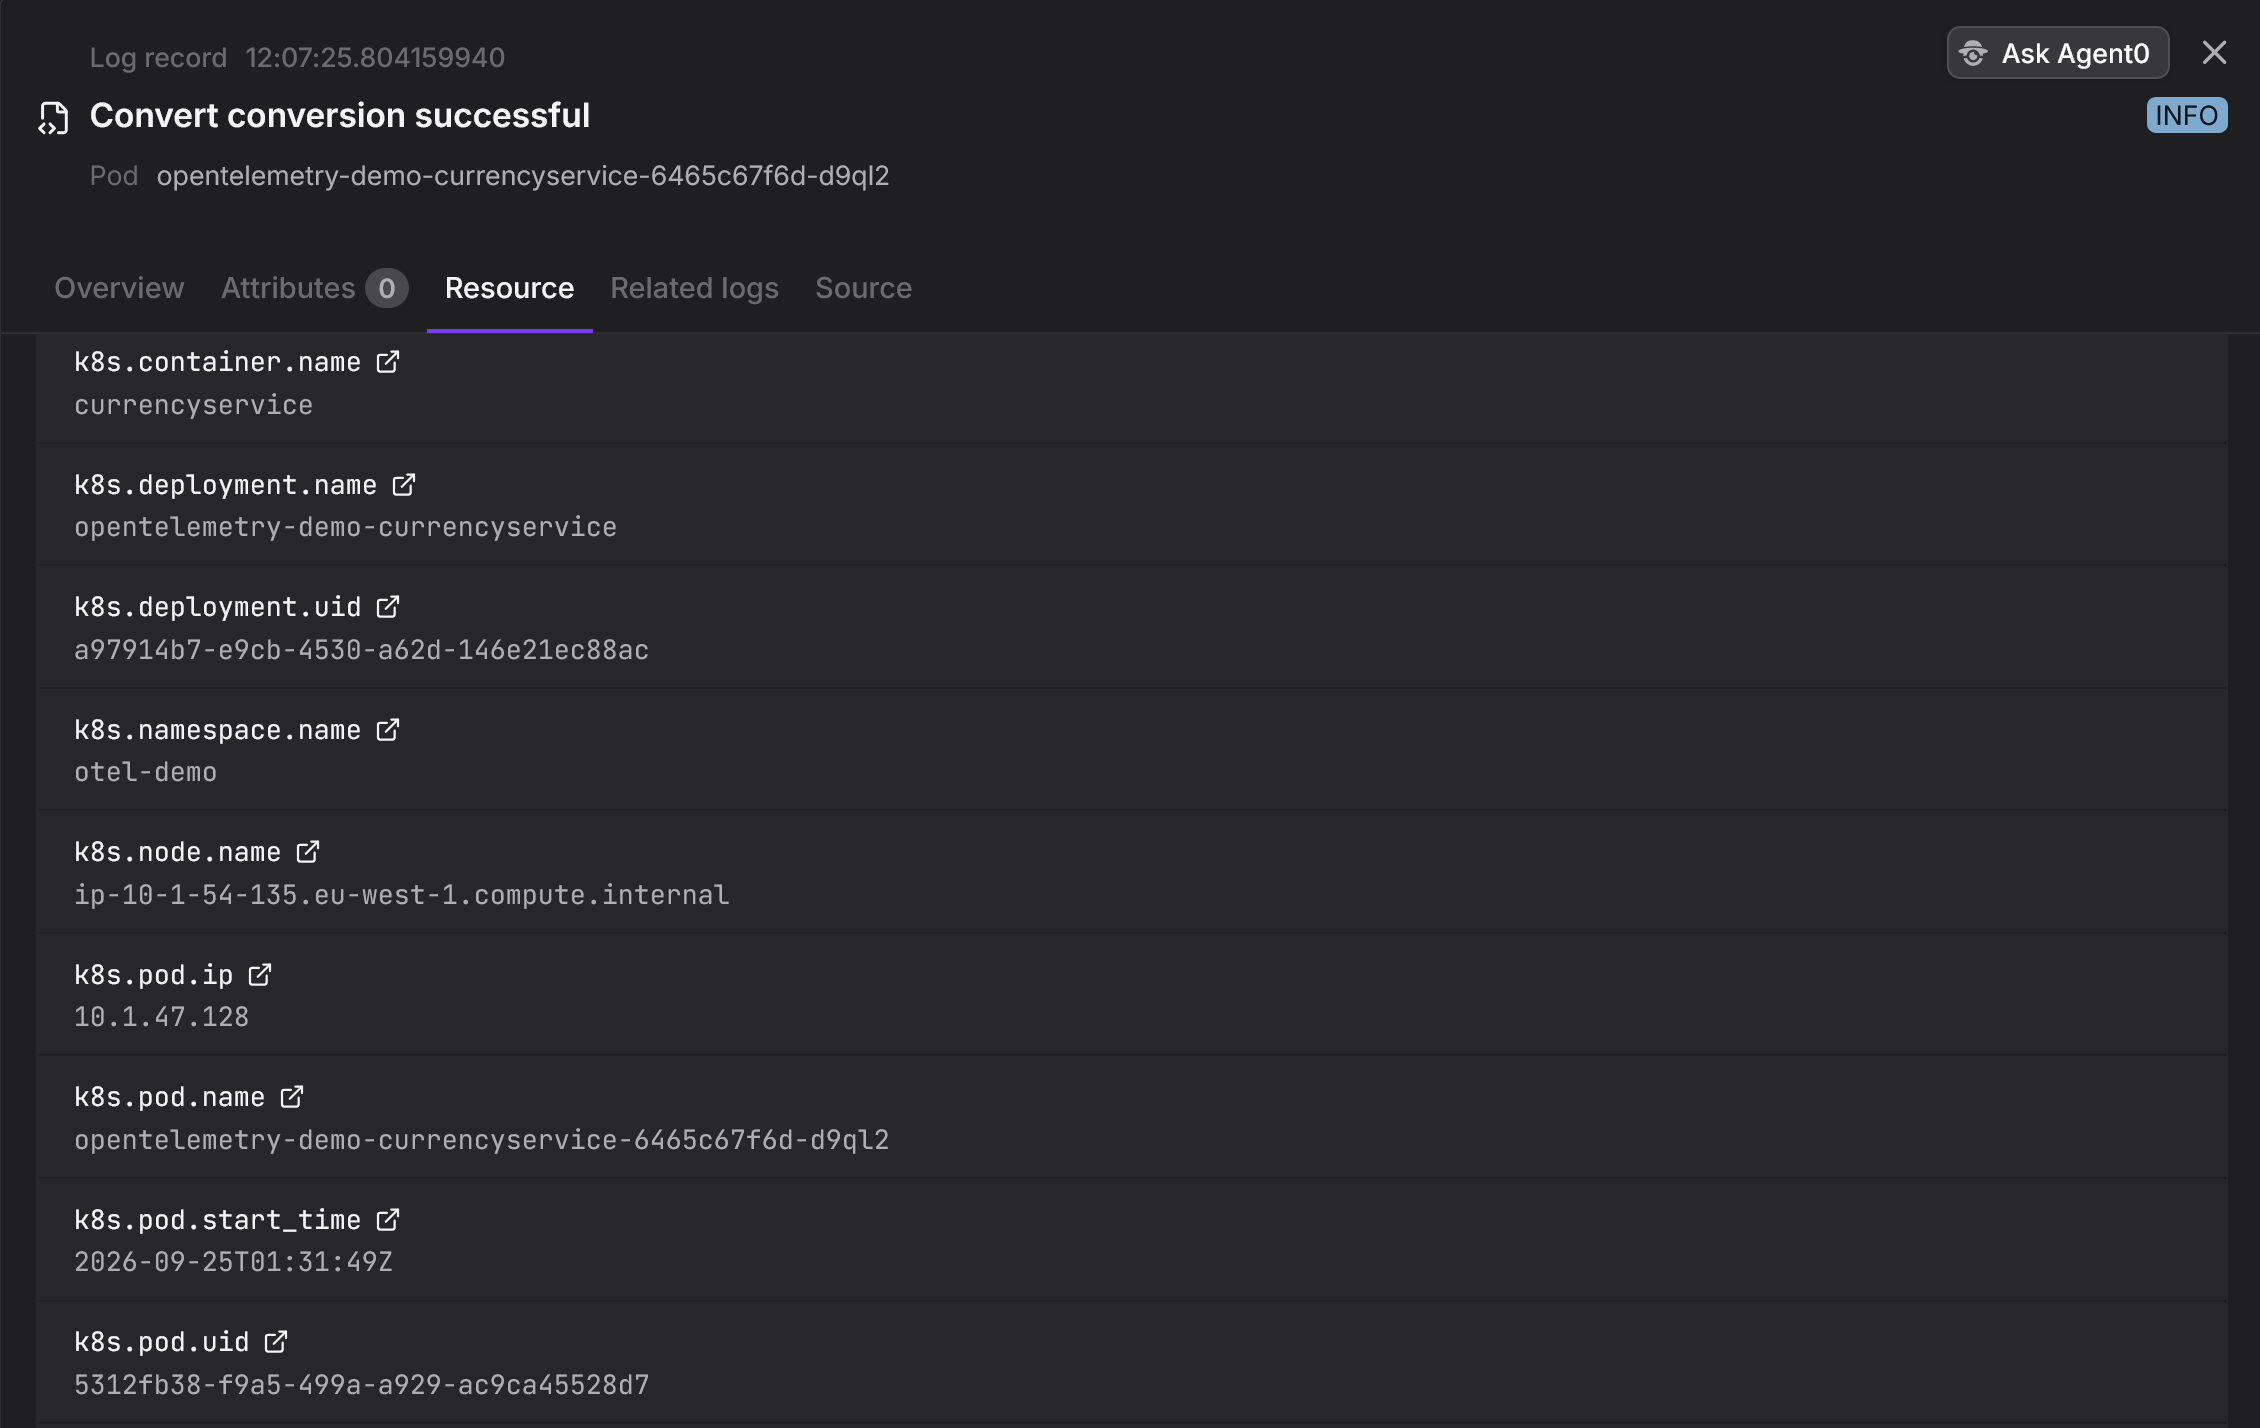
The processor extracts these six attributes by default:
k8s.namespace.name,k8s.pod.name,k8s.pod.uid,k8s.pod.start_time,k8s.deployment.name,- and
k8s.node.name.
Anything beyond that must be added through extract.metadata. The processor
validates this list strictly, so an unsupported attribute causes configuration
validation to fail instead of being ignored.
For example, this preserves the default attributes and adds
k8s.deployment.uid:
123456789101112# collector-config.yamlprocessors:k8s_attributes:extract:metadata:- k8s.namespace.name- k8s.pod.name- k8s.pod.uid- k8s.pod.start_time- k8s.deployment.name- k8s.node.name- k8s.deployment.uid
Some additions are effectively free, while others require extra Kubernetes API watches and RBAC permissions:
| Attribute or source | Additional cost |
|---|---|
k8s.deployment.name | None. Derived from the ReplicaSet name. |
k8s.deployment.uid | Deployment and ReplicaSet informers, plus ReplicaSet RBAC. |
k8s.cronjob.name | None. Derived from the Job name. |
k8s.cronjob.uid | Job informer, plus Job RBAC. |
| Labels or annotations from workloads or nodes | Starts the corresponding informer. |
Use the UID variants when you need the exact Kubernetes object identity. If the derived workload name is enough, the name attributes avoid the extra watches.
Container metadata needs an additional identifier because a Pod can contain
multiple containers. If incoming telemetry includes container.id, the
processor can add attributes such as k8s.container.name, image metadata,
service.version, and service.instance.id.
If the resource instead carries k8s.container.name, the processor can recover
container.id along with the same related metadata. You can also include
k8s.container.restart_count when you need to identify a specific container
instance. Without it, the processor uses the latest instance.
The processor can also derive service.name, service.namespace,
service.version, and service.instance.id from Kubernetes metadata according
to the
non-normative Kubernetes attributes guidance.
For service.name, the resource.opentelemetry.io/service.name annotation
takes precedence, followed by Kubernetes application labels and then workload or
Pod names. The semantic conventions document the complete precedence rules for
all four service attributes.
Setting extract.otel_annotations: true provides another option. An annotation
such as resource.opentelemetry.io/foo becomes a foo resource attribute.
Some older examples use a regex field inside extract.labels or
extract.annotations. That field is no longer accepted, and unknown keys cause
the Collector configuration to fail validation:
1'extract.labels[0]' has invalid keys: regex
Use the supported fields instead: tag_name, key, key_regex, and from.
Extracting labels and annotations
Label and annotation extraction rules use either key for an exact match or
key_regex for a pattern. The two are mutually exclusive, so setting both in
the same rule causes configuration validation to fail.
key_regex matches the entire key. The processor anchors the expression
automatically, so a partial pattern won't match unless your regex accounts for
the rest of the key.
The from field selects which Kubernetes object to read from. It accepts pod,
which is the default, along with namespace, node, deployment,
replicaset, statefulset, daemonset, job, and cronjob.
For example, this configuration extracts Pod labels whose keys start with
dash0.io/ or plain.:
12345678910# collector-config.yamlprocessors:k8s_attributes:extract:labels:- tag_name: "$$1"key_regex: dash0\.io/(.*)from: pod- key_regex: plain\.(.*)from: pod
tag_name controls the resource attribute name created from the match. You can
use regex capture groups in tag_name, which lets one rule handle an entire
label prefix.
If you omit tag_name, the processor generates the attribute name for you. For
Pod labels, the resulting key follows this pattern:
1k8s.pod.label.<key>
Equivalent prefixes are used for annotations and for metadata extracted from other Kubernetes objects such as namespaces and nodes.
Granting the right RBAC
By default, the processor authenticates to the Kubernetes API with its
ServiceAccount using auth_type: serviceAccount. It needs permission to read
the resources required by the metadata you want to extract.
For the default metadata set, access to Pods and namespaces is enough:
123456789# collector-config.yamlapiVersion: rbac.authorization.k8s.io/v1kind: ClusterRolemetadata:name: otel-collectorrules:- apiGroups: [""]resources: ["pods", "namespaces"]verbs: ["get", "watch", "list"]
That covers all six default attributes, including k8s.deployment.name. The
processor derives the Deployment name from the ReplicaSet name, so extracting it
does not require direct access to ReplicaSets.
Additional permissions are only needed when you enable metadata that depends on other Kubernetes resources:
| Resource | Required when |
|---|---|
replicasets in apps | Extracting k8s.deployment.uid, or labels and annotations from: deployment or from: replicaset |
nodes in the core API | Extracting k8s.node.uid, or labels and annotations from: node |
jobs in batch | Extracting k8s.cronjob.uid, or labels and annotations from: job or from: cronjob |
cronjobs in batch | Extracting labels and annotations from: cronjob |
These resources use the same get, watch, and list verbs.
Check example RBAC manifests before copying them unchanged. Some grant access to ReplicaSets, Deployments, StatefulSets, DaemonSets, Jobs, CronJobs, and legacy API groups even when the processor configuration does not use them. Keeping the ClusterRole aligned with the metadata you actually extract gives the Collector only the permissions it needs.
Namespace-scoped RBAC
If a Collector only enriches telemetry from one namespace, you can scope both
its RBAC and filter.namespace to that namespace.
This changes what the processor can enrich. Cluster-scoped resources are no
longer available, so metadata extracted using from: node will not work. You
also cannot populate k8s.cluster.uid, because the processor derives it from
the UID of the kube-system namespace.
Namespace scoping also limits the processor's cache to that namespace, so every workload whose telemetry reaches the Collector must belong to it.
This matters especially for gateways. If a gateway receives telemetry from outside the configured namespace, that telemetry will not be enriched.
Confirming enrichment is working
The processor exposes internal metrics that tell you whether Pod association is succeeding. Start there before debugging the enrichment rules themselves.
otelcol.k8s.pod.association is a monotonic counter with three useful
attributes: status, pod_identifier, and otelcol.signal. Enable the
Collector's internal metrics endpoint so you can inspect it:
123456789service:telemetry:metrics:readers:- pull:exporter:prometheus:host: 0.0.0.0port: 8888
Then query the Kubernetes-related metrics:
1curl -s localhost:8888/metrics | grep otelcol_k8s
A healthy processor might expose output like this:
1234otelcol_k8s_pod_association{otelcol_signal="traces",pod_identifier="connection",status="success"} 9otelcol_k8s_watcher_pod_added 11otelcol_k8s_watcher_pod_cache_size 21otelcol_k8s_watcher_pod_updated 6
A rising status="error" series means Pod association is failing, and
pod_identifier tells you which association rule produced the failure.
Also check otelcol_k8s_watcher_pod_cache_size. If the cache is empty, or much
smaller than expected, the problem is more likely to be RBAC or filtering than
the association rule itself.
These are useful signals to put on a dashboard and, once you've established the normal baseline for your deployment, alert on:
123sum by (pod_identifier) (rate(otelcol_k8s_pod_association{status="error"}[5m]))
1otelcol_k8s_watcher_pod_cache_size == 0
These metrics are emitted by each Collector process independently. If you run the processor as a DaemonSet or with several gateway replicas, aggregate across the labels your metrics pipeline uses to identify Collector instances. Otherwise the same underlying problem can produce one alert per replica.
Once association is succeeding, check which attributes are actually being added.
The debug exporter is useful for this:
123exporters:debug:verbosity: detailed
With detailed output enabled, the Collector prints the resource attributes on
exported telemetry so you can verify that attributes such as k8s.pod.name,
k8s.namespace.name, and the expected workload metadata are present before you
send the data to your production backend.
Keeping the K8s attributes processor cheap at scale
Every Collector process running k8s_attributes maintains its own metadata
cache and watches the Kubernetes API. On an unfiltered DaemonSet, that can mean
one cluster-wide Pod watch per node, with every agent tracking every Pod in the
cluster.
For node-local agents, the biggest optimization is node filtering. The processor and the DaemonSet environment have to agree on the node name.
Configure the processor like this:
12345# collector-config.yamlprocessors:k8s_attributes:filter:node_from_env_var: KUBE_NODE_NAME
Then expose the node name to the Collector Pod through the downward API:
123456# DaemonSet container environmentenv:- name: KUBE_NODE_NAMEvalueFrom:fieldRef:fieldPath: spec.nodeName
If the environment variable is missing, the processor fails configuration validation instead of starting without the filter.
A node-filtered agent can only enrich telemetry from Pods on its own node. That fits the DaemonSet topology, where applications send telemetry to the local Collector. It doesn't fit a gateway that receives telemetry forwarded from other nodes, because the gateway needs visibility into Pods across the cluster.
On very large clusters, you can also disable periodic informer resync:
1234# collector-config.yamlprocessors:k8s_attributes:watch_sync_period: 0s
Periodic resync reprocesses objects that are already in the cache. Kubernetes watch events still deliver normal object changes, so disabling resync can reduce CPU and allocation spikes on clusters with very large object counts. The trade-off is that you lose the periodic reconciliation pass.
Two other settings affect startup and deletion behavior more than steady-state cost.
-
wait_for_metadatadefaults tofalse, so telemetry that arrives before the initial cache sync can pass through without Kubernetes enrichment. If you set it totrue, the processor waits for metadata before becoming ready, subject towait_for_metadata_timeout. -
pod_delete_grace_periodcontrols how long metadata for a deleted Pod remains in the cache. Keeping it briefly allows telemetry that arrives just after Pod termination to still be enriched.
Memory usage depends mainly on how many Kubernetes objects the processor watches and how much metadata it retains for them. Extracting more labels and annotations, enabling metadata from additional object types, and running more informers all increase the amount of cached state.
The upstream project publishes KWOK-based load-test benchmarks with CPU and memory results at different workload sizes. Those benchmarks are a better basis for capacity planning than applying a fixed per-Pod estimate across clusters with different extraction rules and topologies.
Troubleshooting missing Kubernetes attributes
Missing Kubernetes attributes can come from several parts of the pipeline. Work through these checks in order to figure out why:
-
Check Pod association. Scrape
otelcol_k8s_pod_associationas described earlier. Astatus="error"series means the processor is receiving telemetry but failing to match it to a Pod. Thepod_identifierattribute tells you which association rule failed.If the metric is absent entirely, check whether the telemetry is reaching the processor at all. That points to the receiver or pipeline rather than Pod association.
-
Read the Collector logs. Kubernetes API permission problems usually show up as errors such as
forbiddenorcannot list resource "pods". Configuration errors prevent the Collector from starting, so also check for invalid extraction fields, missing environment variables used bynode_from_env_var, and other startup failures.Make sure the Collector distribution includes the
k8s_attributesprocessor as well. -
Check pipeline placement. If an association rule uses
connection, confirm thatk8s_attributesruns before any processor that removes the original connection context. It should also run before processors such as tail sampling when their decisions depend on Kubernetes attributes added during enrichment. -
Check the Pod cache through
otelcol_k8s_watcher_pod_cache_size. A value of zero, or one much smaller than expected, means the processor isn't watching the Pods you expect. Check its RBAC permissions,filter.namespace, and any node filter configured throughnode_from_env_var. -
Inspect the incoming resource. Enable the
debugexporter withverbosity: detailedand examine the resource attributes before assuming the association rules are wrong. This often reveals that an expected source attribute is missing or contains an unexpected value. Remember that a source attribute that's present but cannot be matched stops evaluation of later association rules. -
Revisit the extraction and association configuration. If the previous checks look correct, inspect the specific metadata you requested. Confirm that association attributes are included where required, that container telemetry has enough information to identify the correct container, and that the attribute you expect is either part of the default metadata set or explicitly listed under
extract.metadata.
If enrichment is missing briefly after every Collector restart and then starts
working, check wait_for_metadata. With its default behavior, telemetry can
arrive before the initial Kubernetes metadata cache has finished syncing.
Final thoughts
The k8s_attributes processor is easiest to reason about as a join. Choose an
association key that survives your telemetry path, keep the Collector's
Kubernetes visibility aligned with the workloads it receives, and monitor the
association metrics so failures are visible instead of inferred from missing
attributes.
For guidance on which Kubernetes attributes are worth keeping, see OpenTelemetry Resource Attributes: Best Practices for Kubernetes.
To inspect enriched Kubernetes telemetry in an OTel-native observability platform, you can use Dash0 free for 14 days and send the same OTLP data without changing your instrumentation.