Last updated: July 6, 2025
Managing Systemd Logs on Linux with Journalctl
On modern Linux distributions, systemd is the standard system and service manager. A key component of this suite is the systemd-journald daemon, a centralized and efficient service that has fundamentally changed how log data is handled.
Instead of writing to various plain-text files, journald captures logs from the kernel, system services, and applications, and stores them in a structured, indexed binary format.
Accompanying this service is the journalctl command-line utility which is the primary tool for querying, filtering, and viewing the logs collected by journald. In essence:
journaldis the service that collects and stores the logs.journalctlis the command you use to read and analyze them.
This guide explores how to use journalctl effectively, with a focus on production-ready practices—covering log persistence, performance optimization, structured data extraction, and integration with modern observability frameworks such as OpenTelemetry.
How the system journal is populated
The systemd-journald service is designed to be a universal log collector for virtually every message generated on a Linux system. It achieves this by listening to several key sources simultaneously, including the following:
1. Systemd services
When systemd launches a service, it automatically redirects the service’s standard output (stdout) and standard error (stderr) to the journal.
This means that applications no longer need to be explicitly configured to log to a file or syslog. Any message they print to the console is automatically captured, tagged with the service unit it came from, and stored by journald.
2. Kernel messages
journald reads directly from the /dev/kmsg device file and tags them with (_TRANSPORT=kernel). This is the canonical source for all messages generated by the Linux kernel, including those related to hardware detection, driver issues, and firewall activity.
3. Syslog
To maintain backward compatibility, journald provides a standard syslog-compatible socket at /run/systemd/journal/syslog. Legacy applications that are hard-coded to send logs via the syslog() system call (or through logger) will have their messages seamlessly accepted by this socket and ingested into the journal (with _TRANSPORT=syslog).
4. Direct API input
Applications can also log directly to the journal by using the sd-journal API.
5. Container logs (when integrated)
With proper integration, container runtimes like Docker or Podman can forward their logs to journald.
This typically involves using the journald logging driver, which routes container stdout and stderr streams directly into the system journal—along with useful metadata like container ID, image name, or custom tags.
Basic log viewing and navigation
The simplest way to view your logs is to run journalctl without any arguments:
1journalctl
By default, this displays all accessible log entries inside an interactive pager (usually less).
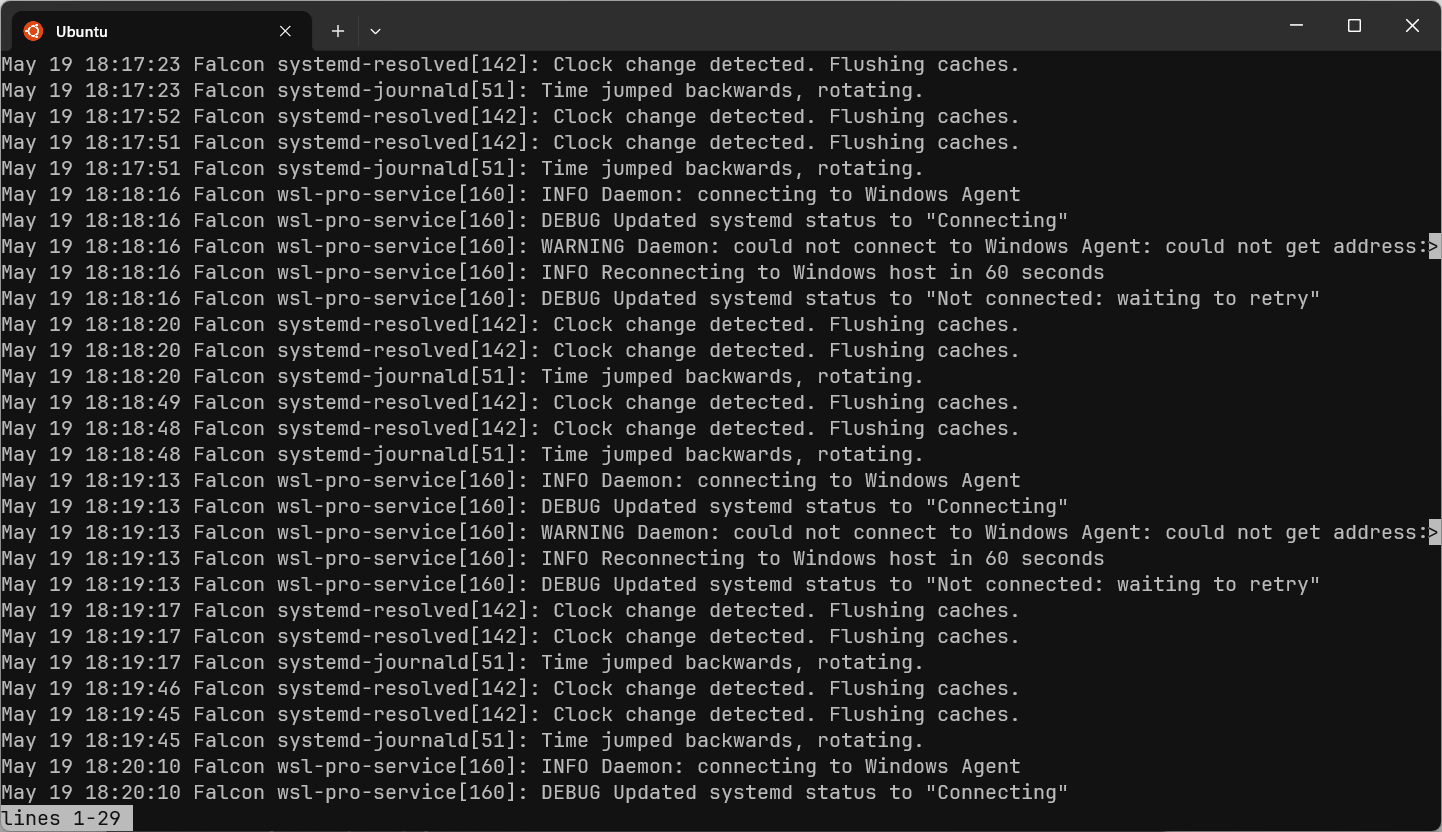
The logs are presented in chronological order, starting with the oldest entries first:
123456789-- Logs begin at Wed 2024-11-21 12:15:38 UTC, end at Thu 2025-05-29 12:17:18 UTC. --Nov 21 09:32:48 Ubuntu-24-04 sshd[515247]: Received disconnect from 212.192.42.211 port 53806:11: Bye Bye [preauth]Nov 21 09:32:48 Ubuntu-24-04 sshd[515247]: Disconnected from authenticating user root 212.192.42.211 port 53806 [preaut>Nov 21 09:32:51 Ubuntu-24-04 sshd[515249]: Connection closed by 176.122.18.85 port 41830 [preauth]Nov 21 09:32:57 Ubuntu-24-04 sshd[515251]: Invalid user test from 13.65.225.172 port 42932Nov 21 09:32:57 Ubuntu-24-04 sshd[515251]: Received disconnect from 13.65.225.172 port 42932:11: Bye Bye [preauth]Nov 21 09:32:57 Ubuntu-24-04 sshd[515251]: Disconnected from invalid user test 13.65.225.172 port 42932 [preauth]Nov 21 09:33:00 Ubuntu-24-04 sshd[515253]: Connection closed by 45.76.236.221 port 41878 [preauth][...]
Each entry starts with a timestamp, the hostname, the process name (sshd) and ID ([515251]), followed by the actual log message. Navigation within the pager is standard:
- Use the
UpandDownarrow keys to scroll line by line. - Use
Page UpandPage Downkeys (orSpacebar) to scroll screen by screen. - Press
/followed by a term andEnterto search forward for that term. - Press
?followed by a term andEnterto search backward. - After a search, press
nto jump to the next match orNto jump to the previous match. - Press
Hometo go to the beginning of the journal, orEndto go to the most recent entries. - Press
Qto quit the pager.
Long log lines that exceed the screen width are truncated by default but can be viewed by using the left and right arrow keys.
Viewing the newest logs first
While seeing logs from the beginning is useful, you often want to see the most recent activity first. Use the -r or --reverse flag to invert the output order:
1journalctl -r
You can also use the -e or --pager-end flag to jump to the end of the pager and see the newest logs without reversing the order:
1journalctl -e # start at the end of the pager
Disabling the pager for scripting
If you intend to process the output with other command-line tools like awk or sed, or if you want to redirect it to a file, you must disable the interactive pager using the --no-pager option:
1journalctl --no-pager
Note that using --no-pager without other filters on a system with a large journal can print a massive amount of data directly to your terminal.
While these commands are fundamental, viewing the entire journal is unnecessary and often impractical on a busy system.
The utility of journalctl is most apparent when you move beyond basic viewing and use its filtering features to precisely target the log entries you’re looking for.
Filtering journal logs by time (--since and --until)
In most cases, you’re usually only interested in logs that occurred within a specific timeframe.
journalctl provides the --since and --until flags to help you narrow down your search to a specific period in time. They accept various date and time formats in both absolute and relative formats.
For instance, to view logs from the last one hour, you can use a relative time like this:
1journalctl --since "1 hour ago"
This works with seconds, minutes, hours, days, weeks, months or even years. You can also use keywords like yesterday, today or now:
1journalctl --since "yesterday"
While --since specifies the minimum date, --until allows you to specify the maximum period:
1journalctl --since "today" --until "3 hours ago"
Instead of specifying relative times, you can also use an absolute time in this format (YYYY-MM-DD HH:MM:SS):
1journalctl --since "2025-05-29 12:00:00" --until "2025-05-29 13:00:00"
When filtering by time, you can provide just a time value. If the date is omitted, journalctl defaults to the current day.
For instance, the following command isolates logs from a specific one-hour window that occurred today:
1journalctl --since "12:00:00" --until "13:00:00" # Filters logs from 12:00 PM to 1:00 PM on the current day
Conversely, if you provide a date without a time, journalctl assumes midnight (00:00:00) as the start time.
Isolating the logs for a specific service
When troubleshooting a particular application or service managed by systemd, you’ll want to isolate its logs. The -u or --unit flag is used for this.
For example, to view logs specifically from the SSH daemon, you can type:
1journalctl -u ssh
You can also use the -t or --identifier flag to match logs based on the identifier field in syslog-style messages often set by the program itself.
1journalctl -t sshd
Filtering by executable path
A particularly useful feature is the ability to filter logs by the absolute path of the executable that generated them. This is a convenient way to check logs from specific applications that may not be running as a formal service.
For instance, if you wanted to see all logs generated by the Caddy web server, you could run:
1journalctl /usr/bin/caddy
Most likely, you’re only interested in the recent logs or those from a specific period so you can combine the service or executable with time filtering to narrow down the logs:
1journalctl --unit ssh --since "15 minutes ago"
You can also specify multiple units to see an interleaved view of their logs, which can be useful for understanding interactions between services:
1journalctl --unit nginx --unit php-fpm --since "30 minutes ago"
This command would show logs from both the nginx and php-fpm services from the last 30 minutes.
Filtering for kernel messages
For troubleshooting hardware, drivers, or low-level system issues (like filesystem errors or boot problems), you need to view messages generated by the Linux kernel. The -k or --dmesg flag filters the journal to show only these messages:
1journalctl -k

Journal filtering by log priority (severity)
Every log message in the journal is assigned a priority level indicating its severity. This allows you to quickly isolate important events from routine informational messages.
The standard syslog severity levels are used, ranging from 0 (most severe) to 7 (least severe):
emerg(0): System is unusable.alert(1): Action must be taken immediately.crit(2): Critical conditions.err(3): Error conditions.warning(4): Warning conditions.notice(5): Normal but significant condition.info(6): Informational messages.debug(7): Debug-level messages.
You can filter logs using the -p or --priority flag. This flag shows all messages at the specified priority level and any level that is more severe.
To view all error messages and more critical issues (err, crit, alert, and emerg), you can use either the priority name or its corresponding number:
123# These commands are equivalentjournalctl -p errjournalctl -p 3

Priority filtering becomes even more powerful when combined with other flags. For instance, you can find all warnings and errors for the nginx service that have occurred since yesterday with the command below:
1journalctl -p warning -u nginx --since "yesterday"
If you need to see messages of only one specific priority, you can specify it as a range. For example, to see only warning-level messages, use:
123# These commands are equivalentjournalctl -p warning..warningjournalctl -p 4..4
Tailing journal logs in real-time with --follow
One of the most common needs for a system administrator is to monitor logs live, especially during a software deployment or while troubleshooting an active issue.
journalctl provides this functionality, similar to the classic tail -f command, that allows you to see new log entries as they are written.
To start tailing the entire system journal, use the -f or --follow flag. This will first print the last 10 log entries and then wait, displaying new entries on your screen as they are recorded.
1journalctl -f
To stop tailing and return to the command prompt, press Ctrl+C.
Getting context before tailing
Simply seeing new logs as they arrive isn't always enough. You often need to see the recent log history for added context. Use the -n or --lines option to specify how many previous lines you want to see before the live feed begins.
Here’s an example that displays the last 100 lines before displaying new entries:
1journalctl -n 100 -f
Another useful option is --no-tail. When combined with -f, it shows all output lines before starting to follow new entries:
1journalctl --no-tail -f
Combining -f with unit, priority, or other filters allows you to watch for specific events without being overwhelmed by noise from the rest of the system:
1journalctl -u nginx -f # Watch the live output of a single service
1journalctl -p err -f # Tail the journal, but only show messages with a priority of 'err' or higher
Investigating issues across reboots
Troubleshooting problems that occur during startup or lead to a system crash may require isolating logs from a specific boot session. journalctl makes this process straightforward.
Listing available boots
First, list all recorded boot sessions to identify the one you want to inspect:
1journalctl --list-boots
This command displays each boot with a relative index (IDX), a unique BOOT ID, and the time window it covers:
output1234IDX BOOT ID FIRST ENTRY LAST ENTRY-2 c67c45fae9e44019a44e45e97aef8ada Sun 2025-06-08 17:38:22 WAT Tue 2025-06-10 08:43:47 WAT-1 69b5020b011e4daf9af15476c874b995 Tue 2025-06-10 08:44:05 WAT Wed 2025-06-11 19:16:21 WAT0 5b535549f27b4ba8b9c65b44e6b5c947 Wed 2025-06-11 19:22:28 WAT Thu 2025-06-12 12:12:32 WAT
Here:
0: represents the current boot session.-1: the immediately preceding boot-2: the boot before the previous one, and so on.
Viewing logs from a specific boot
You can then use the -b or --boot flag to filter the logs. You can refer to the boot by its relative index:
123# View logs from the current boot (these are equivalent)journalctl -bjournalctl -b 0
Or you can use the full BOOT ID:
1journalctl -b 69b5020b011e4daf9af15476c874b995
If you provide a nonexistent index or ID, you’ll get an error:
1Data from the specified boot (-3) is not available: No such boot ID in journal
Troubleshooting scenario
If a service fails to start properly after the last system reboot, you can pinpoint the cause by examining the service logs from the current boot:
1journalctl --boot --priority err --unit httpd
This command precisely isolates the critical errors for the target service within the exact time frame of the failure to ease your diagnostics efforts.
Without boot filtering, you might see the following line in the journalctl output showing when the system was rebooted:
12345[...]-- Boot <boot id> --[...]

Advanced filtering with metadata fields
Each log entry in the systemd journal is not just a line of text but a collection of key-value pairs called fields. Filtering by these fields allows for incredibly precise queries.
Before you can filter, you need to know what fields are available. The -N or --fields flag shows every field name currently in use in the entire journal:
1journalctl -N
This outputs:
123456789101112CODE_FUNC_KERNEL_DEVICEDISK_AVAILABLETIDDISK_KEEP_FREE_PRETTY_SYSTEMD_USER_UNITSYSLOG_TIMESTAMP_CAP_EFFECTIVE_CMDLINE_UDEV_DEVNODE_SYSTEMD_SLICE[...]
- Fields prefixed with a single underscore (_) are trusted metadata added by the journald system itself. They reliably describe the log’s context, such as
_PID(process ID) or_SYSTEMD_UNIT(the service it came from) and cannot be altered by an application. - Fields with a double underscore prefix
(__CURSOR) are for internal use by the journal system. - Fields without a prefix are provided directly by the application. The most common is
MESSAGE, which contains the actual text of the log entry.
Once you know the field you’re interested in, you can use the -F or --field flag to show all the unique values that exist for it. For instance, you can view all the services that have produced logs with:
1journalctl -F _SYSTEMD_UNIT
This outputs:
12345678vector.servicemotd-news.serviceinit.scopecron.servicecaddy.servicedocker.servicessh.service[...]
You can then construct queries to filter logs using the FIELD=VALUE syntax like this:
1journalctl _SYSTEMD_UNIT=docker.service # the fully qualified unit name must be used
For commonly used trusted fields, journalctl provides convenient shortcuts, such as:
-ufor filtering by_SYSTEMD_UNIT(you don’t need to specify the .service suffix).-tfor filtering bySYSLOG_IDENTIFIER.-kfor filtering_TRANSPORT=kernel(kernel messages).- Providing an executable path directly (such as
journalctl /usr/bin/sshd) instead of specifying_EXE=<path>.
Logic for combining filters
You can combine multiple field matches in a single query to drastically narrow your search on a busy production system. To do this effectively, it’s essential to understand how journalctl treats these combinations.
AND logic: matching across different fields
When you provide filters for different fields, journalctl connects them with an implicit AND. This means a log entry must match all of the specified conditions to be shown.
12# Shows log from the nginx service unit AND from process ID 5678.journalctl -u nginx _PID=5678
OR logic: matching on the same field
When providing multiple filters for the same field, journalctl connects them with an implicit OR so that a log entry only needs to match at least one of these conditions.
12# match nginx or php-fpmjournalctl _SYSTEMD_UNIT=nginx.service _SYSTEMD_UNIT=php-fpm.service
Explicit OR using the + separator
If you need to find logs that match one condition OR a completely different condition across different fields, you must explicitly separate them with a + sign:
1journalctl _SYSTEMD_UNIT=nginx.service + _PID=1234
Searching journal logs with grep
When you need to find specific, unstructured text within log messages, journalctl offers a powerful search feature using the -g or --grep flag.
If the pattern is all lowercase, matching is case insensitive:
1journalctl -g "error"

Otherwise, when at least one uppercase character is detected, matching will be case sensitive:
1journalctl -g "ERROR"

To override this behavior, you can use the --case-sensitive[=BOOLEAN] flag:
1journalctl -g "Error" --case-sensitive=false
For the best performance, it’s crucial to understand how journalctl applies filters. It first processes indexed fields like the unit (-u) or time (--since), and only then does it apply the --grep filter to those results.
Therefore, you should always narrow down the logs as much as possible with other options before adding your --grep search.
Customizing log output format
While the default journalctl output is easy to read, it’s not always suitable for scripts or detailed analysis. You can control the output format using the -o or --output option to better suit your needs.
Here are some of the most common formats:
short: The classic and default syslog-style format.verbose: Shows every field stored in the journal for an entry.json: Formats each entry as a compact, single-line JSON objectjson-pretty: Outputs entries in a multi-line, human-readable JSON format.cat: Displays only the raw message field.
For automated parsing and integration with log management tools, the json formats are the most robust choice:
1journalctl -u cron --since "10 minutes ago" -o json
output1{"SYSLOG_PID":"3924616","SYSLOG_TIMESTAMP":"Jun 12 14:55:58 ","_UID":"0","SYSLOG_IDENTIFIER":"sshd","_SYSTEMD_SLICE":"system.slice","_SELINUX_CONTEXT":"unconfined\n","_BOOT_ID":"c6245404db0649268207ab513d212a3a","_TRANSPORT":"syslog","SYSLOG_FACILITY":"4","_MACHINE_ID":"44e55057513143f2a3ad5a4f6efad5e0","_HOSTNAME":"Ubuntu-24-04","__REALTIME_TIMESTAMP":"1749740158927434","_SYSTEMD_INVOCATION_ID":"20dc6fcd154943c286dc7644334f00bd","__CURSOR":"s=432529681f1445bfbd607fe5a9f0616d;i=410c997;b=c6245404db0649268207ab513d212a3a;m=56071f5ccb1d;t=63761209f424a;x=2937815aa1049de8","_CMDLINE":"sshd: root [priv]","_SOURCE_REALTIME_TIMESTAMP":"1749740158927383","__MONOTONIC_TIMESTAMP":"94588590934813","_SYSTEMD_UNIT":"ssh.service","_CAP_EFFECTIVE":"3fffffffff","_GID":"0","_SYSTEMD_CGROUP":"/system.slice/ssh.service","PRIORITY":"6","_COMM":"sshd","MESSAGE":"Connection closed by authenticating user root 45.88.8.176 port 40604 [preauth]","_PID":"3924616","_EXE":"/usr/sbin/sshd"}
To get a better handle on the structure, you can use the json-pretty format. This produces an output that is easier to inspect:
12345678910111213141516171819202122232425262728{"_MACHINE_ID": "44e55057513143f2a3ad5a4f6efad5e0","_SYSTEMD_UNIT": "ssh.service","_CAP_EFFECTIVE": "3fffffffff","_SYSTEMD_INVOCATION_ID": "20dc6fcd154943c286dc7644334f00bd","_BOOT_ID": "c6245404db0649268207ab513d212a3a","_TRANSPORT": "syslog","_CMDLINE": "sshd: ayo [priv]","_SELINUX_CONTEXT": "unconfined\n","_UID": "0","MESSAGE": "pam_unix(sshd:session): session opened for user ayo by (uid=0)","SYSLOG_FACILITY": "10","_SOURCE_REALTIME_TIMESTAMP": "1749782478996172","SYSLOG_PID": "3927576","__CURSOR": "s=432529681f1445bfbd607fe5a9f0616d;i=410d87e;b=c6245404db0649268207ab513d212a3a;m=5610f9d5cbb6;t=6376afb1842e3;x=4bfee16220183df7","_GID": "0","PRIORITY": "6","_PID": "3927576","_HOSTNAME": "Ubuntu-24-04","SYSLOG_TIMESTAMP": "Jun 13 02:41:18 ","_EXE": "/usr/sbin/sshd","SYSLOG_IDENTIFIER": "sshd","__REALTIME_TIMESTAMP": "1749782478996195","_SYSTEMD_CGROUP": "/system.slice/ssh.service","_SYSTEMD_SLICE": "system.slice","__MONOTONIC_TIMESTAMP": "94630911003574","_COMM": "sshd"}
Displaying specific fields
You can further refine your output by displaying only specific fields with the --output-fields option. This must be used with a format that supports it, like json or verbose.
For instance, to see only the message, process ID, and priority for recent SSH logs, type:
1journalctl -u sshd -o json-pretty --output-fields=MESSAGE,_PID,PRIORITY --since "5 minutes ago"
Note that journalctl may still include essential identifying fields in the output even if they are not explicitly requested:
123456789{"__MONOTONIC_TIMESTAMP": "94631195634941","MESSAGE": "Disconnected from invalid user vpn 186.226.113.120 port 45490 [preauth]","_BOOT_ID": "c6245404db0649268207ab513d212a3a","_PID": "3927878","__CURSOR": "s=432529681f1445bfbd607fe5a9f0616d;i=410d890;b=c6245404db0649268207ab513d212a3a;m=56110accecfd;t=6376b0c0f642a;x=6b2f627e04e080e4","__REALTIME_TIMESTAMP": "1749782763627562","PRIORITY": "6"}
Managing journald storage and disk space
The systemd journal can grow significantly over time, consuming valuable disk space. journalctl and journald provide some tools for both immediate cleanup and long-term, automated management.
Before making any changes, you can check how much disk space the journal is currently using:
1journalctl --disk-usage
output1Archived and active journals take up 3.9G in the file system.
Manual cleanup with vacuum
For immediate results, you can manually “vacuum” old logs. These operations require root privileges (you’ll get a permission error without it):
--vacuum-size=<bytes>: Shrinks the journal to a desired total size by removing the oldest archived journal files. Suffixes likeM(megabytes) orG(gigabytes) can be used.--vacuum-time=<time>: Removes archived journal files older than the specified relative time (e.g.,2days,1year,6weeks).--vacuum-files=<int>: Reduces the number of archived journal files to the specified integer.
Note: Vacuum settings apply only to archived journal files, not the one currently being written.
For example, to reduce the journal size to 1GB, use
1sudo journalctl --vacuum-size=1G
output12345678Vacuuming done, freed 0B of archived journals from /var/log/journal.Deleted archived journal /var/log/journal/44e55057513143f2a3ad5a4f6efad5e0/user-1000@b71bc3498110456da9ba16b96dd3b3d0-0000000003e1b762-0006277a5d3545de.journal (8.0M).Deleted archived journal /var/log/journal/44e55057513143f2a3ad5a4f6efad5e0/system@432529681f1445bfbd607fe5a9f0616d-0000000003e3011b-0006278bb8204784.journal (80.0M).Deleted archived journal /var/log/journal/44e55057513143f2a3ad5a4f6efad5e0/user-1000@b71bc3498110456da9ba16b96dd3b3d0-0000000003e30139-0006278bb823137e.journal (8.0M).Deleted archived journal /var/log/journal/44e55057513143f2a3ad5a4f6efad5e0/system@432529681f1445bfbd607fe5a9f0616d-0000000003e45287-0006279e0731437b.journal (72.0M).[...]Vacuuming done, freed 496.0M of archived journals from /var/log/journal/44e55057513143f2a3ad5a4f6efad5e0.Vacuuming done, freed 0B of archived journals from /run/log/journal
Configuring automatic and persistent management
While manual vacuuming is useful, the best practice is to configure journald to manage its own size and ensure logs are stored persistently. This is all handled in /etc/systemd/journald.conf.
1. Ensuring persistent storage
For production systems, it is critical that logs survive a reboot. The Storage= option controls this behavior.
Storage=volatile: Stores logs in RAM (/run/log/journal). Logs are lost on reboot.Storage=persistent: Stores logs on disk (/var/log/journal). This is the recommended setting for servers.Storage=auto(Default): Uses persistent if/var/log/journalexists, otherwise falls back to volatile.
To guarantee persistence, explicitly set Storage=persistent in the configuration file and ensure the /var/log/journal directory exists.
/etc/systemd/journald.conf12[Journal]Storage=persistent
2. Set automatic size and rotation limits
After ensuring persistence, you can define rules for how large the journal is allowed to grow.
Here are some key directives you can set under the [Journal] section:
/etc/systemd/journald.conf12345[Journal]SystemMaxUse=4GSystemKeepFree=1GSystemMaxFileSize=200MCompress=yes
SystemMaxUse: The absolute maximum disk space the journal can use.SystemKeepFree: The amount of disk spacejournaldwill attempt to leave free.SystemMaxFileSize: The size limit for individual journal files before they are rotated.Compress: Set toyes(the default) to compress older journal files (at the cost of a slight CPU overhead).
After modifying /etc/systemd/journald.conf, you must restart the service for the new settings to take effect:
1sudo systemctl restart systemd-journald
Centralizing journald logs with OpenTelemetry
While journalctl is excellent for local log inspection, modern observability strategies rely on centralizing telemetry data so that you can correlate system behavior across services, containers, and infrastructure in one place.
In the OpenTelemetry ecosystem, the standard method for this integration is the OpenTelemetry Collector. It is a flexible agent you can run on your servers to receive, process, and forward telemetry data to an observability platform.
Its pipeline-based architecture uses three key components:
- Receivers: Ingest data from various sources.
- Processors: Transform and enrich the data.
- Exporters: Send the data to one or more observability backends.
To collect journald logs, you can use the Collector’s journald receiver which is available in the Contrib and Kubernetes distributions, as well as custom builds that include the receiver.
Here’s a basic configuration collects all logs from the journal, batches them for efficiency, enriches them with host metadata, and forwards them to Dash0:
otelcol.yaml123456789101112131415161718192021222324receivers:journald:directory: /var/log/journalprocessors:batch:resourcedetection/system:detectors: [system]system:hostname_sources: [os]exporters:otlphttp/dash0:endpoint: <your_dash0_endpoint>headers:Authorization: Bearer <your_dash0_token>Dash0-Dataset: <your_dash0_dataset>service:pipelines:logs:receivers: [journald]processors: [batch, resourcedetection/system]exporters: [otlphttp/dash0]

In this configuration:
- The
journaldreceiver is defined to collect logs from the/var/log/journaldirectory. - The
batchprocessor helps in batching logs before sending to improve network efficiency. - The resourcedetection processor helps you automatically populate resource attributes for the host system.
- The
otlphttpexporter sends the logs to Dash0 using the OTLP protocol over HTTP. Ensure to replace the placeholders with your actual account values.
To reduce cost and noise, you can configure the receiver to pull only specific logs from the journal. This is more efficient (and cheaper) than sending everything and filtering it later.
otelcol.yaml1234567891011receivers:journald:directory: /var/log/journalunits:- ssh- kubelet- docker- containerdmatches:- _UID: "1000"priority: info
You might need to use other processors (like transform or attributes) to further refine field mappings, add custom attributes, or ensure compliance with OpenTelemetry Semantic Conventions.
Dash0 already offers enhanced support for journald logs, including:
- Automatic mapping of journal fields to semantic conventions.
- Consistent severity levels.
- Support for service and infrastructure attributes.

By making journald logs a first-class citizen in your observability strategy, you’ll enhance your ability to detect, diagnose, and resolve production issues more effectively.
Final thoughts
For any administrator or developer working with modern Linux systems, mastering journalctl is a fundamental skill. It transforms log analysis from the cumbersome task of grepping through plain-text files into a precise and efficient process of querying structured data directly on a host.
This capability is powered by systemd-journald, which, when properly configured, ensures persistent log storage, automatic disk space management, and rich metadata tagging out of the box.
While the system journal is great for local troubleshooting, its value grows significantly when integrated into an OpenTelemetry pipeline. This elevates its contents from isolated messages into fully correlated observability signals.
To dive deeper into journalctl, explore the official documentation or run man journalctl in your terminal.
Thanks for reading, and if you’re ready to maximize the value of your system logs, consider sending them to Dash0 for full observability integration.
