Last updated: July 13, 2026
What Makes a Good OpenTelemetry Backend?
OpenTelemetry standardizes how you generate, structure, and transport telemetry. The backend determines what happens next, including how easily you can explore that data, correlate it across signals, and use it to resolve incidents.
Almost every serious observability vendor now claims to support OpenTelemetry. In many cases, that claim only means the platform can receive data through the OpenTelemetry Protocol (OTLP).
OTLP ingestion is important, but it's only the starting point for OpenTelemetry support. It tells you little about whether the backend preserves OTLP data faithfully, connects logs, metrics, and traces, supports effective debugging workflows, or remains economical as telemetry volumes grow.
This article explains how to distinguish backends that are genuinely designed for OpenTelemetry from those that merely accept its data. You'll learn what to inspect, test, and calculate before choosing a platform, with a focus on what happens after ingestion.
What OpenTelemetry standardizes and what it doesn't
You probably don't need another 500-word introduction to OpenTelemetry. However, it's worth defining where its scope ends and the backend's begins, because that boundary is why your choice of backend still matters.
OpenTelemetry defines APIs, SDK behavior, telemetry data models, semantic conventions, and protocols such as OTLP. It also provides the OpenTelemetry Collector as a vendor-neutral implementation for receiving, processing, and exporting telemetry.
If you instrument your application with OTel SDKs and route data through a Collector, you've standardized how telemetry is generated, represented, processed, and transported. That part is genuinely vendor-neutral.
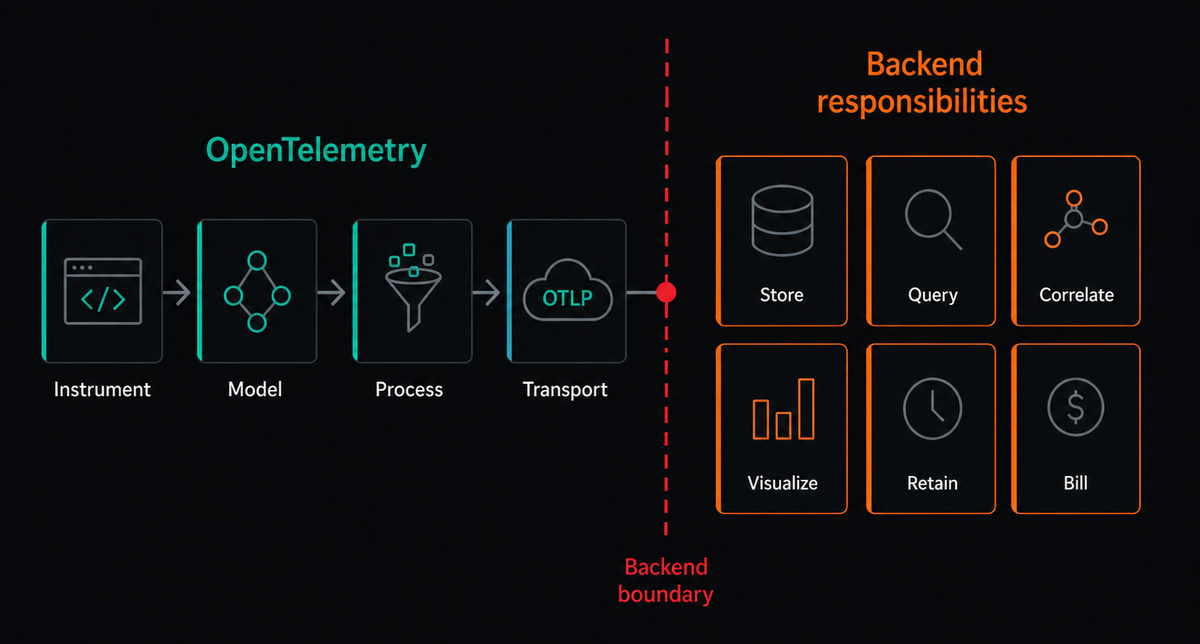
What OTel deliberately does not standardize is everything that happens next: storage, query languages, visualization, cross-signal correlation, alerting, access controls, retention policies, and billing models. The Collector can fan out telemetry to multiple destinations, but it doesn't replace a backend.
If you think OTel makes backends interchangeable, you're only half right. It makes ingestion interchangeable, but everything after ingestion is where backends diverge, and that gap is what the rest of this article focuses on.
Supporting OTLP is not a meaningful differentiator
This is one of the most important distinctions in your evaluation, because nearly every other criterion depends on what happens after the backend receives your data.
All backends transform telemetry to some extent. They may encode fields for columnar storage, create indexes, generate derived attributes, aggregate metrics, compact older data, or store different signals in separate systems.
The useful distinction is how closely the backend's storage, query model, and investigation workflows remain aligned with OpenTelemetry after those transformations.
Backends whose internal data and query models closely follow OpenTelemetry tend to preserve concepts such as resource attributes, span attributes, trace context, metric metadata, and signal relationships from ingestion through querying.
For example, if you send a span with 50 custom attributes, those attributes should remain available with their names, types, and values intact and be usable in queries. If a log contains a trace ID and span ID, the backend should retain that context and use it to connect the log to the corresponding trace.
Other backends accept OTLP at the ingestion boundary but translate the data into an existing internal model before storing it. That translation does not automatically make the backend unsuitable, but it creates more opportunities for OpenTelemetry semantics to be changed, obscured, or lost.
Depending on the implementation, a conversion layer might drop attributes, alter metric temporality, reduce histogram detail, rename fields, or fail to preserve cross-signal correlation context.
Because these transformations often occur during ingestion, you may not discover their effects until you try to query the original fields or follow a relationship across signals.
You should therefore treat OTLP support as an entry requirement, not a deciding factor. The meaningful question is whether the backend preserves the data and relationships that OpenTelemetry produced.
Fortunately, that is something you can test using the criterion discussed below.
Support for the complete OpenTelemetry signal set
Before evaluating data fidelity, establish whether the backend supports traces, metrics, and logs as part of one coherent investigation workflow.
A single-signal store is not an observability backend on its own. Prometheus may be excellent for time-series analysis, and Jaeger may be excellent for distributed tracing, but neither can explain system behavior across all the signals an incident produces.
Single-signal tools can still be combined into an observability stack. The trade- off is that each component usually has its own data model, query language, retention policy, access controls, and operational assumptions. You must then preserve context across those boundaries and build the navigation that a unified platform provides natively.
Incidents rarely stay within a single signal. A metric exposes the symptom, a trace narrows it to the failing request path, and a log often reveals the cause. When those signals live in separate products, engineers must reconstruct the same investigation across different query languages, time ranges, access controls, retention policies, and billing models.
Confirm that traces, metrics, and logs can all be ingested over OTLP/HTTP and OTLP/gRPC, then stored, queried, visualized, alerted on, and correlated. Each signal should receive first-class product support rather than appearing as a limited integration or secondary workflow.
OpenTelemetry profiles entered public alpha in 2026, so profiles support is also worth evaluating if continuous profiling is part of your roadmap.
Only backends or stacks that meet this hard requirement should proceed to the next stage of the evaluation: whether they preserve and use the OpenTelemetry data faithfully.
Data fidelity after ingestion
Data fidelity does not require a backend to retain the original OTLP wire payload or store telemetry without transformation. It requires the backend to preserve the fields, types, relationships, and statistical meaning that your workflows depend on.
Prometheus is a useful example. It can receive metrics directly over OTLP, but it converts each OpenTelemetry metric into a Prometheus time series before storing it in its time-series database.
That conversion requires several mapping decisions. OpenTelemetry resource
attributes may be promoted to labels on every series or stored as labels on a
separate target_info metric. Identifying attributes such as service.name,
service.namespace, and service.instance.id are mapped to Prometheus job
and instance labels.
Metric and attribute names may also be normalized to match Prometheus naming rules. Depending on the configured translation strategy, dots can become underscores, while type and unit suffixes can be appended to metric names.
Temporality requires another conversion. OpenTelemetry supports delta and cumulative metrics, while Prometheus stores cumulative values. Prometheus can convert delta metrics before storage, although its documentation currently describes that path as experimental. Without that feature enabled, you'll see errors like this if you send delta OTLP metrics:
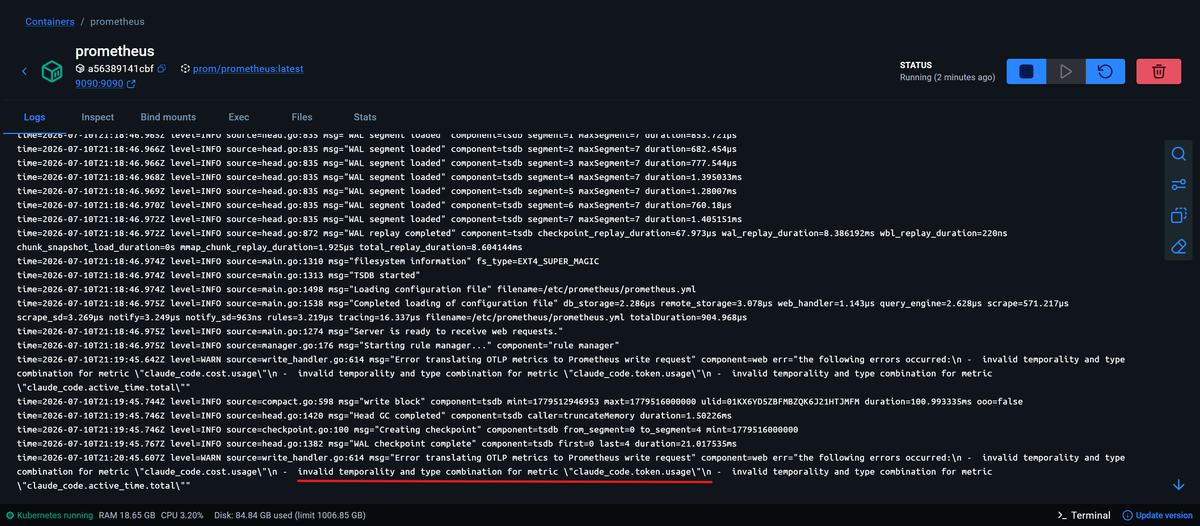
These transformations show why OTLP ingestion alone tells you little about the representation available at query time.
Conversion may also change the vocabulary exposed in the interface. Attributes become "tags" or "labels", and other OpenTelemetry concepts acquire product-specific names.
These differences do not necessarily affect fidelity, but unclear mappings add friction when engineers move between instrumentation, documentation, and investigation.
During evaluation, identify every transformation that affects the telemetry you use. Check whether it is documented, semantically correct, visible during troubleshooting, and compatible with your dashboards, alerts, and investigation workflows.
Also, check maximum attribute counts, attribute value lengths, payload and record sizes, supported OTLP features, and throttling behavior. When a limit is exceeded, the backend should make it clear whether telemetry is rejected, truncated, sampled, delayed, or otherwise modified.
When things look wrong, can you see the raw data?
A useful signal of OpenTelemetry alignment is whether the backend exposes a source-oriented representation of the telemetry it received.
An OpenTelemetry-native backend preserves the OTLP data model, so that when something looks wrong in the UI, you can distinguish problems in the incoming telemetry from transformations introduced by the backend.
Backends that expose only their normalized internal document give you less visibility into that boundary. They may preserve all the information you need, but you must take their mapping on trust unless the original fields and subsequent transformations are visible.
Source representation is therefore a meaningful evaluation signal that shows how easy the platform makes it to audit what arrived and understand what changed afterward.
During a proof of concept, send a deliberately recognizable record and check whether you can:
- Inspect the submitted OpenTelemetry fields and their types.
- Distinguish source fields from derived or renamed fields.
- Identify anything that was dropped, flattened, or aggregated.
- Export the source-oriented representation programmatically.
Semantic conventions are only useful if the backend understands them
Preserving OpenTelemetry data fidelity is necessary, but it's not enough. The backend also needs to understand the semantic conventions attached to that data and use them to make investigations faster.
Semantic conventions assign consistent names, types, and meanings to common
telemetry fields. For example, http.response.status_code represents a numeric
HTTP response status, while k8s.namespace.name identifies a Kubernetes
namespace. OpenTelemetry defines these conventions so the same concepts can be
recognized consistently across codebases, libraries, and platforms.
A backend that understands those conventions can build context-aware workflows around them. It can offer numeric operators for HTTP status codes, group telemetry by Kubernetes workload, or let you scope an investigation to a namespace or deployment without first looking up the exact attribute names.
You may still be able to query the same data in a backend that treats every attribute as a generic field, but more of the work falls on you. You need to know which key to use, how its value is represented, and which query syntax applies before you can narrow the result set.
The difficult part is that semantic conventions are not static. Different convention groups have different stability levels, and the same environment may contain old and new attribute names at the same time. For example, a JavaScript service using an older SDK may emit legacy HTTP conventions while a Go service using newer instrumentation emits their stable replacements.
A backend therefore needs more than a hard-coded list of familiar attributes. It should preserve unknown fields and respect the types carried in OTLP. It should also recognize deprecated and renamed conventions, make their relationship visible, and avoid unnecessarily fragmenting equivalent concepts across unrelated filters or dashboards.
During a proof of concept, inspect how the backend handles common semantic conventions rather than checking only whether the attributes are queryable. Send old and new convention names together, include an unknown custom attribute, and verify that the interface preserves their types, applies the right operators, and presents related fields as part of the same investigation workflow.
Resource-centric navigation
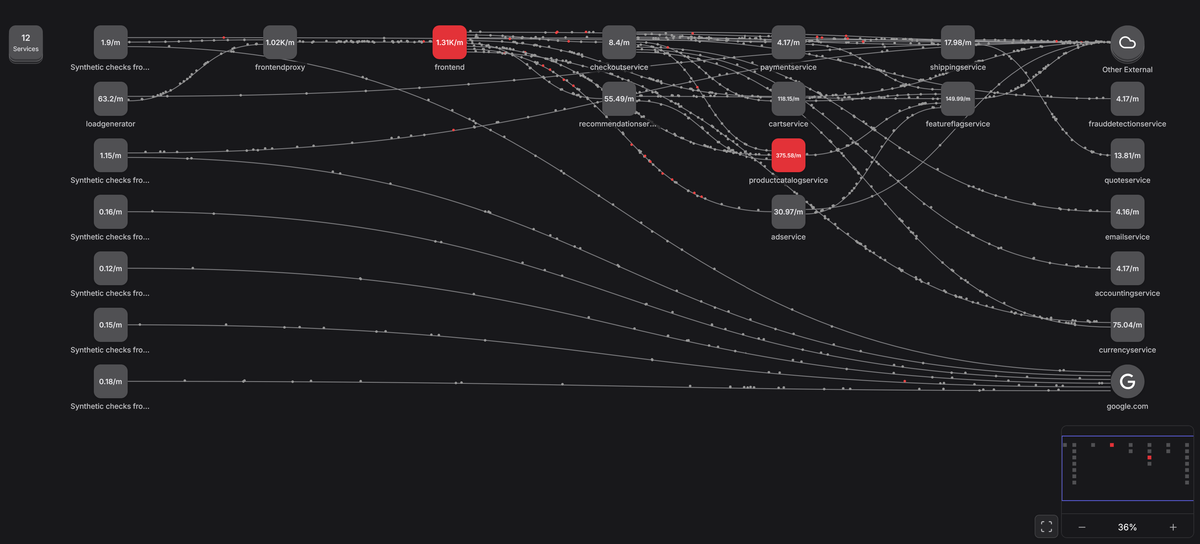
OpenTelemetry's resource model describes where telemetry was produced, including the service, pod, namespace, node, cluster, and availability zone.
When you follow resource attribute best practices, that context becomes part of every relevant span, metric, and log record. You have already embedded a useful description of your system topology into the telemetry.
A backend that treats resources as a first-class concept can turn those attributes into navigation. You can select a service and immediately see its traces, logs, metrics, and Kubernetes workloads. Select a namespace, cluster, or deployment, and the investigation automatically re-scopes to that resource.
This is more useful than treating resource attributes as another set of filters. The backend understands that a service runs in particular pods, that those pods belong to a namespace, and that telemetry from those resources should be investigated together.
Backends that do not use the resource model this way often force you to rebuild that context manually. You may open a service, then switch to a separate infrastructure view and search for its pods by name. A host view may offer metrics that have no relationship to the selected host because the interface does not use resource attributes to determine what is relevant.
The necessary context is already present in the telemetry, but the backend does not apply it consistently. Every additional service, namespace, cluster, and signal increases the number of irrelevant results, filters, and navigation paths an engineer must sort through during an investigation.
Resource-centric navigation is therefore a useful test of whether a backend understands OpenTelemetry's data model beyond ingestion. Preserving resource attributes is only the minimum requirement. The stronger platforms use those attributes to connect signals, model topology, and keep each investigation scoped to the part of the system you are actually examining.
Cross-signal correlation under real conditions
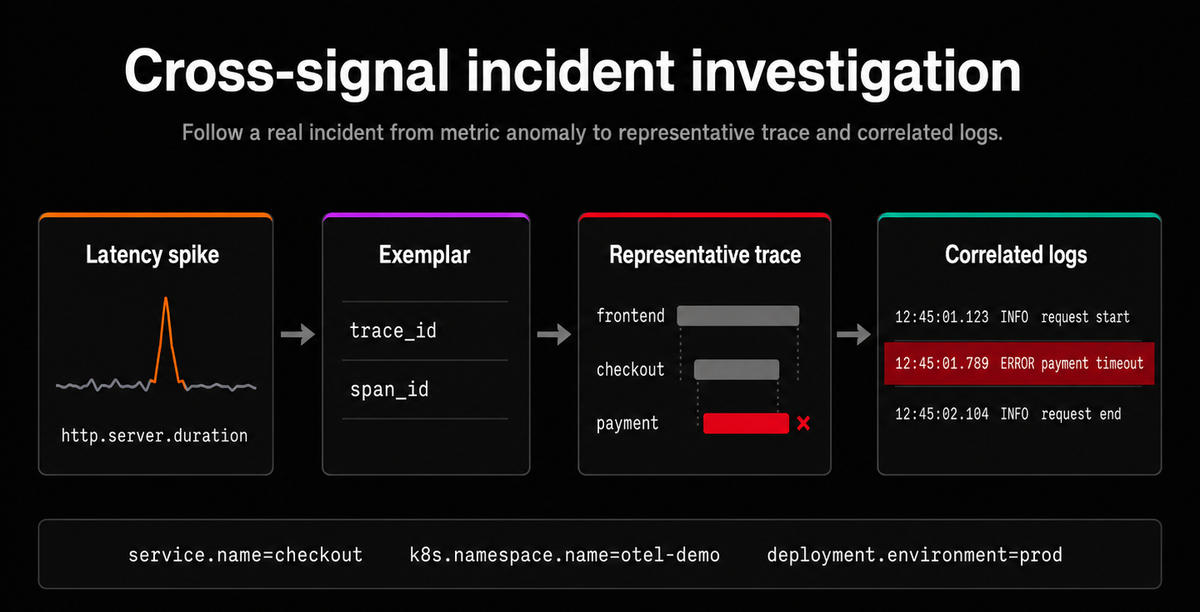
OpenTelemetry connects signals through shared resource attributes, trace context on logs, and exemplars that associate metric measurements with representative traces.
When a backend preserves and uses those relationships, you can move from a metric anomaly to a relevant trace and then to the logs produced during that request without rebuilding the investigation manually.
For example, a log record with a trace ID and span ID should link directly to
the corresponding span and the resource that produced it. You should be able to
see that a warning came from the AdService, running in the otel-demo
Kubernetes namespace, during a particular HTTP request, then navigate to any of
those layers for more detail.
Exemplars provide a similar path from metrics to traces. A latency spike can include a reference to a representative trace, which you can open before following its spans to the related logs.
This workflow depends on the backend preserving trace context and exemplar references, indexing them consistently, and exposing them in the interface. Simply storing logs, metrics, and traces in one product does not guarantee useful correlation.
When exact links aren't available, the backend should support contextual correlation. You should be able to narrow telemetry using shared resource attributes, service and deployment identity, time ranges, attribute values, and statistical changes, then move between related logs, metrics, and traces without restarting the investigation.
Test this during your proof of concept. Generate a known latency spike, start from the metric or alert, and follow the path to a representative trace and its logs. Record whether you need to copy identifiers, adjust time ranges, or rewrite queries, then repeat the test with enough concurrent traffic to introduce noise.
The strongest backends preserve exact OpenTelemetry relationships when they exist and provide effective contextual workflows when they do not.
Query languages and the lock-in nobody talks about
OpenTelemetry eliminated instrumentation and data model lock-in, but it does not standardize how you query telemetry after ingestion.
This matters because your investment in a backend extends far beyond the data stored there. Dashboards, alert rules, saved queries, and runbooks gradually accumulate assumptions about the platform's query syntax and data model.
Repointing an OpenTelemetry Collector to a new destination is relatively straightforward, but recreating years of operational knowledge is not. A migration may require you to rewrite dashboard queries, reproduce alert behavior, update runbooks, and retrain engineers on a different investigation workflow.
The query language influences how much of that work survives. Widely supported languages such as PromQL and SQL give engineers transferable skills and may make some queries easier to move between platforms.
Portability is still partial because backends can support different functions, schemas, labels, and extensions, but you're not starting from an entirely proprietary language.
A vendor-specific query language creates a narrower investment. Every useful query your team writes becomes knowledge that may need to be translated during a migration. Over several years, that investment spreads into service dashboards, alert rules, incident playbooks, and internal documentation.
Dashboard and alert formats create another layer of dependency. Definitions stored as code in open or documented formats are easier to inspect, version, test, and migrate than objects that exist only inside a vendor's interface.
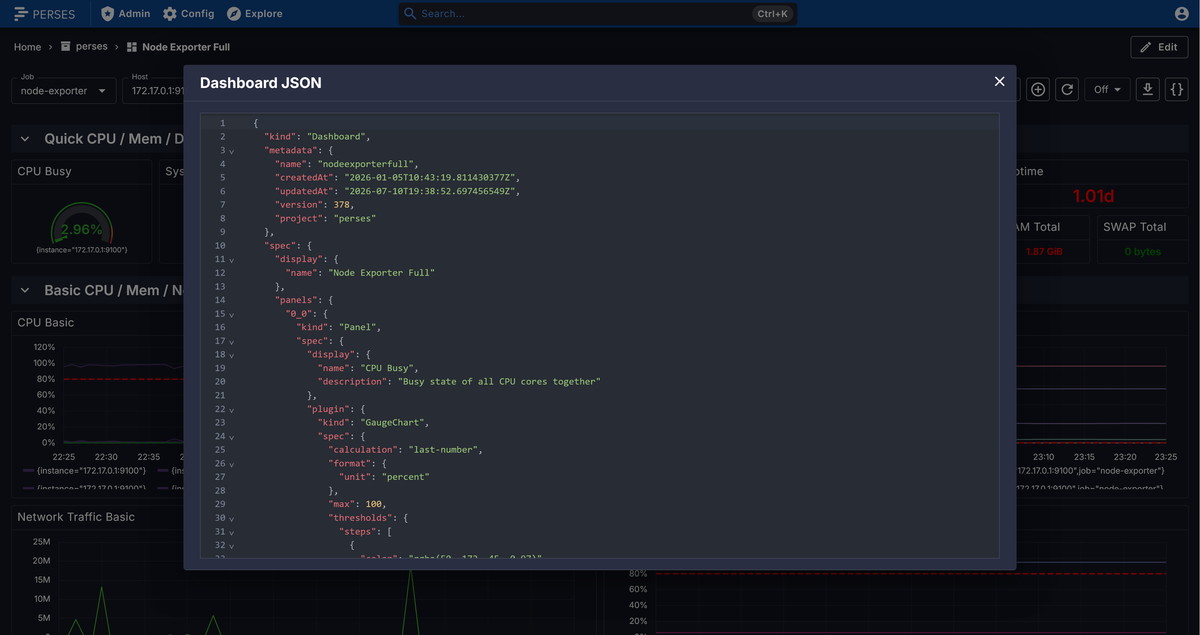
Projects such as Perses provide an open dashboard specification and dashboards-as-code workflow. That does not make every dashboard universally portable, since panels still depend on supported data sources, queries, and plugins. It does give you a clearer migration path than an undocumented proprietary representation.
Include this layer in your evaluation. Inventory your dashboards, alerts, saved queries, and runbook examples, then test how easily a representative sample can be exported and recreated elsewhere.
Cost modeling that reflects how pricing shapes behavior
Pricing is one of the most common sources of regret in backend selection. The problem is often not the headline price, but how many billing dimensions move at the same time as your environment grows.
A platform may charge for some combination of hosts, ingest volume, indexed bytes, spans, log records, metric data points, active series, users, retention, queries, archive retrieval, profiling data, or synthetic checks. Any model can become difficult to predict when several of those meters interact.
The pricing model also shapes how your teams instrument their systems. Per-gigabyte and cardinality-based pricing make every additional span, attribute, metric series, and structured log field more expensive. Engineers then start removing useful context, sampling more aggressively, or avoiding new telemetry to control costs.
That is especially problematic for OpenTelemetry, where high-cardinality attributes are required to provide the context needed to isolate failures. Service names, deployment versions, Kubernetes resources, customer tiers, and request metadata all make investigations faster, but they can also increase event size, cardinality, indexing, and storage.
Per-signal pricing can be easier to reason about because logs, metrics, and traces are charged according to their own usage patterns instead of being collapsed into one byte-based meter. It also makes the effect of changes such as higher trace sampling or more log events easier to predict.
Do not assume all OpenTelemetry data follows the vendor's standard pricing path. A backend built around proprietary agents may classify OTLP metrics as custom metrics, which can make an OpenTelemetry migration more expensive even when the amount of telemetry remains similar.
Ask exactly what the vendor counts: bytes received, bytes indexed, active series, spans, events, attribute cardinality, or some combination of them. Also check whether the quoted price includes storage, querying, retention, archive retrieval, and rehydration.
Model the cost with realistic telemetry and include your expected attribute count, metric cardinality, trace sampling, log volume, and retention needs, then project them at 2x, 5x, and 10x growth. A good pricing model should remain understandable as instrumentation becomes richer, without forcing engineers to trade useful context for cost control.
Running a proof of concept that proves something
The Collector's fan-out capability makes side-by-side evaluation of multiple backends straightforward. Configure multiple exporters and send the same telemetry to each candidate backend without changing your application code.
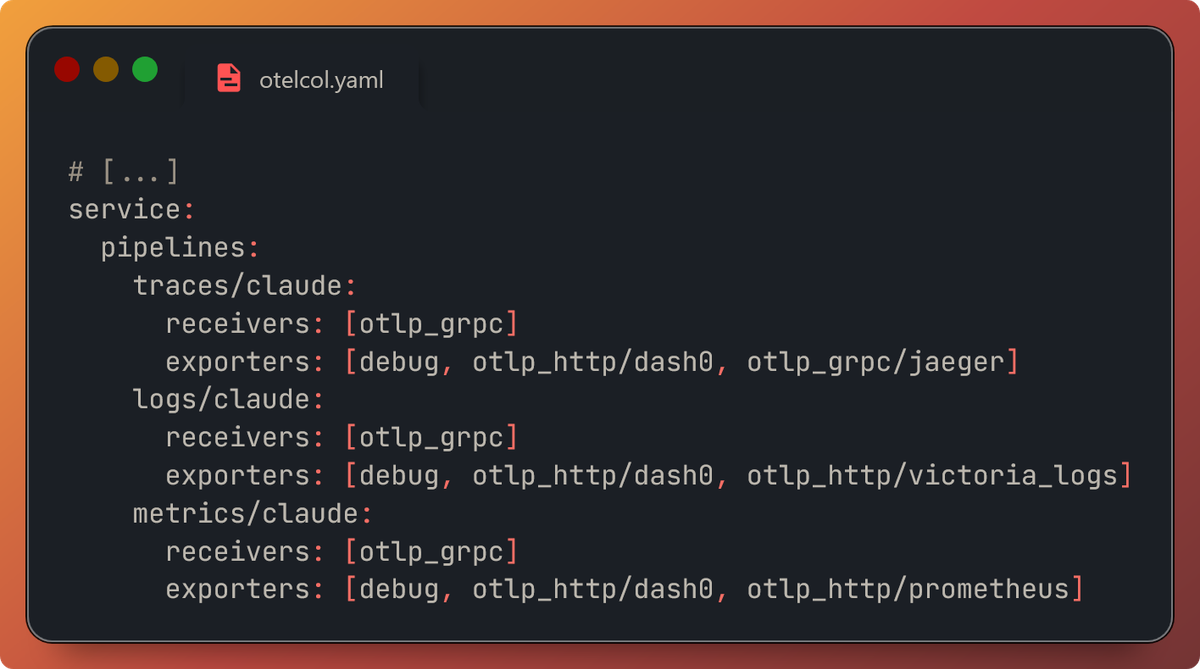
Once data is flowing, start with data fidelity. Send a representative workload and verify that custom span attributes, metric temporality, histogram detail, resource attributes, and trace context remain available after ingestion. When something looks wrong, check whether you can inspect the original OpenTelemetry fields and identify any transformations applied by the backend.
Next, confirm that the platform understands semantic conventions, offers appropriate filtering for typed attributes, and scopes telemetry by resource context.
For cross-signal correlation, trigger a known failure or latency spike and follow the investigation from metric to trace to log. Record whether you need to copy identifiers, adjust time ranges, or rebuild queries in another interface.
You should also recreate a sample of your existing dashboards, alerts, and runbook queries. Note how much vendor-specific syntax is required and how easily the resulting artifacts can be exported or versioned.
Finally, compare the vendor's cost estimate with the usage reported during the trial. Project the same workload at higher volumes and vary host count, cardinality, sampling, retention, and user count independently.
Run the proof of concept long enough to include normal traffic, deployments, quiet periods, and at least one realistic investigation. For many teams, one or two weeks is sufficient, but the right duration depends on how often those conditions occur.
How Dash0 approaches OpenTelemetry
Dash0 is one such platform that's built natively around the OpenTelemetry data model and the evaluation criteria described in this article.
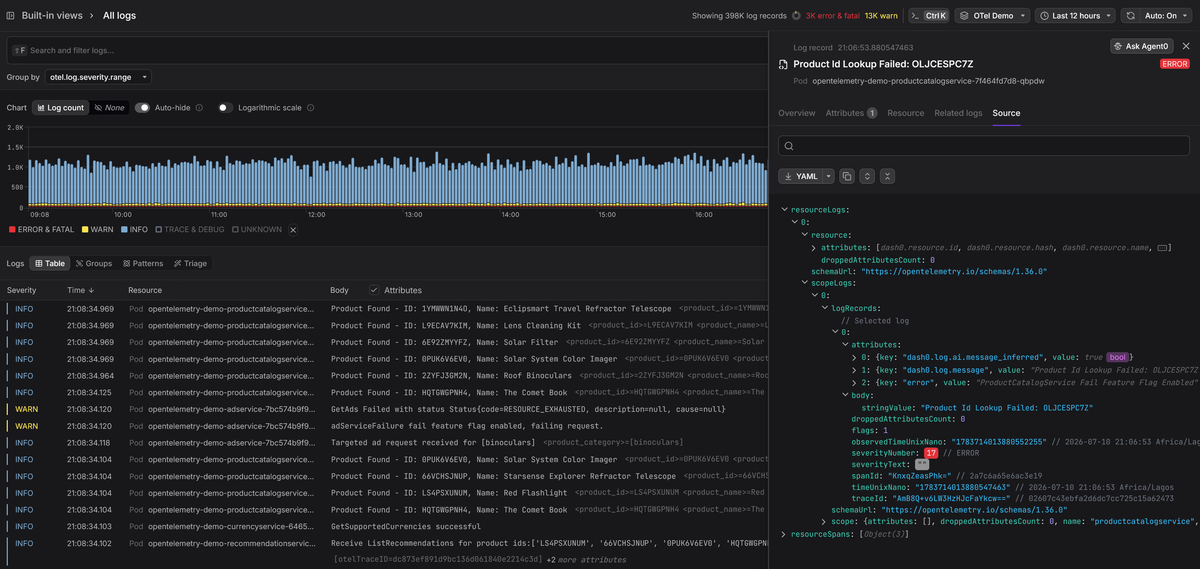
It supports logs, metrics, and traces as first-class signals through OTLP. OpenTelemetry resource attributes and semantic conventions drive filtering, navigation, and cross-signal investigation rather than being treated as generic metadata.
Both PromQL and SQL are available for querying telemetry. PromQL supports metrics and time-series aggregations derived from logs and spans, with drill-down to the underlying records. SQL provides a familiar interface for record-oriented analysis across the stored telemetry.
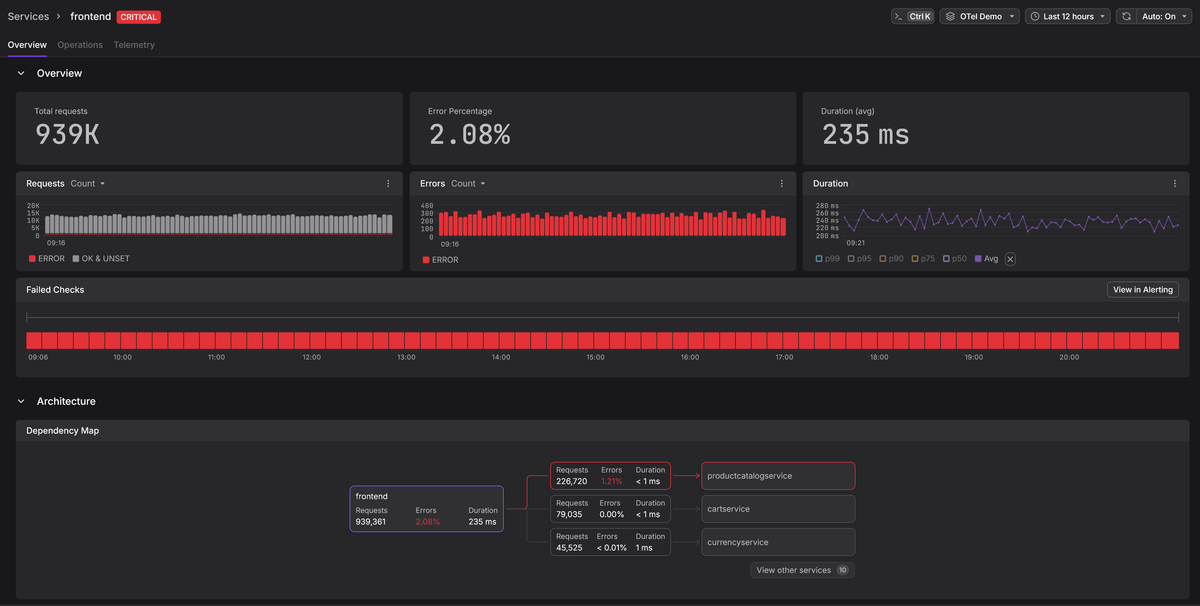
Dashboards use the open Perses specification, telemetry can also be exported in the native OTLP format to another destination, including for retention beyond the period configured in Dash0.
Dash0 uses per-signal pricing without separate host, seat, or custom-metric charges. You should still model the complete bill against your own telemetry, but the pricing units are designed to remain predictable as telemetry volumes grow.
The most reliable way to judge these capabilities is with your own telemetry. Start a free Dash0 trial, add it as another exporter in your Collector, and compare it with the other candidates in your proof of concept.
Final thoughts
OpenTelemetry gives you the freedom to change where your telemetry goes, but it's your backend that determines how useful that freedom is in practice.
The wrong choice can leave you with portable instrumentation but fragile investigations, opaque transformations, proprietary queries, and a pricing model that discourages the detail your engineers need. The right choice harnesses the OpenTelemetry data model into a faster and more intuitiveway to understand and debug production issues.
The most reliable way to compare candidates is to send them the same realistic telemetry and test the workflows your engineers actually use. A backend should earn its place on the shortlist through observable behavior, not through an OpenTelemetry logo on its integrations page.
For a closer look at the available platforms, see our comparison of the best OpenTelemetry tools. It compares the leading options and can help you build an initial shortlist.