Last updated: June 9, 2026
How OpenTelemetry Logging Works (with Examples)
Logs are the oldest telemetry signal, but in distributed systems they're often the least useful. When services span multiple languages and runtimes, each one produces logs in its own format with its own conventions. Correlating a single user request across those services means manually stitching together log lines that were never designed to be connected.
OpenTelemetry logging doesn't try to replace your logging library. Instead, it defines a vendor-neutral data model that existing libraries feed into, so that logs from any service carry the same structure, the same resource context, and the same trace identifiers. The result is that logs become a first-class telemetry signal you can correlate with traces and metrics, rather than isolated text that happens to be nearby.
This article covers the OpenTelemetry logs data model in detail, how application logs enter the OpenTelemetry pipeline through SDKs and log bridges, how the Collector handles logs from sources you don't control, and what changes operationally once your logs are represented this way.
What are OpenTelemetry logs?
At a high level, OpenTelemetry treats logs as first-class telemetry signals, alongside traces and metrics. Each log is a well-defined structured record with:
- A precise timestamp.
- A severity level with consistent semantics.
- Structured attributes for context.
- Metadata describing where the log came from.
- Optional trace and span identifiers that link the log to a request's execution path.
This design allows logs from diverse sources to be processed uniformly, even when they originate from different logging libraries or programming environments.
OpenTelemetry logs vs the traditional logging model
Traditional logging approaches focus on local output: writing text to files or
stdout, often in ad-hoc formats. This works well for single applications, but
breaks down in distributed environments where each service produces logs with
diverse formats and conventions.
Adopting structured logging helps, but it doesn't solve the underlying problem. Structure gives you parseable fields, but it doesn't give you a shared model across services, languages, and runtimes, and it doesn't connect logs to the rest of your telemetry.
OpenTelemetry doesn't ask you to replace your logging library. Instead, it defines a common model that your existing logs are mapped into, so that records from different services, languages, and frameworks all share the same structure, the same severity scale, and the same resource context.
When logs are emitted within an active OpenTelemetry trace, relevant identifiers are automatically attached to each log record, making it possible to:
- Jump from a log entry directly to the trace that produced it.
- See associated logs in the exact execution context of a request.
- Correlate errors, latency spikes, and anomalous behavior across signals.
To support these capabilities, OpenTelemetry defines a logs data model that standardizes how log records are represented regardless of the source.
The rest of this guide explores that model in detail, explaining how its fields work together, why they exist, and how OpenTelemetry uses them to turn logs into reliable, high-signal observability data.
Understanding the OpenTelemetry logging specification
The OpenTelemetry logs data model is designed to accommodate logs from a wide range of sources while preserving their original meaning. Existing log formats can be mapped into the model without ambiguity and, in most cases, reconstructed without loss of information.
An OpenTelemetry log record consists of a set of named top-level fields with well-defined semantics, plus flexible attributes for event-specific context. The full list of fields are:
| Field | Description |
|---|---|
Timestamp | Time when the event occurred at the source. |
ObservedTimestamp | Time when the collection system first saw the event. |
TraceId | Unique identifier for a distributed trace |
SpanId | Span ID within the trace. |
TraceFlags | W3C trace flags (e.g. sampled). |
SeverityText | Original severity label from the source. |
SeverityNumber | Normalized numeric severity for cross-system comparison. |
Body | Primary log content (string or structured data). |
Resource | Entity that produced the log. |
InstrumentationScope | Library or module that emitted the record. |
Attributes | Arbitrary key-value pairs with event-specific context. |
EventName | Identifies the class or type of a structured Event. |
A few of these deserve a closer look.
Timestamp vs ObservedTimestamp
Timestamp records when the log actually happened, measured by the origin
clock, while ObservedTimestamp records when OpenTelemetry's collection
pipeline first saw it.
For logs produced directly through the OTel SDK, these two values are usually
identical because the SDK sets both at generation time. The distinction matters
for logs collected externally, like those the
OpenTelemetry Collector
tails from a file or receives over syslog. In those cases, Timestamp reflects
the original log time (once parsed), while ObservedTimestamp reflects when the
Collector ingested it.
If a downstream system only supports a single timestamp, the spec recommends
preferring Timestamp when it's present and falling back to ObservedTimestamp
otherwise.
Instrumentation scope
The InstrumentationScope field identifies which library or module produced a
log record. It's a (name, version) tuple, like ("logback", "1.4.0") or
("@opentelemetry/instrumentation-pino", "0.49.0").
In the
OpenTelemetry Protocol (OTLP) wire format,
logs from the same scope are grouped under a shared scopeLogs entry, which
avoids repeating scope metadata on every individual record. You'll see this
grouping in the OTLP JSON example below.
Trace context fields
To enable trace-log correlation, the data model incorporates fields from the W3C Trace Context specification:
TraceId: The unique identifier for a distributed trace.SpanId: The identifier for a specific span (operation) within that trace.TraceFlags: Flags providing metadata about the trace, such as whether it was sampled.
When present, these fields let you link an individual log record directly to the trace that produced it, so you can navigate between logs and their execution context in distributed systems.
Log levels
The data model also standardizes how log severity is expressed by decoupling severity semantics from language-specific logging conventions:
-
SeverityText: The original severity label emitted by the source. -
SeverityNumber: A numeric value that enables consistent comparison and filtering across systems. Smaller numbers represent less severe events, larger numbers more severe ones.
| SeverityNumber Range | SeverityText |
|---|---|
| 1–4 | TRACE |
| 5–8 | DEBUG |
| 9–12 | INFO |
| 13–16 | WARN |
| 17–20 | ERROR |
| 21–24 | FATAL |
Events and the EventName field
A log record with a non-empty EventName is considered an
Event. Where a
regular log record can contain anything in its Body, an Event declares upfront
what kind of thing happened and follows a known attribute schema for that event
type. That predictability is the point: backends and tooling can recognize and
route Events without parsing the body.
Going forward, the OTel project is defining all new log-related semantic conventions as Events, which means typed, schema-driven log records will become the standard rather than the exception.
The most mature example is the
exception event.
A log record with EventName: "exception" is expected to carry
exception.type, exception.message, and exception.stacktrace as attributes.
Any backend that understands the convention can detect, group, and alert on
exceptions automatically.
This doesn't mean every log record needs an EventName. Ad-hoc logs can
continue to use Body alone, but if you're building instrumentation that emits
known event types, setting EventName gives backends a structured hook to work
with.
How OTLP represents log records
To see how all of these fields fit together on the wire, here's a log record in OTLP JSON format:
12345678910111213141516171819202122232425262728293031323334353637{"resourceLogs": [{"resource": {"attributes": [{"key": "service.name","value": { "stringValue": "checkoutservice" }}]},"scopeLogs": [{"scope": { "name": "logback", "version": "1.4.0" },"logRecords": [{"timeUnixNano": "1756571696706248000","observedTimeUnixNano": "1756571696710000000","severityNumber": 17,"severityText": "ERROR","body": { "stringValue": "Database connection failed" },"attributes": [{ "key": "thread.id", "value": { "intValue": 42 } },{"key": "exception.type","value": { "stringValue": "SQLException" }}],"traceId": "da5b97cecb0fe7457507a876944b3cf","spanId": "fa7f0ea9cb73614c"}]}]}]}
At the top level, resourceLogs groups records emitted by the same resource
which in this case is a single microservice identified by service.name. Within
each resource, scopeLogs group records by instrumentation scope, indicating
which library or module produced them. The logRecords array then contains the
individual events, each enriched with timestamps, severity, context, and
optional trace identifiers.
With this structure in place, logs from different services, languages, and runtimes can be processed and queried the same way regardless of where they originated.
But a data model is only a specification, not a runtime. Your applications won't produce compliant log records on their own; they need to be wired into the OpenTelemetry pipeline through SDKs and log bridges.
Integrating application logs with OpenTelemetry
Unlike traces and metrics, which rely on OpenTelemetry-specific APIs for instrumentation, logging follows a different model. Given the long history and diversity of logging frameworks, OpenTelemetry is designed to integrate with existing libraries rather than replace them.
Application logs enter the OpenTelemetry ecosystem through log bridges: adapters that forward records from familiar libraries such as Python's logging, Java's SLF4J or Logback, and .NET's Serilog.
This design means you can keep your existing logging code and tooling, while gaining the OpenTelemetry log data model, trace correlation, and consistent export to observability backends.
Understanding the OpenTelemetry logging components
The Logs API defines the contract for passing log records into the OpenTelemetry pipeline. It's primarily intended for library authors to build appenders or handlers, but it can also be called directly from instrumentation libraries or application code.
It consists of the following core components:
-
LoggerProvider: Creates and managesLoggerinstances. Typically, one is configured per process and registered globally for consistent access. -
Logger: Responsible for emitting logs asLogRecords. In practice, your existing logging library (via a bridge) will call it for you. -
LogRecord: The data structure representing a single log event, with all the fields defined in the logs data model described earlier.
While the Logs API defines how logs are created, the Logs SDK handles processing and export. It provides:
- A concrete
LoggerProviderimplementation. - A
LogRecordProcessorthat sits between log creation and export and is responsible for enriching and batchingLogRecords. - A
LogRecordExporterthat takes processed records and exports them to set destinations (often an OTLP endpoint).
OpenTelemetry logging example using log bridges
The OpenTelemetry Logs SDK does not automatically capture application logs. It provides the processing and export pipeline, but log records must be explicitly fed into it through a log bridge.
A log bridge (or appender) connects an existing logging framework to the OpenTelemetry Logs API. Rather than rewriting applications to emit logs through OpenTelemetry directly, you only need to attach a bridge to the logger you already use.
For example, consider a Node.js application using Pino:
12345import pino from "pino";const logger = pino();logger.info("hi");
By default, Pino produces JSON logs like this:
1234567{"level": 30,"time": 1758515262941,"pid": 55904,"hostname": "falcon","msg": "hi"}
To bring these logs into an OpenTelemetry pipeline, you must configure the
OpenTelemetry SDK,
register a LogRecordProcessor and LogRecordExporter, and include the Pino
log bridge via the
@opentelemetry/instrumentation-pino
package:
123456789101112131415import { PinoInstrumentation } from "@opentelemetry/instrumentation-pino";import { logs, NodeSDK } from "@opentelemetry/sdk-node";import pino from "pino";const sdk = new NodeSDK({logRecordProcessor: new logs.SimpleLogRecordProcessor(new logs.ConsoleLogRecordExporter(),),instrumentations: [new PinoInstrumentation()],});sdk.start();const logger = pino();logger.info("hi");
The SimpleLogRecordProcessor immediately exports each log, which is useful for
development and debugging. In production, it is typically replaced with a
BatchLogRecordProcessor to reduce overhead, and the ConsoleLogRecordExporter
is swapped for an OTLPLogExporter that streams logs to an OTLP endpoint
(typically the
OpenTelemetry Collector):
12345678910import { OTLPLogExporter } from "@opentelemetry/exporter-logs-otlp-http";import { PinoInstrumentation } from "@opentelemetry/instrumentation-pino";import { logs, NodeSDK } from "@opentelemetry/sdk-node";import pino from "pino";const sdk = new NodeSDK({logRecordProcessor: new logs.BatchLogRecordProcessor(new OTLPLogExporter()),instrumentations: [new PinoInstrumentation()],});sdk.start();
When viewed through the Collector using the debug exporter, the resulting log record appears as follows:
123456789101112131415161718192021222324252627282930312025-09-22T05:31:27.964Z info ResourceLog #0Resource SchemaURL:Resource attributes:-> host.name: Str(falcon)-> host.arch: Str(amd64)-> host.id: Str(4a3dc42bf0564d50807d1553f485552a)-> process.pid: Int(59532)-> process.executable.name: Str(node)-> process.executable.path: Str(/home/ayo/.local/share/mise/installs/node/24.8.0/bin/node)-> process.command_args: Slice(["/home/ayo/.local/share/mise/installs/node/24.8.0/bin/node","--experimental-loader=@opentelemetry/instrumentation/hook.mjs","/home/ayo/dev/dash0/repro-contrib-2838/index.js"])-> process.runtime.version: Str(24.8.0)-> process.runtime.name: Str(nodejs)-> process.runtime.description: Str(Node.js)-> process.command: Str(/home/ayo/dev/dash0/repro-contrib-2838/index.js)-> process.owner: Str(ayo)-> service.name: Str(unknown_service:node)-> telemetry.sdk.language: Str(nodejs)-> telemetry.sdk.name: Str(opentelemetry)-> telemetry.sdk.version: Str(2.0.1)ScopeLogs #0ScopeLogs SchemaURL:InstrumentationScope @opentelemetry/instrumentation-pino 0.49.0LogRecord #0ObservedTimestamp: 2025-09-22 05:31:27.924 +0000 UTCTimestamp: 2025-09-22 05:31:27.924 +0000 UTCSeverityText: infoSeverityNumber: Info(9)Body: Str(hi)Trace ID:Span ID:Flags: 0
This output shows how the bridge and Logs SDK work together. The original Pino
log is translated into an OpenTelemetry LogRecord, enriched with resource
metadata, mapped to standardized severity fields, and annotated with
instrumentation scope information. Trace correlation fields are present, though
unset in this example because no active span was in scope.
Note that log bridge availability and maturity varies by language and framework. Always consult the OpenTelemetry documentation for your language to confirm what is supported and how it should be configured. For example, see the Go otelslog guide for the equivalent setup with Go's slog.
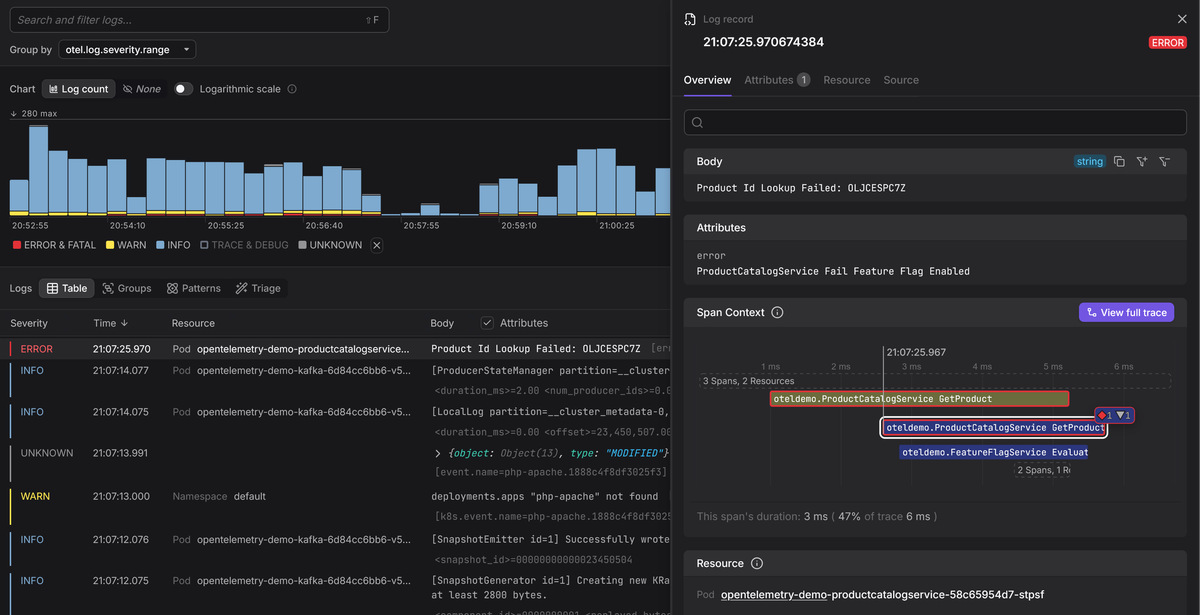
Correlating OpenTelemetry logs and traces
When you use the OTel SDK for both tracing and logging, it automatically correlates the two.
For this to work, you need to emit logs within an active span. When you do, the SDK attaches the current trace and span identifiers to each log record automatically.
In practice, spans are usually created via zero-code instrumentation around common operations such as HTTP requests or database calls. Spans can also be created manually when needed:
1234567import { api, logs, NodeSDK } from "@opentelemetry/sdk-node";const tracer = api.trace.getTracer("example");tracer.startActiveSpan("manual-span", (span) => {logger.info("in a span");});
The resulting log record now includes the active trace context:
123456789LogRecord #1ObservedTimestamp: 2025-09-22 05:51:37.685 +0000 UTCTimestamp: 2025-09-22 05:51:37.685 +0000 UTCSeverityText: infoSeverityNumber: Info(9)Body: Str(in a span)Trace ID: 6691c3b82c157705904ba3b5b921d60aSpan ID: 72efdc9ec81b179aFlags: 1
This creates a direct link between logs and traces: from a trace, you can navigate directly to the logs emitted within its spans, and from a log entry, you can jump to the full distributed trace that produced it.
What to do if a log bridge isn't available
If your logging library currently lacks a log bridge, you can still enrich your logs with trace context and let the Collector do the mapping.
Most logging libraries allow contextual fields to be injected into log output
without repeating them each time at log point. If you include trace_id,
span_id, and trace_flags with each log record, you keep trace-log
correlation intact:
12345678{"level": "ERROR","timestamp": "2025-10-05T15:34:11.428Z","message": "Payment authorization failed","trace_id": "c8f4a2171adf3de0a2c0b2e8f649a21f","span_id": "d6e2b6c1a2f53e4b","user_id": "user-1234"}
Once the Collector ingests these records, it can parse and map those fields to
the canonical TraceId and SpanId fields in the OpenTelemetry log data model.
You get trace-log correlation without changing your logging calls, and you can adopt a proper log bridge later when one becomes available for your framework.
Python's Loguru is a good example of this pattern in practice. It doesn't have a first-party OTel integration, but you can inject the active trace and span IDs into every log record through middleware, giving you correlation now while the ecosystem catches up.
How the OpenTelemetry Collector ingests and transforms logs
So far, we've focused on applications emitting OpenTelemetry-native logs directly via SDKs and log bridges. In practice, however, not every component in a system is instrumented or even under your control. Legacy applications, third-party software, and infrastructure components typically emit logs in their own formats, with no awareness of OpenTelemetry.
The OpenTelemetry Collector addresses this gap. It can ingest logs from a wide range of sources, parse them, and map them into the OpenTelemetry logs data model before export. This allows systems that know nothing about OpenTelemetry to still participate in the same observability pipeline as instrumented applications.
Log ingestion via receivers
The Collector ingests logs through receivers, each designed to handle a specific input source or protocol. Common examples include:
-
filelogreceiver for tailing local log files.
-
awscloudwatchreceiver for AWS CloudWatch log groups and streams.
-
syslogreceiver for network-delivered syslog messages.
-
fluentforwardreceiver for integration with Fluentd or Vector.
Once a receiver ingests a log, it becomes an OpenTelemetry log record, but most of its fields will be empty or unpopulated. The receiver's job is to get the data in, not to interpret it.
Consider the following Linux authentication log entry:
1Aug 20 18:23:23 ubuntu-lts sshd[47339]: Received disconnect from 180.101.88.228 port 11349:11: [preauth]
When ingested by the filelogreceiver and viewed with the debug exporter, it
appears as follows:
12345678910LogRecord #2ObservedTimestamp: 2025-09-21 17:25:01.598645527 +0000 UTCTimestamp: 1970-01-01 00:00:00 +0000 UTCSeverityText:SeverityNumber: Unspecified(0)Body: Str(Aug 20 18:23:23 ubuntu-lts sshd[47339]: Received disconnect from 180.101.88.228 port 11349:11: [preauth])Attributes:-> log.file.name: Str(auth.log)Trace ID:Span ID:
At this stage, the log is little more than an unstructured string stored in the
Body, accompanied by minimal metadata. Important fields such as Timestamp,
SeverityNumber, and contextual attributes remain unset. This is expected as
receivers prioritize ingestion, not interpretation.
Parsing and enrichment with operators and processors
To turn these bare log records into something you can actually query and correlate, you typically need to:
- Extract timestamps and map to the
Timestampfield. - Identify severity levels and map them to
SeverityTextandSeverityNumber. - Extract contextual fields into structured
Attributes. - Enrich records with resource metadata (host, process, Kubernetes, cloud).
- Populate trace context fields if available.
This work is performed using:
- Operators, which act on individual log entries during ingestion.
- Processors, which operate on batches of telemetry regardless of the ingestion source.
For example, applying the syslog_parser operator within the filelog
receiver:
12345678# otelcol.yamlreceivers:filelog:include: [/var/log/auth.log]operators:- type: syslog_parserprotocol: rfc3164allow_skip_pri_header: true
Produces an updated OpenTelemetry LogRecord:
123456789101112131415LogRecord #2ObservedTimestamp: 2025-09-21 18:40:22.780865051 +0000 UTCTimestamp: 2025-08-20 18:23:23 +0000 UTCSeverityText:SeverityNumber: Unspecified(0)Body: Str(Aug 20 18:23:23 ubuntu-lts sshd[47339]: Received disconnect from 180.101.88.228 port 11349:11: [preauth])Attributes:-> log.file.name: Str(auth.log)-> message: Str(Received disconnect from 180.101.88.228 port 11349:11: [preauth])-> hostname: Str(ubuntu-lts)-> appname: Str(sshd)-> proc_id: Str(47339)Trace ID:Span ID:Flags: 0
The timestamp is now correctly parsed, and key fields from the syslog prefix
have been extracted into the Attributes map.
Additional operators can be chained to extract domain-specific details. For
example, a regex_parser can extract the client IP and port:
12345# otelcol.yaml- type: regex_parserparse_from: attributes.messageregex:'Received disconnect from (?P<client_ip>[\d.]+) port (?P<client_port>\d+)'
Resulting in new attributes:
123Attributes:-> client_ip: Str(180.101.88.228)-> client_port: Str(11349)
Advanced transformations with OTTL
Operators handle parsing, but they work on individual fields during ingestion. When you need to restructure records after parsing, like moving attributes to the resource, normalizing field names to match semantic conventions, or mapping severity based on log content, you need the OpenTelemetry Transformation Language (OTTL).
OTTL runs in the
transform processor
(and other processors) and operates on complete log records with conditional
logic. Here's an example that takes the ingested and parsed sshd records and
reshapes them into a fully compliant OpenTelemetry record:
123456789101112131415161718192021222324252627282930# otelcol.yamlprocessors:transform/auth_logs:error_mode: ignorelog_statements:# Move host and process attributes to the Resource- set(resource.attributes["host.name"], log.attributes["hostname"])- set(resource.attributes["process.executable.name"],log.attributes["appname"])- set(resource.attributes["process.pid"], Int(log.attributes["proc_id"]))# Conform attributes to semantic conventions- set(log.attributes["client.address"], log.attributes["client_ip"])- set(log.attributes["client.port"], Int(log.attributes["client_port"]))- set(log.attributes["log.record.original"], log.body)- set(log.body, log.attributes["message"])# Severity mapping- set(log.severity_number, SEVERITY_NUMBER_INFO) where IsMatch(log.body,"^Received disconnect")- set(log.severity_text, "INFO") where log.severity_number >=SEVERITY_NUMBER_INFO and log.severity_number <= SEVERITY_NUMBER_INFO4# Delete the old, non-compliant attributes- delete_key(log.attributes, "hostname")- delete_key(log.attributes, "appname")- delete_key(log.attributes, "proc_id")- delete_key(log.attributes, "client_ip")- delete_key(log.attributes, "client_port")- delete_key(log.attributes, "message")
After these transformations, the raw sshd line from earlier is now a complete
OpenTelemetry log record with resource attributes, normalized severity, and
semantic-convention-compliant fields:
1234567891011121314151617181920212223242025-09-22T03:14:29.229Z info ResourceLog #0Resource SchemaURL:Resource attributes:-> host.name: Str(ubuntu-lts)-> process.executable.name: Str(sshd)-> process.pid: Int(47339)ScopeLogs #0ScopeLogs SchemaURL:InstrumentationScope. . .LogRecord #2ObservedTimestamp: 2025-09-22 03:14:29.130188792 +0000 UTCTimestamp: 2025-08-20 18:23:23 +0000 UTCSeverityText: INFOSeverityNumber: Info(9)Body: Str(Received disconnect from 180.101.88.228 port 11349:11: [preauth])Attributes:-> client.port: Int(11349)-> client.address: Str(180.101.88.228)-> log.file.name: Str(auth.log)-> log.record.original: Str(Aug 20 18:23:23 ubuntu-lts sshd[47339]: Received disconnect from 180.101.88.228 port 11349:11: [preauth])Trace ID:Span ID:Flags: 0
The pattern is consistent: compose receivers, operators, and processors into a pipeline, and the Collector converts whatever raw log format you throw at it into structured OpenTelemetry records. For a worked example that takes this further with trace correlation, see our guide on transforming PostgreSQL logs with the OpenTelemetry Collector.
Best practices for OpenTelemetry logging
Getting OpenTelemetry logging right in production takes more than just turning on a bridge or deploying a Collector. The practices below help you produce logs that are reliable and operationally useful without blowing up your ingestion bill.
1. Start with structure
When logs are unstructured, like the raw sshd example, you end up stacking
operators and transform rules just to pull out basics like timestamp or client
IP.
That effort largely disappears if your application emits structured logs from the outset, because log bridges and the Collector can map named fields directly into the OpenTelemetry data model instead of parsing them out of raw text.
The rule of thumb is simple: reserve parsers and regex operators for legacy systems you cannot change, and ensure new services emit structured logs in JSON by default.
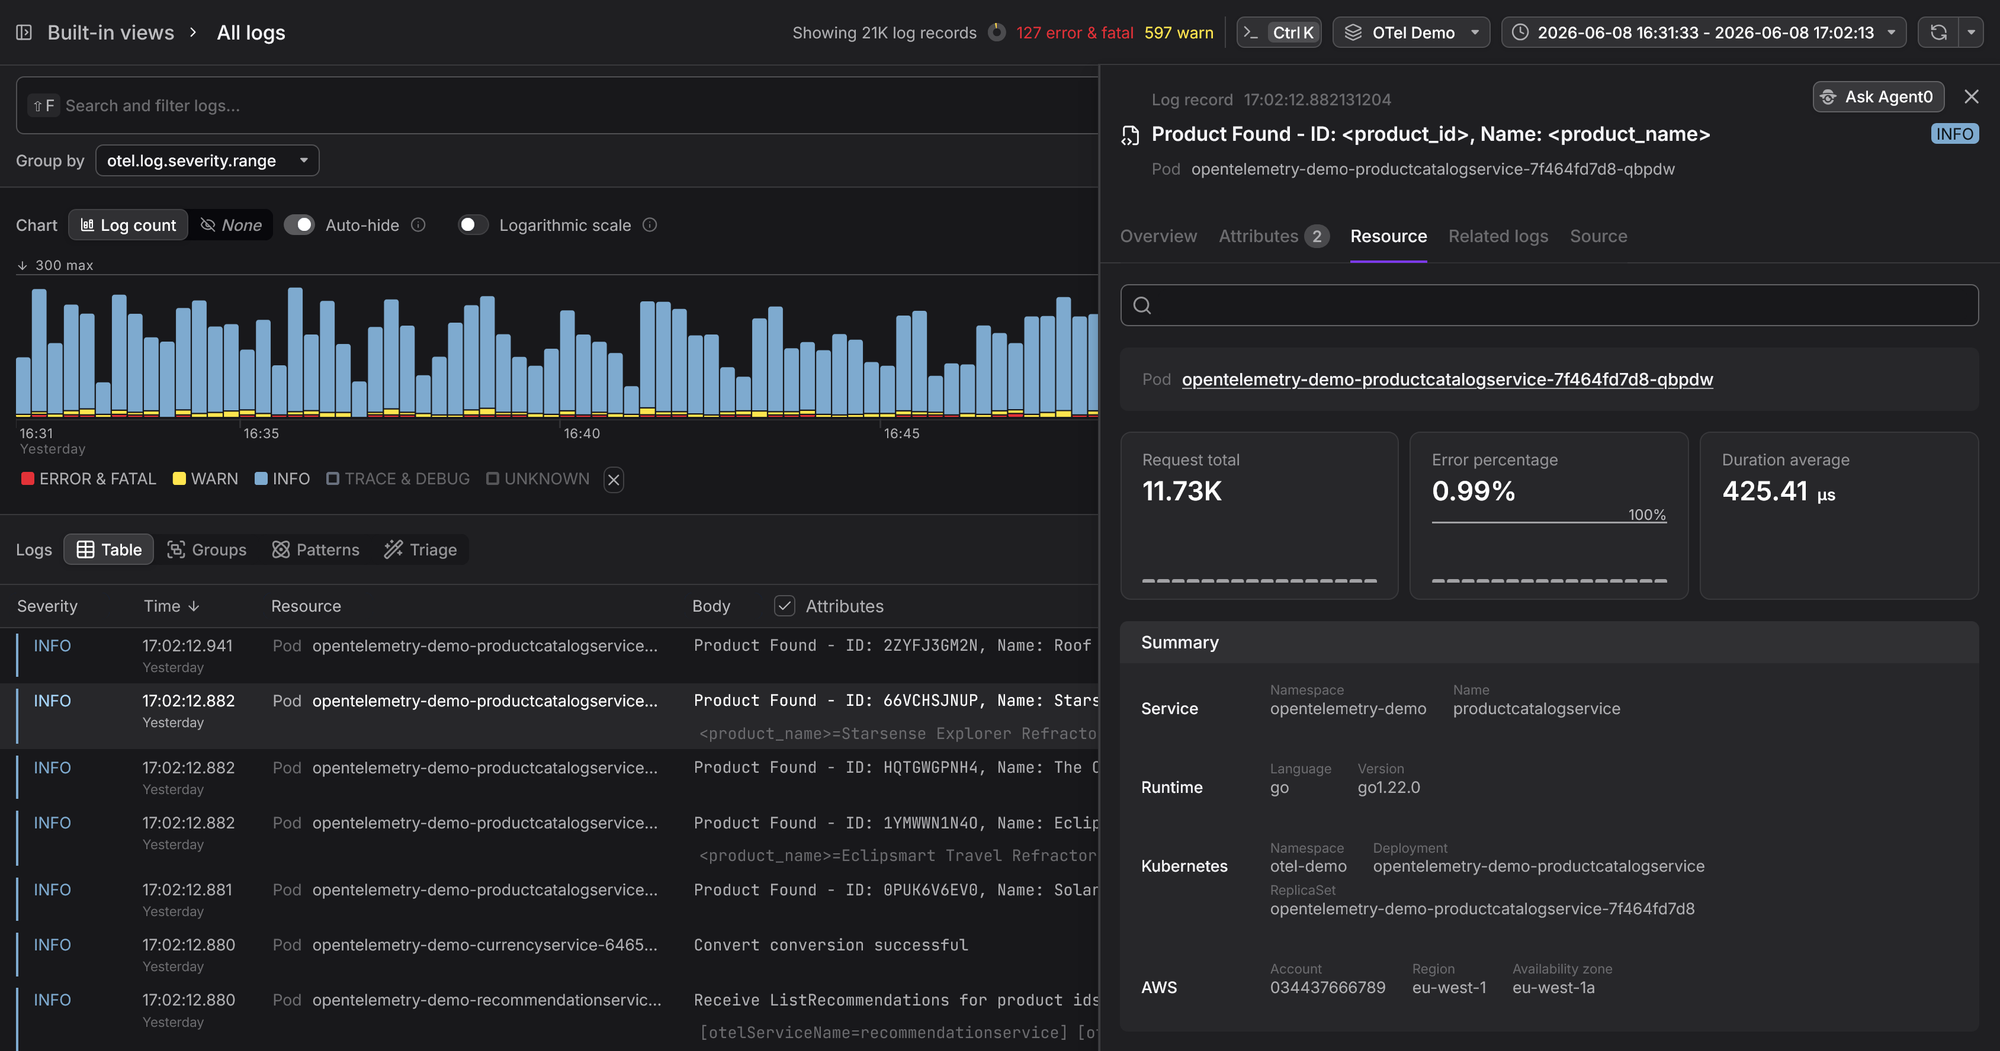
2. Embrace high-cardinality attributes
High-cardinality attributes in logs and traces are essential for cross-signal correlation and effective root-cause analysis. They enable an important distinction for troubleshooting: is this affecting everyone, or only a specific subset?
Without high cardinality, you can see that you have a spike in errors. With it,
you can see that the error spike is coming from user:8675309 on the canary
deployment in eu-west-1 who has the new-checkout-flow feature flag enabled.
3. Use semantic conventions
Rely on OpenTelemetry's semantic conventions for contextual log attributes wherever you can. This keeps your logs interpretable across OTel-compliant backends, aligns them with traces and metrics, and eliminates the post-ingestion cleanup that comes from having to rename or normalize attributes after parsing.
4. Always include resource attributes
Resource attributes anchor logs to the services and environments that produced them. Set these attributes in the SDK Resource where possible, and enrich them further in the Collector using processors such as resourcedetection or k8sattributes.
Without consistent resource metadata, even well-structured logs lose much of their diagnostic value.
5. Scrub sensitive data
It's easy for tokens, credentials, or PII to end up in log output without anyone
realizing it, especially when logging request bodies or error payloads. The
safest approach is to handle this at both ends: configure your logging libraries
to avoid emitting secrets in the first place, and use Collector processors like
transform and redaction as a second line of defense before logs leave your
environment.
For a detailed walkthrough, see our guide on scrubbing sensitive data with OpenTelemetry.
6. Control your log volume
Unchecked log volume is one of the fastest ways to make observability costs unpredictable. The goal is to keep the logs you'll actually use during an incident and discard the rest before they reach your backend.
Start by setting appropriate log levels in your application frameworks so that
DEBUG output stays out of production. Then use the Collector's
filter processor
to drop logs you'll never query, and the
deduplication processor
to collapse repeated entries.
Final thoughts
At this point, you understand how OpenTelemetry logging works conceptually: the data model, log bridges, trace correlation, and the role of the Collector. The next step depends on where you are in your OpenTelemetry adoption journey.
If you're instrumenting applications directly, start with language-specific logging guides that show how to wire existing logging frameworks into OpenTelemetry using log bridges and SDKs.
For legacy systems or third-party logs, focus instead on configuring the Collector to ingest raw logs, then incrementally add parsing and enrichment until logs conform to the OpenTelemetry data model.
Once logs are flowing through your telemetry pipeline, the next question is which observability backend to send them to.
Most backends accept OTLP today, but how they handle it varies. Some map OpenTelemetry data into an older internal schema, which can mean losing attribute fidelity, paying more for high-cardinality fields, or dropping native support for semantic conventions.
An OpenTelemetry-native backend is built around the OTel data model as its core representation, not mapped onto a legacy schema, so the data model you've been instrumenting against is the same one you query in production.
Dash0 works this way. It's built from the ground up to be OpenTelemetry-native, accepts OTLP out of the box, preserves every field and attribute in the data model as-is, and lets you correlate logs with traces and metrics without penalizing high-cardinality data.
Start a free trial with Dash0 and see how the data model, trace correlation, and Collector pipeline described in this guide work in practice.
