Last updated: May 18, 2026
OpenTelemetry-Native Logging in .NET with Serilog
Serilog gives you structured logging with rich context, but the records it produces are disconnected from the rest of your observability stack by default.
Those records need to reach an observability pipeline where they can be transformed into OpenTelemetry-compliant log records, correlated with traces, enriched with resource attributes, and shipped to whatever backend your team uses.
The Serilog.Sinks.OpenTelemetry package handles that last mile. It converts Serilog events into OTel logs and exports them via the OpenTelemetry protocol (OTLP), either over gRPC or HTTP.
This guide covers installing the sink, inspecting the resulting OTel log records through a local Collector, mapping Serilog fields to the OTel data model, setting resource attributes, normalizing enricher output to semantic conventions, and shipping everything to a production backend.
Prerequisites
You'll need the following to follow along:
- .NET 10 SDK (the current LTS at the time of writing).
- An ASP.NET Core project with Serilog already configured (see our Serilog guide if you're starting from scratch).
- An OpenTelemetry Collector instance to see the pipeline in action.
Getting started with the Serilog OpenTelemetry sink
To get started, install the package first:
1dotnet add package Serilog.Sinks.OpenTelemetry
Then add the OpenTelemetry sink to your appsettings.json. Make sure
Serilog.Sinks.OpenTelemetry is listed in the Using array so Serilog knows
where to find it:
12345678910111213141516{"Serilog": {"Using": ["Serilog.Sinks.OpenTelemetry"],"MinimumLevel": "Information","Enrich": ["FromLogContext"],"WriteTo": [{"Name": "OpenTelemetry","Args": {"endpoint": "http://localhost:4317","protocol": "Grpc"}}]}}
The protocol field accepts Grpc (the default) or HttpProtobuf. If your
Collector or backend expects HTTP/protobuf instead of gRPC, switch it out and
adjust the endpoint accordingly:
1234567{"Name": "OpenTelemetry","Args": {"endpoint": "http://localhost:4318","protocol": "HttpProtobuf"}}
Your Program.cs just needs to read the configuration as normal. If you're
already using the
bootstrap logger pattern
from our Serilog tutorial, you don't need to change anything here:
123456789101112131415161718192021222324252627282930using Serilog;using Serilog.Formatting.Compact;Log.Logger = new LoggerConfiguration().MinimumLevel.Information().WriteTo.Console(new CompactJsonFormatter()).CreateBootstrapLogger();try{var builder =WebApplication.CreateBuilder(args);builder.Host.UseSerilog((context, services, configuration) => configuration.ReadFrom.Configuration(context.Configuration).ReadFrom.Services(services));// ... app setup omitted for brevityapp.Run();}catch (Exception ex){Log.Fatal(ex, "Application terminated unexpectedly");}finally{Log.CloseAndFlush();}
The bootstrap logger uses a hardcoded console sink to capture startup failures.
Once ReadFrom.Configuration() kicks in, the full pipeline from
appsettings.json takes over, including the now added OpenTelemetry sink.
Inspecting logs with a local Collector
To see what your Serilog events look like after they've been converted into OTel log records, you need to spin up a local OpenTelemetry Collector instance. The debug exporter prints received telemetry directly to the Collector's standard output, which makes it the fastest way to verify that your pipeline is wired up correctly.
Start by creating a Collector configuration file. In your project root (or
wherever you keep your infrastructure files), create otelcol.yaml:
123456789101112131415161718# otelcol.yamlreceivers:otlp:protocols:grpc:endpoint: 0.0.0.0:4317http:endpoint: 0.0.0.0:4318exporters:debug:verbosity: detailedservice:pipelines:logs:receivers: [otlp]exporters: [debug]
Next, create a docker-compose.yml to run the Collector and map the necessary
ports:
1234567891011# docker-compose.ymlservices:otelcol:image: otel/opentelemetry-collector-contrib:0.152.0container_name: otelcolports:- 4317:4317- 4318:4318volumes:- ./otelcol.yaml:/etc/otelcol-contrib/config.yamlrestart: unless-stopped
Start it up in the background with:
1docker compose up -d
You should see the Collector start and report that its OTLP receiver is listening on both ports when you check the Collector's console output:
1docker compose logs --no-log-prefix -f otelcol
1234[...]2026-05-18T05:35:39.596Z info otlpreceiver@v0.152.0/otlp.go:120 Starting GRPC server {"resource": {"service.instance.id": "d42e17ff-661c-4ad6-8ada-7ad4627ee86e", "service.name": "otelcol-contrib", "service.version": "0.152.0"}, "otelcol.component.id": "otlp", "otelcol.component.kind": "receiver", "endpoint": "[::]:4317"}2026-05-18T05:35:39.598Z info otlpreceiver@v0.152.0/otlp.go:175 Starting HTTP server {"resource": {"service.instance.id": "d42e17ff-661c-4ad6-8ada-7ad4627ee86e", "service.name": "otelcol-contrib", "service.version": "0.152.0"}, "otelcol.component.id": "otlp", "otelcol.component.kind": "receiver", "endpoint": "[::]:4318"}2026-05-18T05:35:39.598Z info service@v0.152.0/service.go:264 Everything is ready. Begin running and processing data. {"resource": {"service.instance.id": "d42e17ff-661c-4ad6-8ada-7ad4627ee86e", "service.name": "otelcol-contrib", "service.version": "0.152.0"}}
Now run your .NET application and ensure to specify the OTEL_SERVICE_NAME
environment variable at a minimum so your logs don't show up as
unknown_service in your observability backend.
1OTEL_SERVICE_NAME=demoapp dotnet run
With the appsettings.json we configured in the previous section (pointing at
http://localhost:4317 with gRPC), any Log.Information or ILogger call will
send an OTLP payload to the Collector. For example, if a controller logs this:
123var order = new { Id = id, Total = 99.99, Currency = "USD", Items = new[] { "Widget", "Gizmo" } };_logger.LogInformation("Processing order {@Order}", order);
The Collector's debug exporter will print something like the following to its
console output:
123456789101112131415161718192021222324252627282930312026-05-18T05:39:03.948Z info ResourceLog #0Resource SchemaURL: https://opentelemetry.io/schemas/1.13.0Resource attributes:-> service.name: Str(demoapp)-> telemetry.sdk.name: Str(serilog)-> telemetry.sdk.language: Str(dotnet)-> telemetry.sdk.version: Str(4.2.0-main-057a8c1+057a8c1712d1268a4d7f0952819c535e45c56647)ScopeLogs #0ScopeLogs SchemaURL:InstrumentationScope serilog_app.Controllers.DemoControllerLogRecord #0ObservedTimestamp: 2026-05-18 05:38:09.7381448 +0000 UTCTimestamp: 2026-05-18 05:38:09.7381448 +0000 UTCSeverityText: InformationSeverityNumber: Info(9)Body: Str(Processing order {"Id":123,"Total":99.99,"Currency":"USD","Items":["Widget","Gizmo"]})Attributes:-> Order: Map({"Currency":"USD","Id":123,"Items":["Widget","Gizmo"],"Total":99.99})-> ActionId: Str(7481c86d-8501-4532-b773-675ac49dc884)-> ActionName: Str(serilog_app.Controllers.DemoController.GetOrder (serilog-app))-> RequestId: Str(0HNLKJUIIB4TB:00000001)-> RequestPath: Str(/demo/order/123)-> ConnectionId: Str(0HNLKJUIIB4TB)-> MachineName: Str(falcon)-> EnvironmentName: Str(Development)-> ProcessId: Int(180971)-> ThreadId: Int(13)-> message_template.text: Str(Processing order {@Order})Trace ID: 164ddbafaba3c49032127fd148329b62Span ID: 7f6b956c69871602Flags: 0
If you see structured output like this, then your pipeline is working. The next section breaks down exactly how each Serilog field maps to its OTel counterpart and what to watch out for.
If you don't see any output at all, double check a few things:
- Make sure the Collector container is running (
docker compose ps), - Confirm your
appsettings.jsonendpoint matches the exposed port, and - Verify that
Serilog.Sinks.OpenTelemetryis listed in theUsingarray.
Enabling
Serilog's SelfLog
can also surface connection failures that the sink silently swallows by default.
How Serilog maps to OpenTelemetry log records
With a working Collector in front of you, it's worth walking through the output
field by field. Understanding the mapping between Serilog's LogEvent and
OpenTelemetry's LogRecord helps you reason about what your backend will
actually receive and where to look if something doesn't match your expectations.
Resource attributes
The Resource attributes block at the top of the output contains metadata about
the entity producing the telemetry, not about any individual log event. In the
example above, service.name came from the OTEL_SERVICE_NAME environment
variable we passed at launch, while telemetry.sdk.name,
telemetry.sdk.language, and telemetry.sdk.version were attached
automatically by the sink.
These sit at the resource level in the OTel data model, separate from per-event attributes and are used for infrastructure-level grouping and filtering.
We'll cover how to configure additional resource attributes and when to let the Collector handle them instead later in this guide.
Timestamps and severity
The Serilog Timestamp becomes the OTel Timestamp field, preserved at .NET's
100-nanosecond precision, while ObservedTimestamp records when the Collector
received the record, which is useful for detecting clock drift or export delays.
The Level maps to the corresponding OTel SeverityNumber (Information
becomes 9, Warning becomes 13, Error becomes 17, and so on), with the level
name stored in SeverityText as is.
Body and message template
The rendered message (with placeholders replaced by values) becomes the log
record Body, while the original template is preserved separately as
message_template.text in the Attributes section:
123Body: Str(Processing order {"Id":123,"Total":99.99,"Currency":"USD","Items":["Widget","Gizmo"]})Attributes:-> message_template.text: Str(Processing order {@Order})
By default, the sink puts the rendered message in Body and the static template
in message_template.text. Many backends group and aggregate logs by Body,
which means every event looks unique and you lose the ability to easily spot
patterns like "this record occurred X times in the last hour".
To fix this, use the Collector's transform processor (with OTTL) to swap the rendered message for the template before export:
1234567891011121314151617# otelcol.yamlprocessors:transform/message_template:log_statements:- context: logstatements:- set(attributes["message.rendered"], body) where attributes[ "message_template.text"] != nil- set(body, attributes["message_template.text"]) where attributes["message_template.text"] != nil- delete_key(attributes, "message_template.text")# [...]service:pipelines:logs:receivers: [otlp]processors: [transform/message_template]exporters: [debug]
This replaces the Body with the static template while keeping the rendered
message available as an attribute if you still need it:
123Body: Str(Processing order {@Order})Attributes:-> message.rendered: Str(Processing order {"Id":123,"Total":99.99,"Currency":"USD","Items":["Widget","Gizmo"]})
Attributes
Serilog properties from message templates and enrichers map one-to-one to OTel
attributes. Objects destructured with @ are also maintained as OTel map
values:
12345678910111213Attributes:-> Order: Map({"Currency":"USD","Id":123,"Items":["Widget","Gizmo"],"Total":99.99})-> ActionId: Str(85585e6f-fd93-4412-af59-b45dd8b93ca8)-> ActionName: Str(serilog_app.Controllers.DemoController.GetOrder (serilog-app))-> RequestId: Str(0HNLKPC4P17OV:00000001)-> RequestPath: Str(/demo/order/123)-> ConnectionId: Str(0HNLKPC4P17OV)-> MachineName: Str(falcon)-> EnvironmentName: Str(Development)-> ProcessId: Int(26451)-> ThreadId: Int(11)-> message_template.text: Str(Processing order {@Order})-> message.rendered: Str(Processing order {"Id":123,"Total":99.99,"Currency":"USD","Items":["Widget","Gizmo"]})
The sink treats all of these the same, but there's a distinction worth making.
Properties like ClientIp or OrderId belong on individual log records because
they vary per event, while properties like MachineName or ProcessId are
constant for the lifetime of the process and belong at the
resource level
in the OTel data model.
Serilog properties also use PascalCase by convention, while the OTel spec
expects dot-separated lowercase names (host.name, process.pid, url.path)
that conform to
semantic conventions.
One of the major advantages of adopting OpenTelemetry is having a unified schema
across services regardless of language or framework. If your .NET logs use
RequestPath while your Go services use req_path and your Java services use
path, you've just added a protocol without gaining the interoperability.
To fix both issues, you can use the transform processor once again. The log
context gives you access to both attributes and resource.attributes, so you
can rename properties to their semantic convention equivalents and promote them
to the resource level in a single pass.
The exact statements you'll need depend on which enrichers you've enabled and what metadata your application attaches. The following example covers the common attributes from the debug exporter output we saw earlier, but treat it as a starting point. Review your own Collector output and adjust accordingly:
123456789101112131415161718192021222324252627# otelcol.yamlprocessors:transform/normalize:log_statements:- context: logstatements:# Promote to resource with semconv names- set(resource.attributes["host.name"], attributes["MachineName"]) where attributes["MachineName"] != nil- delete_key(attributes, "MachineName")- set(resource.attributes["process.pid"], attributes["ProcessId"]) where attributes["ProcessId"] != nil- delete_key(attributes, "ProcessId")- set(resource.attributes[ "deployment.environment.name"], ConvertCase(attributes["EnvironmentName"], "lower")) where attributes["EnvironmentName"] != nil- delete_key(attributes, "EnvironmentName")# Rename to semconv equivalents- set(attributes["thread.id"], attributes["ThreadId"]) where attributes["ThreadId"] != nil- delete_key(attributes, "ThreadId")- set(attributes["url.path"], attributes["RequestPath"]) where attributes["RequestPath"] != nil- delete_key(attributes, "RequestPath")- set(attributes["code.function.name"], attributes["ActionName"]) where attributes["ActionName"] != nil- delete_key(attributes, "ActionName")# Drop attributes that are redundant with trace context or internal to# ASP.NET Core- delete_key(attributes, "RequestId")- delete_key(attributes, "ConnectionId")- delete_key(attributes, "ActionId")
The statements fall into three categories: promoting process-level metadata to
resource attributes with their semantic convention names, renaming per-event
attributes to their OTel equivalents, and dropping attributes that are either
redundant with trace context (RequestId) or internal to ASP.NET Core's MVC
pipeline (ConnectionId, ActionId).
Once you wire these statements into your pipeline:
1234567# otelcol.yamlservice:pipelines:logs:receivers: [otlp]processors: [transform/message_template, transform/normalize]exporters: [debug]
If you run the application again and check the Collector output, the difference is clear. Enricher attributes have moved to the resource level with OTel-compliant names, and the remaining log attributes follow semantic conventions:
1234567891011121314151617181920212223242026-05-18T11:55:15.280Z info ResourceLog #0Resource SchemaURL: https://opentelemetry.io/schemas/1.13.0Resource attributes:-> service.version: Str(4.2.0)-> deployment.environment.name: Str(development)-> service.name: Str(order-service)-> telemetry.sdk.name: Str(serilog)-> telemetry.sdk.language: Str(dotnet)-> telemetry.sdk.version: Str(4.2.0-main-057a8c1+057a8c1712d1268a4d7f0952819c535e45c56647)-> host.name: Str(falcon)-> process.pid: Int(26451)[...]Body: Str(Processing order {@Order})Attributes:-> Order: Map({"Currency":"USD","Id":123,"Items":["Widget","Gizmo"],"Total":99.99})-> message.rendered: Str(Processing order {"Id":123,"Total":99.99,"Currency":"USD","Items":["Widget","Gizmo"]})-> code.function.name: Str(serilog_app.Controllers.DemoController.GetOrder (serilog-app))-> message_template.text: Str(Processing order {@Order})-> url.path: Str(/demo/order/123)-> thread.id: Int(40)Trace ID: 452ba06a3f6132372fd5f13acfc8b174Span ID: 098dbeb046ded1b7Flags: 0ScopeLogs #1
This works, but keep in mind that it's better to use semantic convention names from the start where possible:
12345678910111213using Serilog.Context;app.Use(async (ctx, next) =>{using (LogContext.PushProperty("url.path", ctx.Request.Path))using (LogContext.PushProperty("client.address",ctx.Connection.RemoteIpAddress?.ToString())){await next();}});
These arrive at the Collector already named correctly, so there's nothing to
transform. The same principle applies when logging from application code. Prefer
user.id over UserId, http.response.status_code over StatusCode, and so
on. The
semantic convention registry
is the reference for available names.
You can't control attribute names from third-party enrichers or ASP.NET Core's
built-in logging, so the transform processor will always have a role for
those. But for properties your own code emits, naming them correctly at the
source means fewer moving parts in your observability pipeline.
Exception handling
When a .NET exception is logged, the OpenTelemetry sink splits it into three
separate attributes following semantic conventions for
exceptions:
exception.type, exception.message, and exception.stacktrace (the full
output of ex.ToString()).
Here's what an unhandled exception looks like in the debug output:
1234567891011121314LogRecord #0ObservedTimestamp: 2026-05-18 07:32:28.8898964 +0000 UTCTimestamp: 2026-05-18 07:32:28.8898964 +0000 UTCSeverityText: ErrorSeverityNumber: Error(17)Body: Str(HTTP {RequestMethod} {RequestPath} responded {StatusCode} in {Elapsed:0.0000} ms)Attributes:-> ExceptionDetail: Map({"HResult":-2146233079,"Message":"An uncaught exception","Source":"serilog-app","TargetSite":"Microsoft.AspNetCore.Mvc.IActionResult CauseError()","Type":"System.InvalidOperationException"})-> exception.message: Str(An uncaught exception)-> exception.type: Str(System.InvalidOperationException)-> exception.stacktrace: Str([...])Trace ID: d77d0d3827116cde8f247494bfdfda78Span ID: 51e74c19a7cab89cFlags: 0
The ExceptionDetail map is from the
Serilog.Exceptions
enricher, which provides structured fields like HResult and TargetSite that
are queryable in your backend. The three exception.* attributes are what the
sink itself produces from the raw exception object.
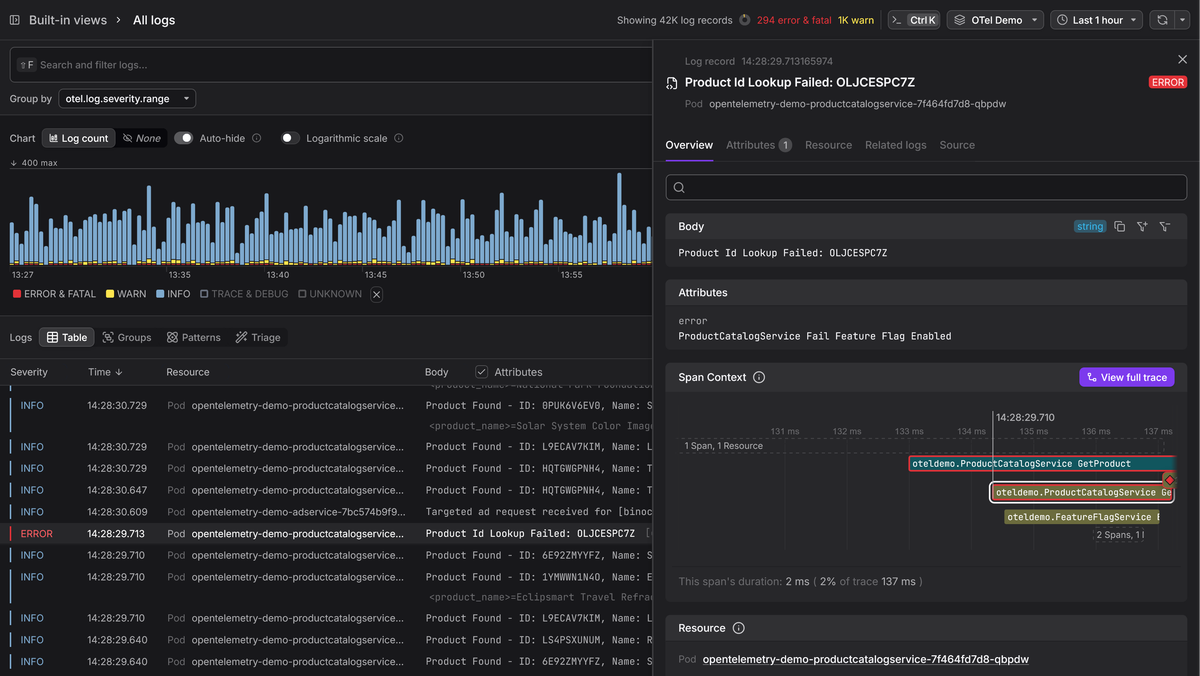
Trace context
The TraceId and SpanId fields at the bottom of each log record are what
allow your backend to link a log entry to the exact span in a distributed trace.
When these are populated, you can click from a trace waterfall into the logs
emitted during that span, or start from a log and navigate to the full request
trace. Without them, logs and traces are separate worlds that you have to
correlate manually by timestamp.
The OTLP sink reads these values from System.Diagnostics.Activity.Current
automatically whenever it processes an event. The IncludedData.TraceIdField
and IncludedData.SpanIdField flags control this behavior and are both enabled
by default.
The question is what creates the Activity in the first place. In ASP.NET Core,
the framework creates one for every incoming HTTP request, so any logs written
during request processing carry trace context with no extra setup.
For every incoming HTTP request, ASP.NET Core automatically:
- Starts a new
Activity. - If the request contains
W3C Trace Context headers
(like
traceparent), it populates theTraceIdandParentSpanIdfrom those headers. - If no headers are present, it generates a new unique
TraceId.
This ensures that you get end-to-end correlation across service boundaries without manual wiring.
If you see all zeros in the trace and span ID fields, it means there was no
active Activity when the log was written likely because the code is running
outside an HTTP request pipeline.
Setting resource attributes
When the IncludedData.SpecRequiredResourceAttributes flag is enabled (which it
is by default), the sink adds service.name (if not supplied),
telemetry.sdk.name, telemetry.sdk.language, and telemetry.sdk.version to
the resource automatically.
It's important to explicitly provide a service.name attribute so that your log
data isn't orphaned in your observability backend under a generic
unknown_service label. You can set it through the OTEL_SERVICE_NAME
environment variable (as we did when
running the demo app) or through
appsettings.json:
12345678910{"Name": "OpenTelemetry","Args": {"endpoint": "http://localhost:4317","protocol": "Grpc","resourceAttributes": {"service.name": "order-service"}}}
It's generally better to prefer environment variables over hardcoding resource
values in appsettings.json:
12345OTEL_SERVICE_NAME=order-service \OTEL_RESOURCE_ATTRIBUTES="\service.version=2.4.1,\deployment.environment.name=production" \dotnet run
The sink also recognizes the
OTEL_EXPORTER_OTLP_*
family of environment variables for endpoint, protocol, and headers. When
present, these override whatever you've set in appsettings.json, which is
usually what you want.
For attributes that you want to derive from build metadata rather than
environment variables (like service.version from the assembly version), you
can set them programmatically:
12345678910111213141516171819builder.Host.UseSerilog((context, services, configuration) =>configuration.ReadFrom.Configuration(context.Configuration).ReadFrom.Services(services).Enrich.FromLogContext().WriteTo.OpenTelemetry(options =>{options.ResourceAttributes =new Dictionary<string, object>{["service.version"] =typeof(Program).Assembly.GetName().Version?.ToString()?? "unknown",};}));
Note that configuring the OTLP sink both in appsettings.json (via
ReadFrom.Configuration) and in code (via WriteTo.OpenTelemetry) creates two
sink instances. If you need to mix JSON config with programmatic resource
attributes, remove the OpenTelemetry entry from the WriteTo array in
appsettings.json and configure the full sink in code.
An alternative to this whole approach is to skip the Serilog enrichers for machine name, and environment metadata entirely, and let the Collector's resourcedetection or k8sattributesprocessor populate those details with the correct semantic convention names from the start.
This is the better option in cloud-native environments because the Collector becomes the single source of truth for infrastructure resource attributes across all services, regardless of what language or logging library each one uses.
Sending .NET logs to Dash0
Once your logs are flowing through the Collector and you've confirmed in the console output that resource attributes, message templates, trace correlation, and semantic conventions all look correct, you're ready to point the pipeline at a real backend.
Dash0 is built natively on the OpenTelemetry data model, so there's no translation layer between what the Collector exports and what Dash0 stores and queries. Add an OTLP exporter to your Collector config pointed at your Dash0 ingress endpoint:
1234567891011121314exporters:debug:verbosity: detailedotlphttp/dash0:endpoint: "https://ingress.eu1.dash0.com"headers:Authorization: "Bearer ${DASH0_AUTH_TOKEN}"service:pipelines:logs:# [...]exporters: [otlphttp/dash0]
This is where everything you've built in this guide starts working together.
Objects you destructured with @ arrive as typed maps, so you can query by
individual fields without parsing strings.
The resource attributes the Collector promoted (host.name, process.pid,
deployment.environment.name) let you scope an investigation to a single
machine, process, or environment in seconds.
And the trace and span IDs the sink attached from System.Diagnostics.Activity
let you click from a log record straight into the trace waterfall that produced
it, and back.
Dash0's Triage takes this further by performing automated comparative analysis across your log (and trace) data, surfacing which attribute values correlate with the group you're investigating.
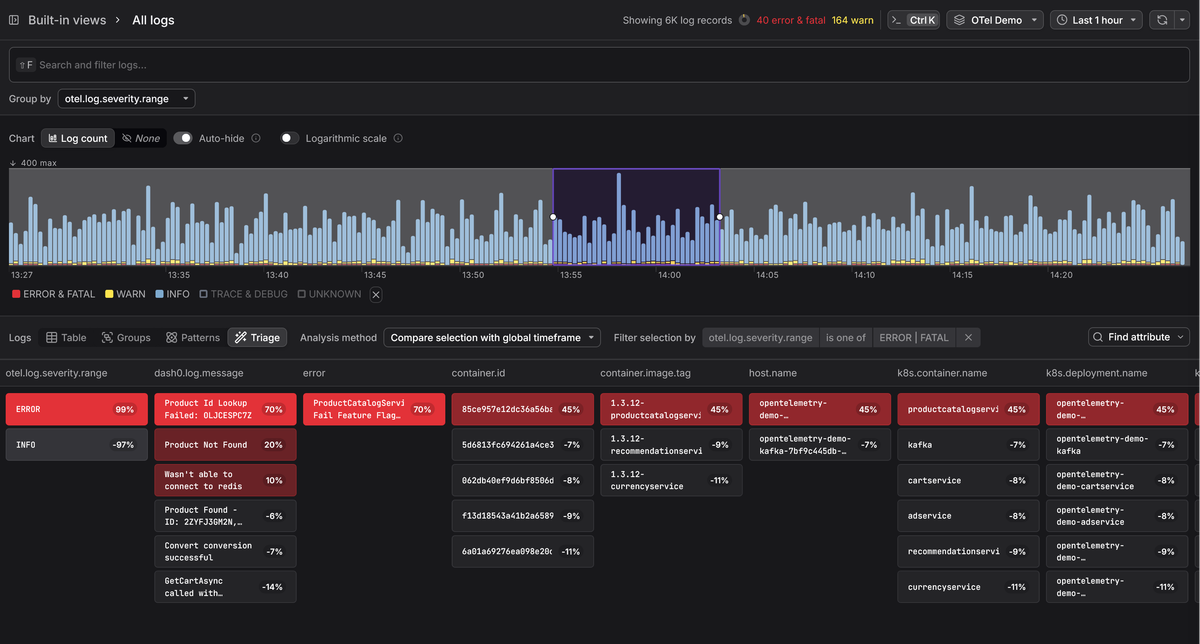
Whether you're looking at error logs versus healthy ones, a spike in a particular time window, or anomalous behavior on a subset of hosts, Triage highlights the distinguishing attributes without you having to guess which dimension to filter by first.
The richer your attributes, the more precisely it can pinpoint what's different, which is exactly why we spent the preceding sections getting attribute names, types, and placement right.
Final thoughts
The Serilog.Sinks.OpenTelemetry package bridges the gap between Serilog's
ergonomic logging API and the OTel ecosystem without pulling in heavy SDK
dependencies.
Once it's configured in appsettings.json, every structured event you emit
through ILogger<T> or Log.Information(...) flows into your observability
pipeline as a first-class OTel log record, with trace context, typed attributes,
and resource metadata attached.
For more on the Serilog fundamentals that feed into this pipeline, see our Serilog guide. For the Collector side of things, our Collector guide and OTLP receiver walkthrough cover the receiving end in detail. And if you're interested in how OpenTelemetry logging works at the protocol level, we have a deep dive on that too.
