Last updated: July 7, 2026
Logging in Express.js with Pino (Complete Guide)
HTTP services have specific logging needs that console.log() can't meet. You
need to know which request produced a log line, what the response status was,
how long it took, and when something breaks, enough context to reconstruct what
happened. Without
structured JSON logging, you get
none of that.
This guide covers logging in Express.js with
Pino: structured
JSON output, HTTP request logging, per-request context propagation with
AsyncLocalStorage, error handling, file output, and connecting your logs to
the rest of your observability pipeline so they correlate with traces and
metrics across your services.
Setting up Pino logger in an Express app
Install Pino and Express if you haven't already:
1npm install express pino
Then create a base logger you can share across your application:
1234567891011// logger.jsimport pino from "pino";export const logger = pino({level: process.env.LOG_LEVEL || "info",formatters: {level(label) {return { level: label };},},});
Two things worth calling out here. Setting the
log level from an environment
variable means you can drop it to debug in staging without touching code. And
the formatters.level override changes the default numeric level values (like
30 for info) to their string equivalents, making them much easier to work with
when you're searching logs downstream.
Import it into your application module:
123456789101112131415// app.jsimport express from "express";import { logger } from "./logger.js";const app = express();app.use(express.json());app.get("/", (req, res) => {logger.info("handling root request");res.json({ status: "ok" });});app.listen(3000, () => {logger.info("server listening on port 3000");});
Running this and hitting the endpoint gives you clean structured output:
123{"level":"info","time":1781170543796,"pid":317380,"hostname":"falcon","msg":"server listening on port 3000"}{"level":"info","time":1781170570778,"pid":317380,"hostname":"falcon","msg":"handling root request"}
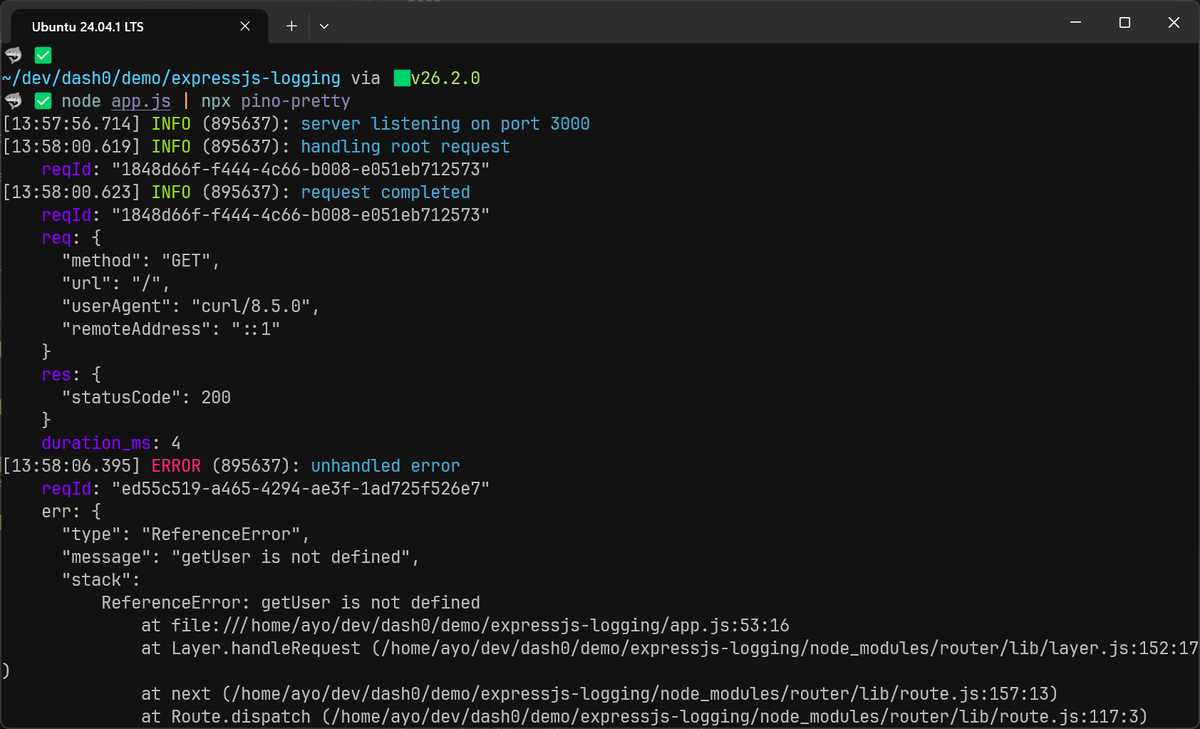
During development, that JSON output could be harder to read at a glance. To make it more human-readable, install pino-pretty as a dev dependency and pipe your output through it:
1npm install --save-dev pino-pretty
1node app.js | npx pino-pretty
Logging HTTP requests with pino-http
The most common need in an Express app is logging relevant details about incoming requests such as HTTP method, path, status code, and how long it took. pino-http is the HTTP logging middleware for Pino, and it covers all of this out of the box:
1npm install pino-http
Pass your existing logger to it so it shares the same configuration, then register it before any routes:
12345// app.jsimport pinoHttp from "pino-http";import { logger } from "./logger.js";app.use(pinoHttp({ logger }));
That one line logs every request and response automatically. Here's what the
output looks like for a successful GET:
12345678910111213141516171819202122232425262728293031{"level": "info","time": 1781172220147,"pid": 394008,"hostname": "falcon","req": {"id": 1,"method": "GET","url": "/","query": {},"params": {},"headers": {"host": "localhost:3000","user-agent": "curl/8.5.0","accept": "*/*"},"remoteAddress": "::1","remotePort": 45408},"res": {"statusCode": 200,"headers": {"x-powered-by": "Express","content-type": "application/json; charset=utf-8","content-length": "15","etag": "W/\"f-VaSQ4oDUiZblZNAEkkN+sX+q3Sg\""}},"responseTime": 4,"msg": "request completed"}
pino-http also attaches a req.log and res.log child logger to the handler
request and response objects. By default it carries the full request bindings
(method, URL, headers, remote address) into every log line your route handlers
emit:
1234app.get("/", (req, res) => {req.log.info("handling root request");res.json({ status: "ok" });});
123456789101112131415161718192021{"level": "info","time": 1781172338651,"pid": 397612,"hostname": "falcon","req": {"id": 1,"method": "GET","url": "/","query": {},"params": {},"headers": {"host": "localhost:3000","user-agent": "curl/8.5.0","accept": "*/*"},"remoteAddress": "::1","remotePort": 59062},"msg": "handling root request"}
That's useful context, but it can make mid-request logs noisy when pino-http
is already writing a complete request/response log line for you.
The quietReqLogger option fixes this. When set to true, req.log only
carries the request ID, so your business-logic logs stay lean while the
auto-logged request and response entries still include the full bindings:
123456app.use(pinoHttp({logger,quietReqLogger: true,}),);
With this in place, a req.log.info() call inside a route handler produces a
tight log entry:
12345678{"level": "info","time": 1781172385779,"pid": 402173,"hostname": "falcon","reqId": 1,"msg": "handling root request"}
While the auto-logged response entry that pino-http writes at the end of the
request still contains the full picture.
This way, you get the structured HTTP log you need for observability, without repeating the full request context on every single mid-request log line.
Customizing the request logs
By default, pino-http assigns each request a sequential integer ID starting
at 1. That works fine in development but is unsuitable for production since
integers reset on every restart and aren't unique across multiple instances.
Use genReqId to generate a proper UUID, and propagate the X-Request-ID
header if the upstream caller already provided one.
1234567891011import { randomUUID } from "node:crypto";app.use(pinoHttp({logger,quietReqLogger: true,genReqId(req) {return req.headers["x-request-id"] || randomUUID();},}),);
You will see the updated reqId field:
12345678{"level": "info","time": 1781173967691,"pid": 479593,"hostname": "falcon","reqId": "62c1e701-2241-4214-ac64-e869eb573795","msg": "handling root request"}
That said, request IDs are only workaround for the absence of
distributed tracing.
Once you instrument your Express app with
OpenTelemetry,
every log line emitted inside an active trace automatically carries trace_id
and span_id, which are globally unique, propagate across service boundaries,
and let you jump directly from a log entry to the trace that produced it.
Shaping log output with serializers
pino-http uses its own default serializers for the req and res objects.
Out of the box, the request entry contains the following fields:
12345678910111213141516171819202122232425{"req": {"id": 1,"method": "GET","url": "/","query": {},"params": {},"headers": {"host": "localhost:3000","user-agent": "curl/8.5.0","accept": "*/*"},"remoteAddress": "::1","remotePort": 51518},"res": {"statusCode": 200,"headers": {"x-powered-by": "Express","content-type": "application/json; charset=utf-8","content-length": "15","etag": "W/\"f-VaSQ4oDUiZblZNAEkkN+sX+q3Sg\""}}}
Since headers often contain sensitive information, the default output has a real
problem since req and res headers are automatically included.
While you can use a redact rule to prevent known sensitive fields from leaking into your application logs, it's usually better to use an allowlist instead.
The serializers option lets you replace the defaults entirely. Here's a leaner
version that pulls out the fields that are actually useful and drops the rest:
123456789101112131415161718192021222324app.use(pinoHttp({logger,quietReqLogger: true,genReqId(req) {return req.headers["x-request-id"] || randomUUID();},serializers: {req(req) {return {method: req.method,url: req.url,userAgent: req.headers["user-agent"],remoteAddress: req.remoteAddress,};},res(res) {return {statusCode: res.statusCode,};},},}),);
The output is now compact and free of sensitive headers:
12345678910111213141516{"level": "info","time": 1781177975460,"pid": 668565,"hostname": "falcon","reqId": "4ce357b3-f71e-4b05-af46-63bb5c7bd52d","req": {"method": "GET","url": "/","userAgent": "curl/8.5.0","remoteAddress": "::1"},"res": { "statusCode": 200 },"responseTime": 3,"msg": "request completed"}
If you want to rename responseTime to something more descriptive, use
customAttributeKeys:
12345678910app.use(pinoHttp({customAttributeKeys: {responseTime: "duration_ms",},serializers: {/* as above */},}),);
Controlling log levels per response
The customLogLevel option controls which Pino level a response is logged at,
based on status code or an error. The default logs everything at info, which
means 500 errors don't stand out unless you explicitly promote them:
12345678910app.use(pinoHttp({customLogLevel(req, res, err) {if (res.statusCode >= 500 || err) return "error";if (res.statusCode >= 400) return "warn";return "info";},}),);
One thing req.log doesn't solve on its own: as soon as you call into a helper
function outside the route handler, that context is gone. You either pass
req.log down as a parameter, or you lose the request ID from your logs. That's
the problem we'll solve in the next section.
Maintaining context with AsyncLocalStorage
The req.log child logger works fine inside a route handler, but the moment you
call into a service or utility function, it's gone. The only way to get it back
is to pass it as a parameter and then pass it again to whatever that function
calls. Your business logic ends up with logger arguments that have nothing to do
with what the functions actually do which isn't ideal.
A clean solution is
AsyncLocalStorage
from Node.js's built-in async_hooks module. It lets you store data that
follows the async execution context of a request, without passing it around.
Create a small context module:
12345678910111213// context.jsimport { AsyncLocalStorage } from "node:async_hooks";import { logger } from "./logger.js";const asyncLocalStorage = new AsyncLocalStorage();export function runWithContext(store, fn) {return asyncLocalStorage.run(store, fn);}export function getLogger() {return asyncLocalStorage.getStore()?.get("logger") || logger;}
123456789101112// app.jsimport pinoHttp from "pino-http";import { logger } from "./logger.js";import { runWithContext } from "./context.js";app.use(pinoHttp({ logger }));app.use((req, res, next) => {const store = new Map();store.set("logger", req.log);runWithContext(store, next);});
Because pino-http has already attached a child logger to req.log (including
a request ID), you're just making that same logger available through
AsyncLocalStorage.
Now any function in your codebase can call getLogger() and get the right
logger for the current request, without knowing anything about the request
object or lifecycle:
123456789101112// services/user-service.jsimport { getLogger } from "../context.js";export async function getUser(id) {const log = getLogger();log.info({ userId: id }, "fetching user from database");// your database call herelog.info({ userId: id }, "user fetched successfully");return user;}
Because AsyncLocalStorage tracks the async chain, this works across await
calls. Each concurrent request gets its own isolated store, so request.id in
one request's logs never bleeds into another's. For a deeper look at this
pattern and why it works this way, see the guide on
contextual logging in Node.js.
Handling and logging Express errors
Error logging in Express needs two things: a structured way to capture the error details, and a catch-all error handler that runs after your routes.
In Express 5, rejected promises and thrown errors in async route handlers are
forwarded to your error middleware automatically. You don't need try/catch
blocks or explicit next(err) calls:
1234app.get("/users/:id", async (req, res) => {const user = await getUser(req.params.id); // throws? Express handles itres.json(user);});
If you're still on Express 4, you need the try/catch:
12345678app.get("/users/:id", async (req, res, next) => {try {const user = await getUser(req.params.id);res.json(user);} catch (err) {next(err);}});
Either way, the error lands in your error-handling middleware. Add one at the end of your middleware chain, after all routes:
12345678910app.use((err, req, res, next) => {const log = getLogger();log.error({ err }, "unhandled error");const statusCode = err.statusCode || 500;res.status(statusCode).json({error: err.message || "Internal Server Error",});});
Passing an Error object under the err key lets Pino serialize the message,
name, and stack trace as structured fields. You can then search logs by error
type or message without grepping through stack trace strings.
12345678910111213{"level": "error","time": 1781178915027,"pid": 715025,"hostname": "falcon","reqId": "3b96a6b5-5151-4cac-b06b-7c4848f18c12","err": {"type": "Error","message": "fetching user failed","stack": "Error: fetching user failed <truncated>"},"msg": "unhandled error"}
Catching uncaught exceptions
Some errors slip past try/catch blocks. You should handle these too, otherwise
Node.js will crash without logging anything useful:
123456789process.on("uncaughtException", (err) => {logger.fatal({ err }, "uncaught exception, shutting down");process.exit(1);});process.on("unhandledRejection", (reason) => {logger.fatal({ err: reason }, "unhandled promise rejection");process.exit(1);});
Call these before app.listen(). Using the fatal level here is intentional
since an uncaught exception means something went badly wrong, and you want that
to stand out in your observability tool.
The one case you can't protect against is SIGKILL, where the OS terminates the
process immediately. If you're debugging why a fatal log from a crashed pod
never arrived, that's usually why.
Logging to a file
In containerized environments, you typically want your logs to go to stdout
and let your infrastructure handle collecting and routing. But if you need to
persist your logs to a file, Pino's
pino/file transport
handles this without blocking the event loop:
123456789101112131415161718import pino from "pino";const transport = pino.transport({target: "pino/file",options: { destination: "./logs/app.log", mkdir: true },});export const logger = pino({level: process.env.LOG_LEVEL || "info",formatters: {level(label) {return { level: label };},},},transport,);
The transport runs in a worker thread, keeping file I/O off the main event loop. For high-throughput Express apps, blocking on disk writes adds latency you don't want.
If you want logs going to both the file and stdout at the same time, use
pino.transport with multiple targets:
123456789101112const transport = pino.transport({targets: [{target: "pino/file",options: { destination: "./logs/app.log", mkdir: true },},{target: "pino/file",options: { destination: 1 }, // stdout},],});
Since pino/file does not support log rotation, ensure something like
pino-roll or a system-level utility
like logrotate is
used.
Sending logs to an observability backend
Logging JSON to stdout is fine up to a point. But once you have more than one instance of your service, you'll want your logs centralized somewhere you can search, alert, and correlate them with traces and metrics.
The recommended way to get there is OpenTelemetry (OTel), which keeps you off proprietary agents and gives you a standard pipeline that works with any backend.
The recommended approach for Pino is
@opentelemetry/instrumentation-pino,
which does two things: it injects the active trace_id and span_id into every
log entry (log correlation), and it forwards your logs to the OTel Logs SDK (log
sending). It's included in the
@opentelemetry/auto-instrumentations-node
bundle alongside instrumentations for Express, HTTP, and several other Node.js
libraries, so you typically don't need to install it separately.
To get started, install the API and auto-instrumentation bundle:
12npm install @opentelemetry/api \@opentelemetry/auto-instrumentations-node
The SDK picks up its configuration entirely from environment variables, which means no code changes are needed. The three you'll always set are:
-
OTEL_SERVICE_NAMEidentifies your service. This must always be set so that your logs, traces, and metrics are grouped under the right service name in your observability backend. Without it, the SDK defaults tounknown_service:node, which is useless when you're trying to filter signals in a busy system. -
OTEL_EXPORTER_OTLP_ENDPOINTis the base URL of your OpenTelemetry collector instance or observability backend. Port4318is the standard HTTP/protobuf port; port4317is gRPC. -
OTEL_EXPORTER_OTLP_HEADERScan be used to set an API key or Bearer token here if your backend requires one.
For example, to send all your telemetry data to Dash0, you can use the following command:
123456NODE_OPTIONS="--experimental-loader=@opentelemetry/instrumentation/hook.mjs \--import @opentelemetry/auto-instrumentations-node/register" \OTEL_SERVICE_NAME=my-express-app \OTEL_EXPORTER_OTLP_ENDPOINT=https://ingress.eu-west-1.aws.dash0.com \OTEL_EXPORTER_OTLP_HEADERS="Authorization=Bearer <your-token>" \node app.js
Your existing logger.js and all the Pino configuration covered earlier in this
guide stays exactly as it is. The instrumentation patches Pino at load time, so
trace_id, span_id, and trace_flags are automatically injected into every
log entry fired inside an active
span.
As long as your Dash0 Bearer token is valid (retrievable through the Auth Tokens page in your organization settings), you'll start seeing your logs, traces, and metrics in the Dash0 interface:
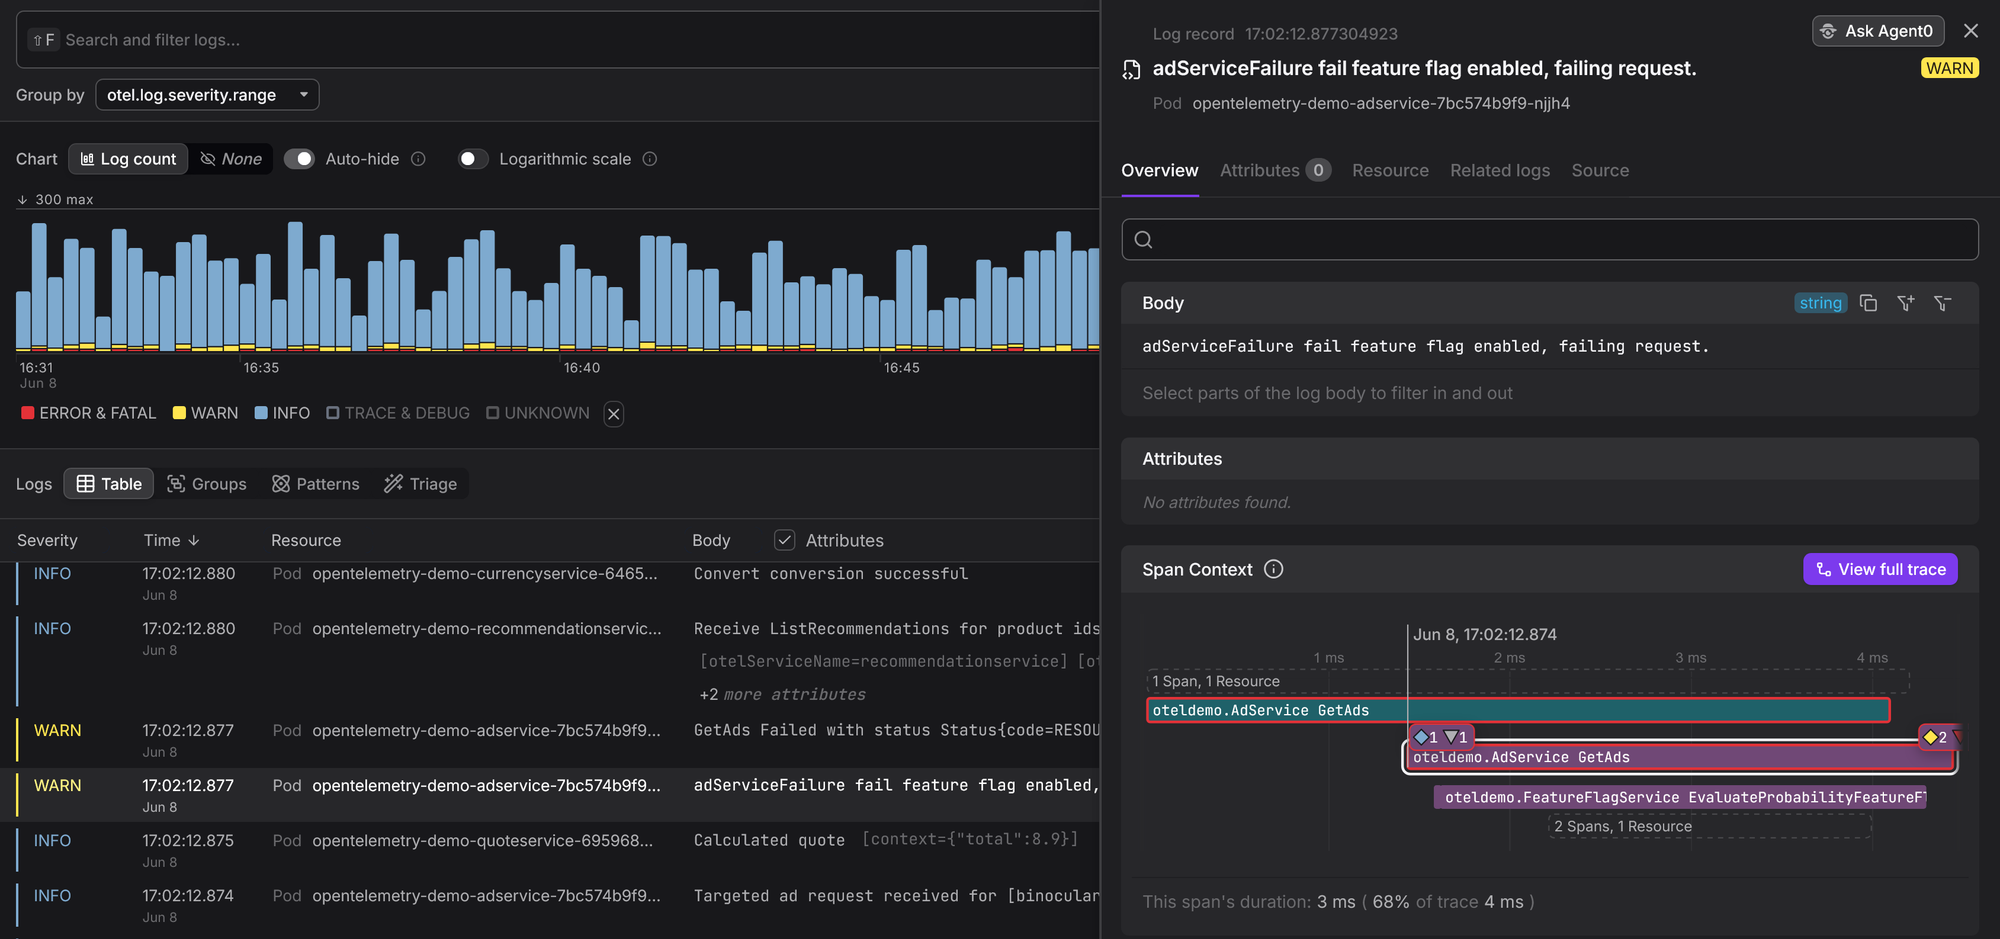
That's how you get correlated logs and traces in your observability without adding any instrumentation code to your routes.
Final thoughts
The jump from console.log() to a production-grade logging setup in Express
doesn't require a lot of code, but it does require getting a few things right
from the start.
The patterns in this guide should cover most of what you'll need: structured
JSON output with Pino, request logging middleware, per-request context through
AsyncLocalStorage, structured error handling, file output when you need it,
and an OTel pipeline when you're ready to correlate logs with the rest of your
telemetry.
If you want to go deeper on Pino itself, the
production Pino guide
covers serializers, redaction, and transport configuration in more detail. For
the AsyncLocalStorage pattern, the
contextual logging guide
walks through it end to end.
Once your logs are flowing, Dash0 gives you a place to search, correlate, and alert on them alongside your traces and metrics. It's free to try for 14 days, no credit card required.
