Last updated: February 24, 2026
Kubernetes Node Not Ready Error and How to Fix It
What Is the Kubernetes Node Not Ready Error?
The Node Not Ready error in Kubernetes indicates a situation where a node within a Kubernetes cluster is not in a healthy state to accept pods for execution. This status is a crucial indicator for cluster administrators, as it signifies that the Kubernetes scheduler will not assign new pods to the affected node until it returns to a Ready state.
To quickly check if any of your nodes are experiencing the Node Not Ready error, run this kubectl command:
1kubectl get nodes
The output will list all the nodes in your cluster along with their statuses.
For example, in the following output, you can see that node2 has a
Node Not Ready error:
1234NAME STATUS ROLES AGE VERSIONnode1 Ready <none> 18d v1.20.4node2 NotReady <none> 12d v1.20.4node3 Ready <none> 20d v1.20.4
Nodes may enter a Not Ready state for a variety of reasons, ranging from network issues, resource exhaustion, misconfigurations, or underlying hardware problems. Understanding and resolving the root cause of this error is essential to maintain the operational efficiency and reliability of a Kubernetes cluster.
Understanding Node States in Kubernetes
In Kubernetes, node states are critical for managing the cluster’s health and workload distribution. Nodes can be in one of several states, reflecting their current status and ability to accept workloads:
- A node in the Ready state is healthy and capable of accepting new pods.
- A node in the Not Ready state has encountered an issue that prevents it from functioning correctly.
- The Unknown state indicates that the Kubernetes master has lost communication with the node, and its status cannot be determined.
Diagnosing the Kubernetes Node Not Ready Error
To determine if a node is experiencing a Node Not Ready error, and obtain the information necessary to solve the problem, follow these steps:
1. Checking Node State
The first step is to check the state of the nodes in the cluster. This can be
done using the kubectl get nodes command, which lists all nodes and their
statuses. A node marked as NotReady requires further investigation to
understand the underlying issues.
2. Obtaining Node Details
The kubectl describe node <node-name> command provides comprehensive details
about the node, including its conditions, events, and configuration. This
information is useful for diagnosing the root cause of the Not Ready status,
offering insights into any errors or warnings that the node might be
experiencing. Analyzing the output of this command helps pinpoint specific
issues, guiding the troubleshooting and resolution processes.
Here’s a simplified example of the output for a node experiencing issues:
123456789101112131415161718Name: node2Roles: <none>Labels: beta.kubernetes.io/os=linuxAnnotations: node.alpha.kubernetes.io/ttl=0CreationTimestamp: Thu, 12 Aug 2021 12:00:00 +0000Conditions:Type Status LastHeartbeatTime LastTransitionTime Reason Message---- ------ ----------------- ------------------ ------ -------MemoryPressure False Thu, 12 Aug 2021 12:30:00 +0000 Thu, 12 Aug 2021 12:00:00 +0000 KubeletHasSufficientMemory kubelet has sufficient memory availableDiskPressure False Thu, 12 Aug 2021 12:30:00 +0000 Thu, 12 Aug 2021 12:00:00 +0000 KubeletHasNoDiskPressure kubelet has no disk pressurePIDPressure False Thu, 12 Aug 2021 12:30:00 +0000 Thu, 12 Aug 2021 12:00:00 +0000 KubeletHasSufficientPID kubelet has sufficient PID availableReady False Thu, 12 Aug 2021 12:30:00 +0000 Thu, 12 Aug 2021 12:20:00 +0000 KubeletNotReady PLEG is not healthy: pleg was last seen active 3m0s ago; threshold is 3m0sEvents:Type Reason Age From Message---- ------ ---- ---- -------Normal Starting 12m kubelet, node2 Starting kubelet.Warning NodeNotReady 3m kubelet, node2 Node node2 status is now: NodeNotReadyWarning ContainerdStartFail 2m kubelet, node2 Failed to start container runtime: Error
Here are a few things to notice in the output, which could indicate the cause of the problem:
- Conditions section: This section lists various node health indicators. In
our example, the conditions
MemoryPressureandDiskPressureare false, indicating this is not the problem. However, the message PLEG is not healthy indicates the Pod Lifecycle Event Generator (PLEG), which monitors the lifecycle events of the containers in the pod, is not functioning correctly. - Events section: This section records significant events in the life of the
node. Here, you see a
NodeNotReadywarning, which is our primary concern. TheContainerdStartFailevent indicates that the container runtime failed tos start, which could be the reason why PLEG is not healthy.
3. Checking System Logs
Logs from the kubelet, the primary component running on each node that
communicates with the Kubernetes master, can provide insights into any errors or
issues it is encountering.
You can access kubelet logs using journalctl or other logging utilities
depending on the node’s operating system:
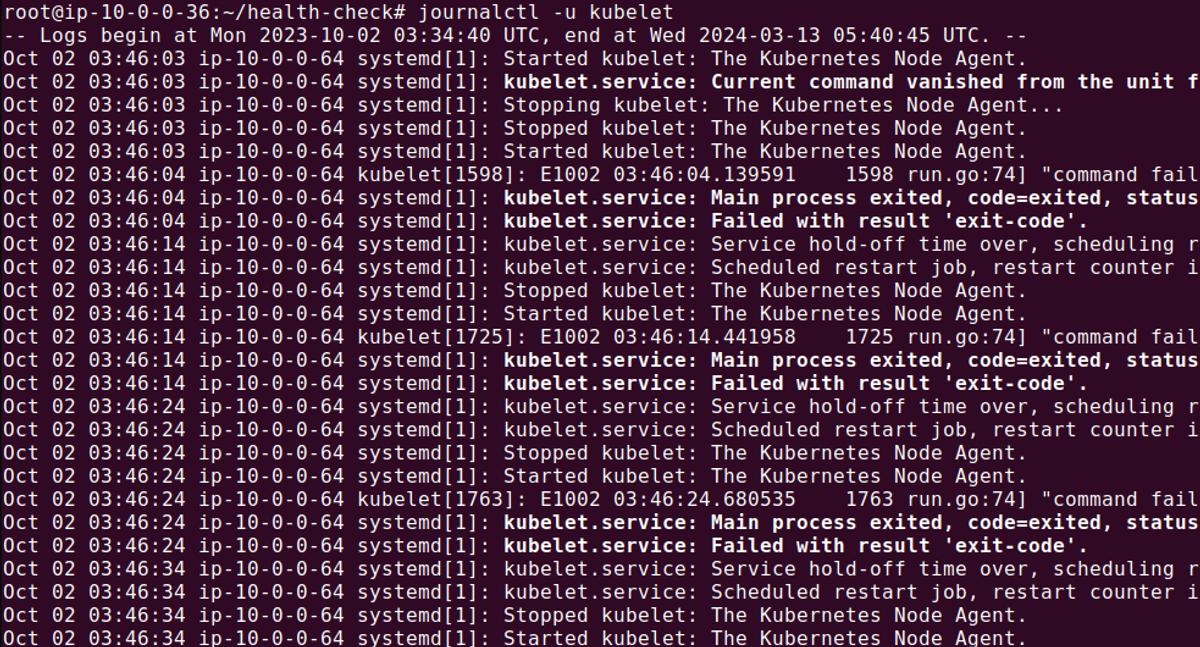
Reviewing these logs can reveal issues related to resource constraints, network
problems, or errors in the kubelet itself, offering clues to the underlying
cause of the Not Ready status.
Possible Causes of the Node Not Ready Error and How to Troubleshoot Them
There are several conditions that can result in a node having a Not Ready status.
Scarcity of Resources
One common cause of the Node Not Ready error is the scarcity of resources, such as CPU or memory exhaustion. Monitoring resource usage can help identify if this is the cause. The following commands can be used to check resource allocations and usage on a node:
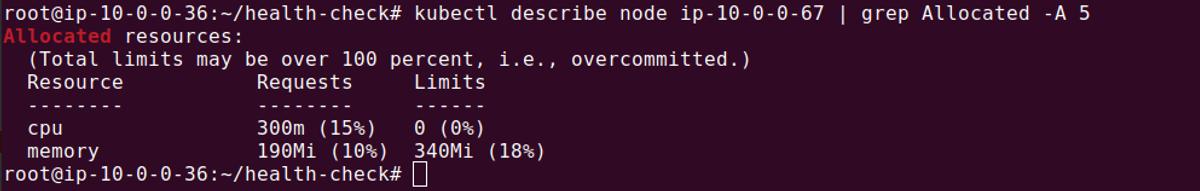
This command displays the amount of CPU and memory resources allocated and used by the pods running on the node. If the node is over-allocated, consider scaling down workloads or adding more nodes to the cluster.
Here is another command you can use to show the current CPU and memory usage of the node, helping to identify if resource scarcity is impacting the node’s readiness:
1kubectl top node <node-name>
Network Misconfiguration
Checking network settings and connectivity is crucial for investigating Node Not Ready errors.
For example, this command checks connectivity to the Kubernetes master node, ensuring the affected node can communicate with the rest of the cluster:
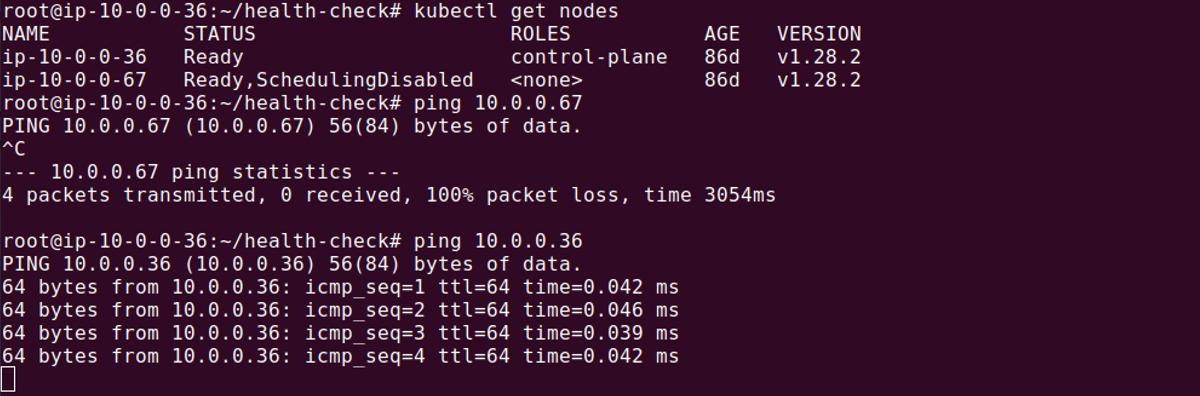
This command traces the path packets take to reach the master node, helping to identify any network hops that may be causing delays or connectivity issues.
1traceroute <master-node-ip>

Issues with the kubelet Process
Restarting the kubelet might resolve some issues in the kubelet process. The
command to restart the kubelet varies depending on the system manager in use.
In a Linux system, the command is typically:
1sudo systemctl restart kubelet
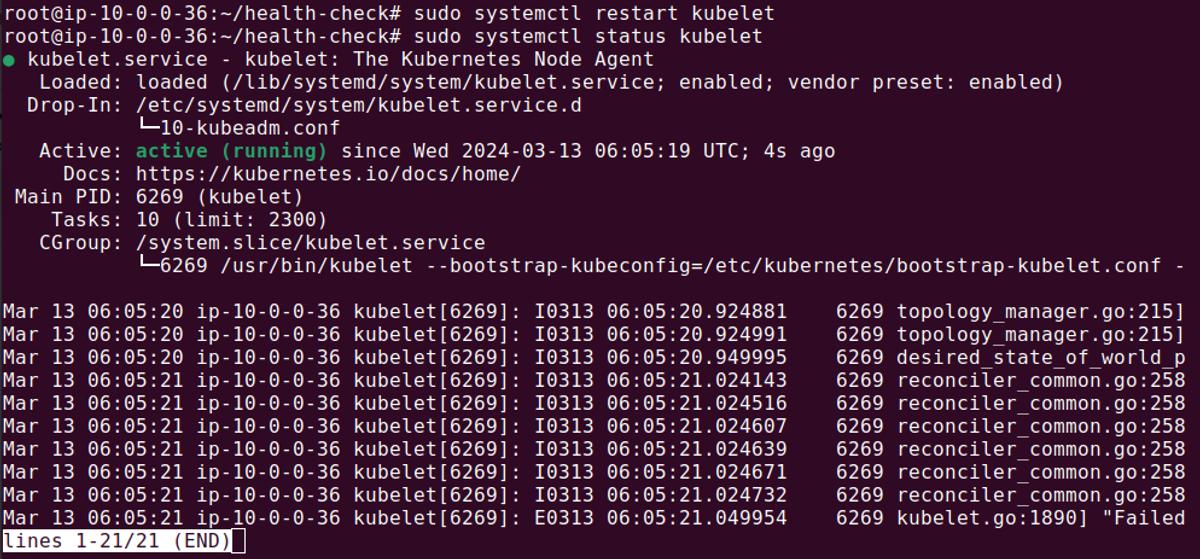
This command restarts the kubelet service, potentially resolving issues that
prevent the node from reaching a Ready state.
Issues with kube-proxy
Issues with kube-proxy, the network proxy running on each node, can also
affect node readiness. Checking the status of kube-proxy and restarting it if
necessary can help:
1sudo systemctl status kube-proxy
This command checks the status of the kube-proxy service. If it’s not running
as expected, it can be restarted with:
1sudo systemctl restart kube-proxy
Restarting kube-proxy can resolve network-related issues affecting the node’s
ability to communicate with the cluster, potentially resolving the Not Ready
error.
Kubernetes troubleshooting with Dash0
Dash0 is a troubleshooting platform, purpose-built for microservice-based applications. Developers using Kubernetes to orchestrate their containerized applications can use Dash0 to monitor, trace and troubleshoot issues fast. Deployed with zero-code changes and automated in one-click, Dash0 stitches together every interaction between micro and managed service into end-to-end stack traces. These traces, served alongside request payload data, give developers complete visibility into their container environments. Using Dash0, developers get:
- End-to-end virtual stack traces across every micro and managed service that makes up a serverless application, in context
- API visibility that makes all the data passed between services available and accessible, making it possible to perform root cause analysis without digging through logs
- Distributed tracing that is deployed with no code and automated in one click
- Unified platform to explore and query across microservices, see a real-time view of applications, and optimize performance
To try Dash0 for Kubernetes, check out our Kubernetes operator on GitHub.
