
Spot and fix problems faster
Seamless backend correlation reveals how backend issues impact the frontend. From user session to root cause in one view.
Dash0 acquires Polar Signals

From your web frontend to your backend services, from Kubernetes infrastructure to your AI agents. Dash0 gives you full visibility across your entire production environment. In minutes, not months.
Start for free or Book a demo


Seamless backend correlation reveals how backend issues impact the frontend. From user session to root cause in one view.
Instantly see service KPIs, detect bottlenecks, and analyze failures with fully correlated telemetry. Triage spots anomalies at scale before they reach your users.
From custom views to logs, metrics, and traces across your entire infrastructure stack.
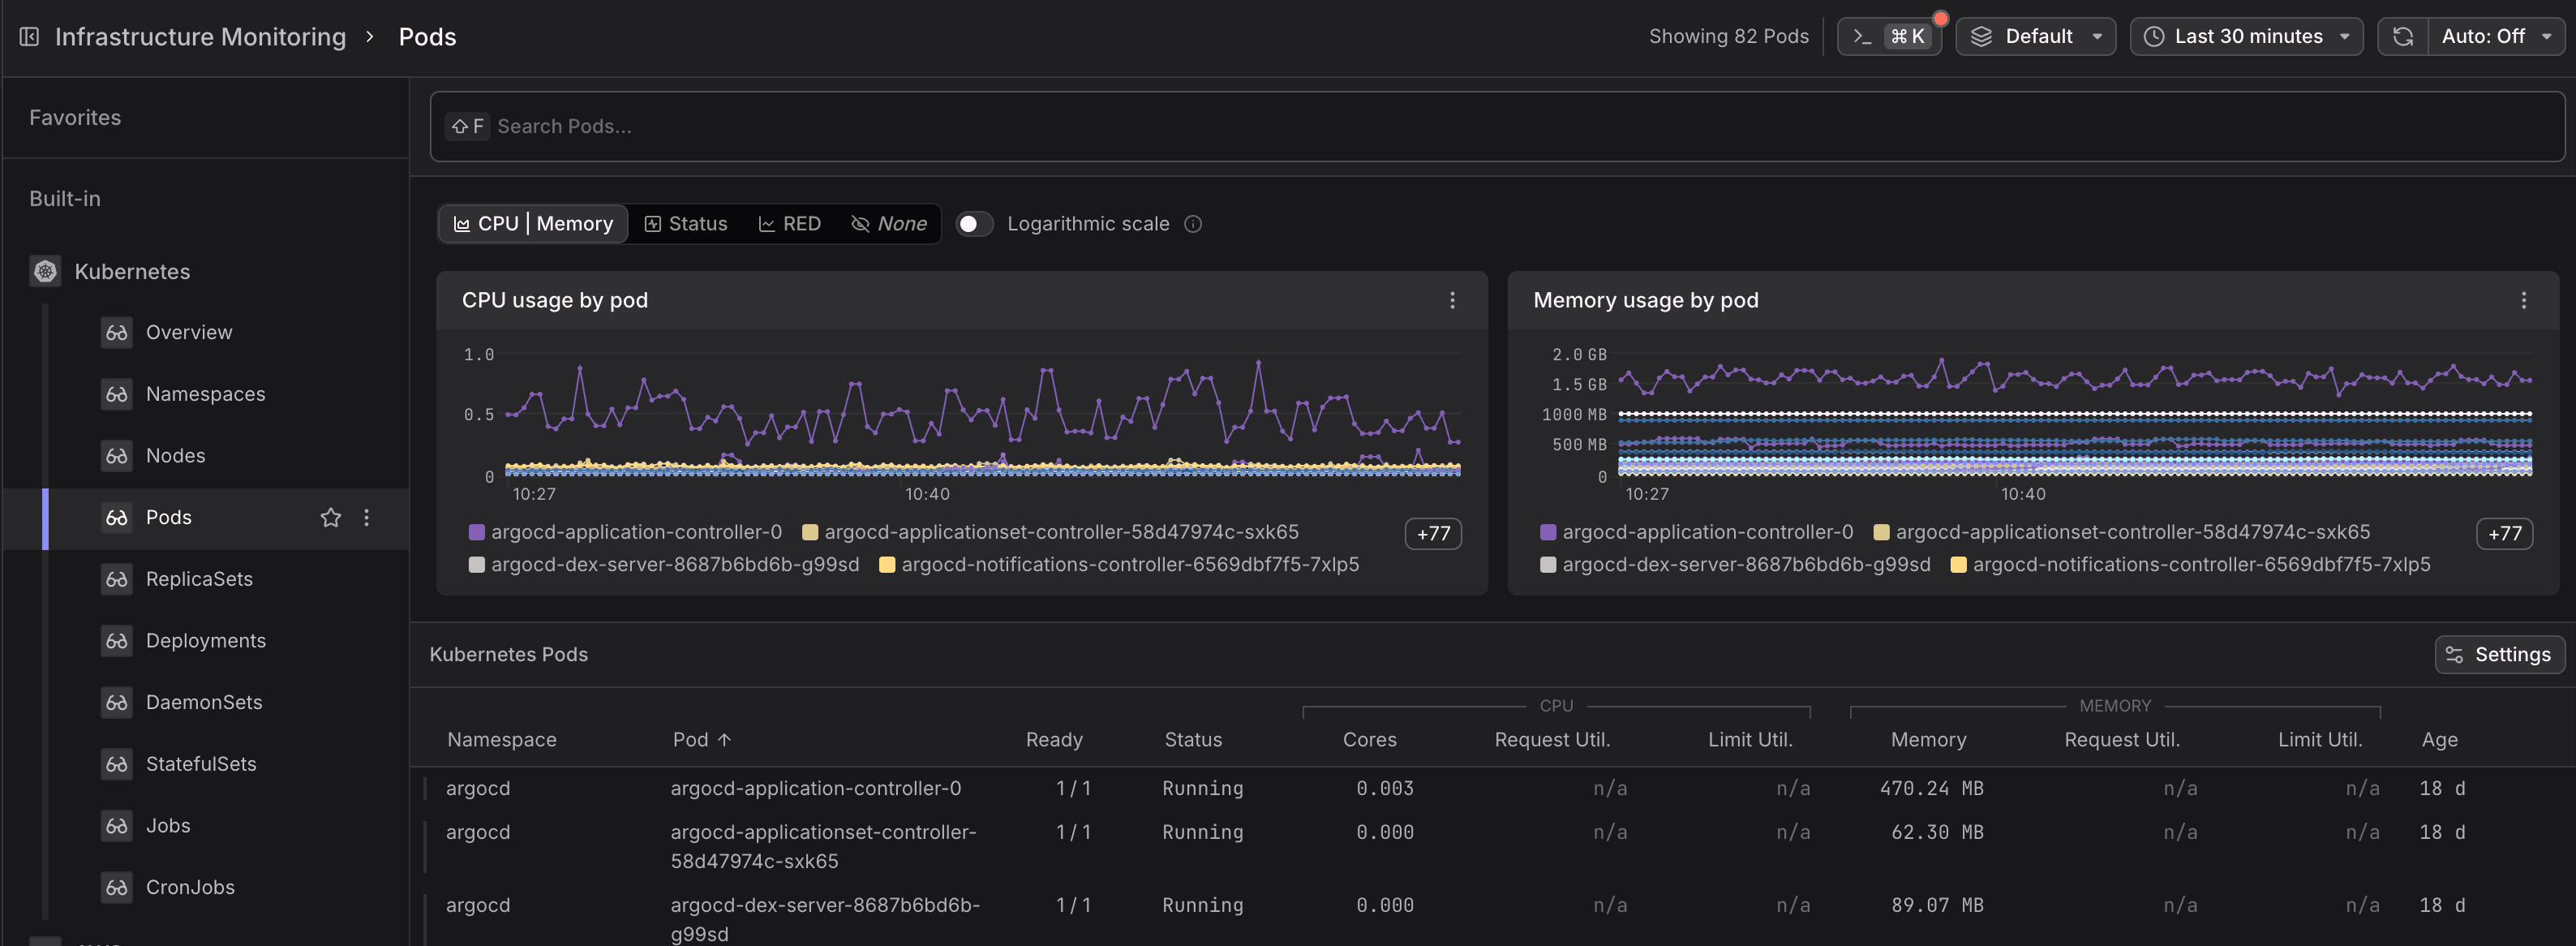
From your web frontend to applications to infrastructure.
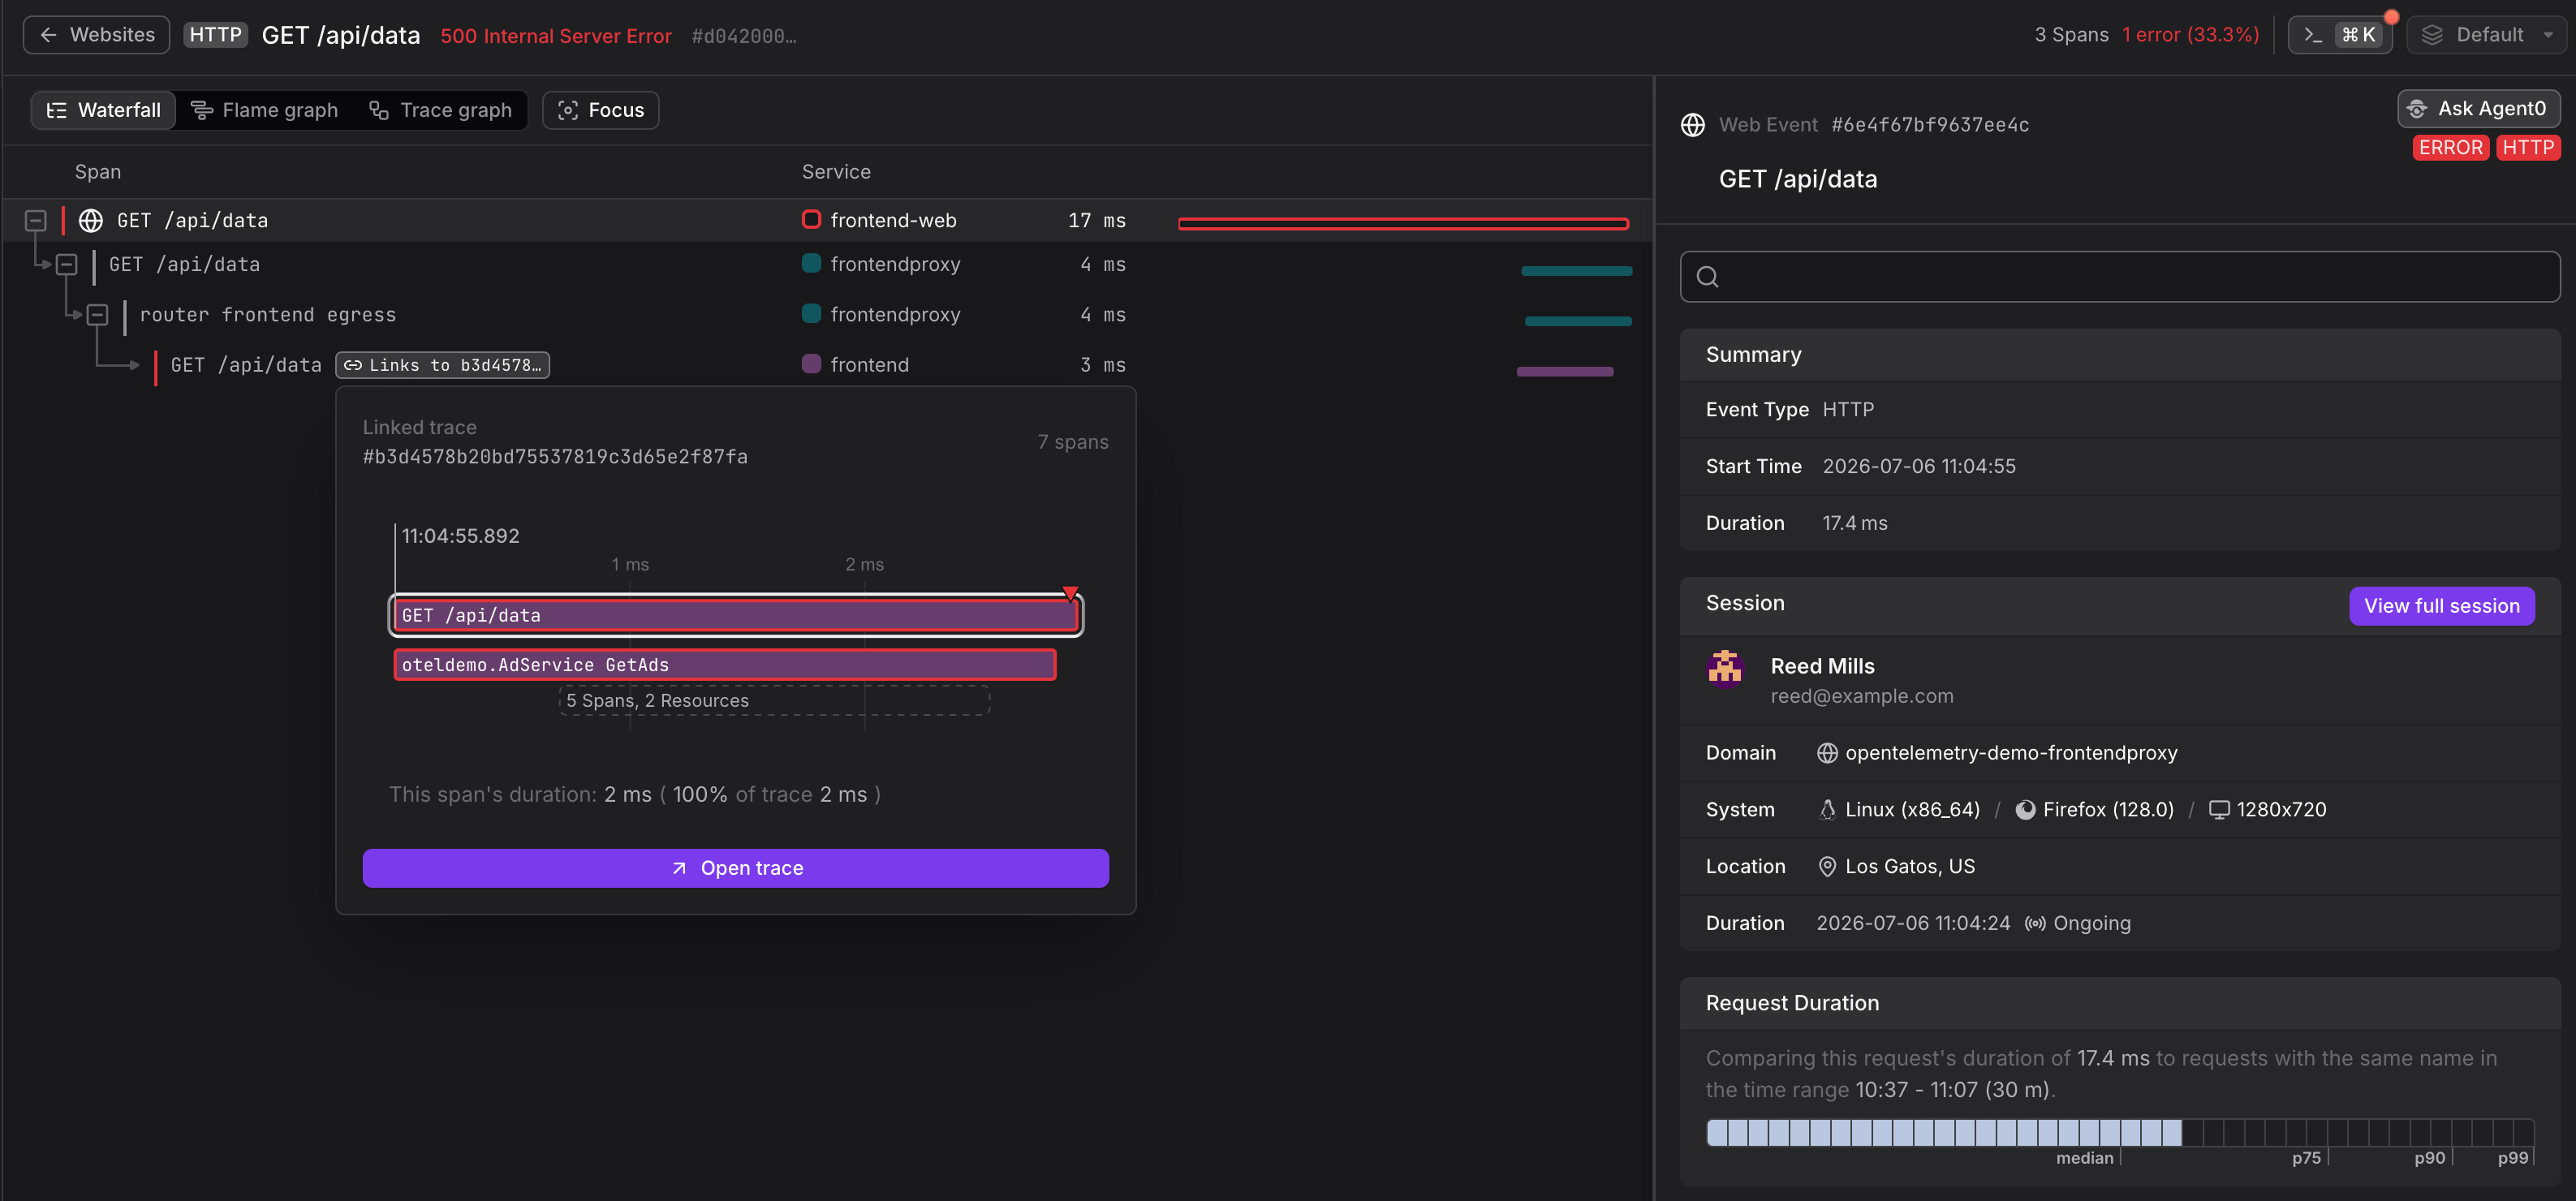
Dash0 captures the full user experience: web vitals, user sessions, errors, and page performance. When a page is slow or a checkout fails, you see exactly why, from the browser request all the way to the database query.
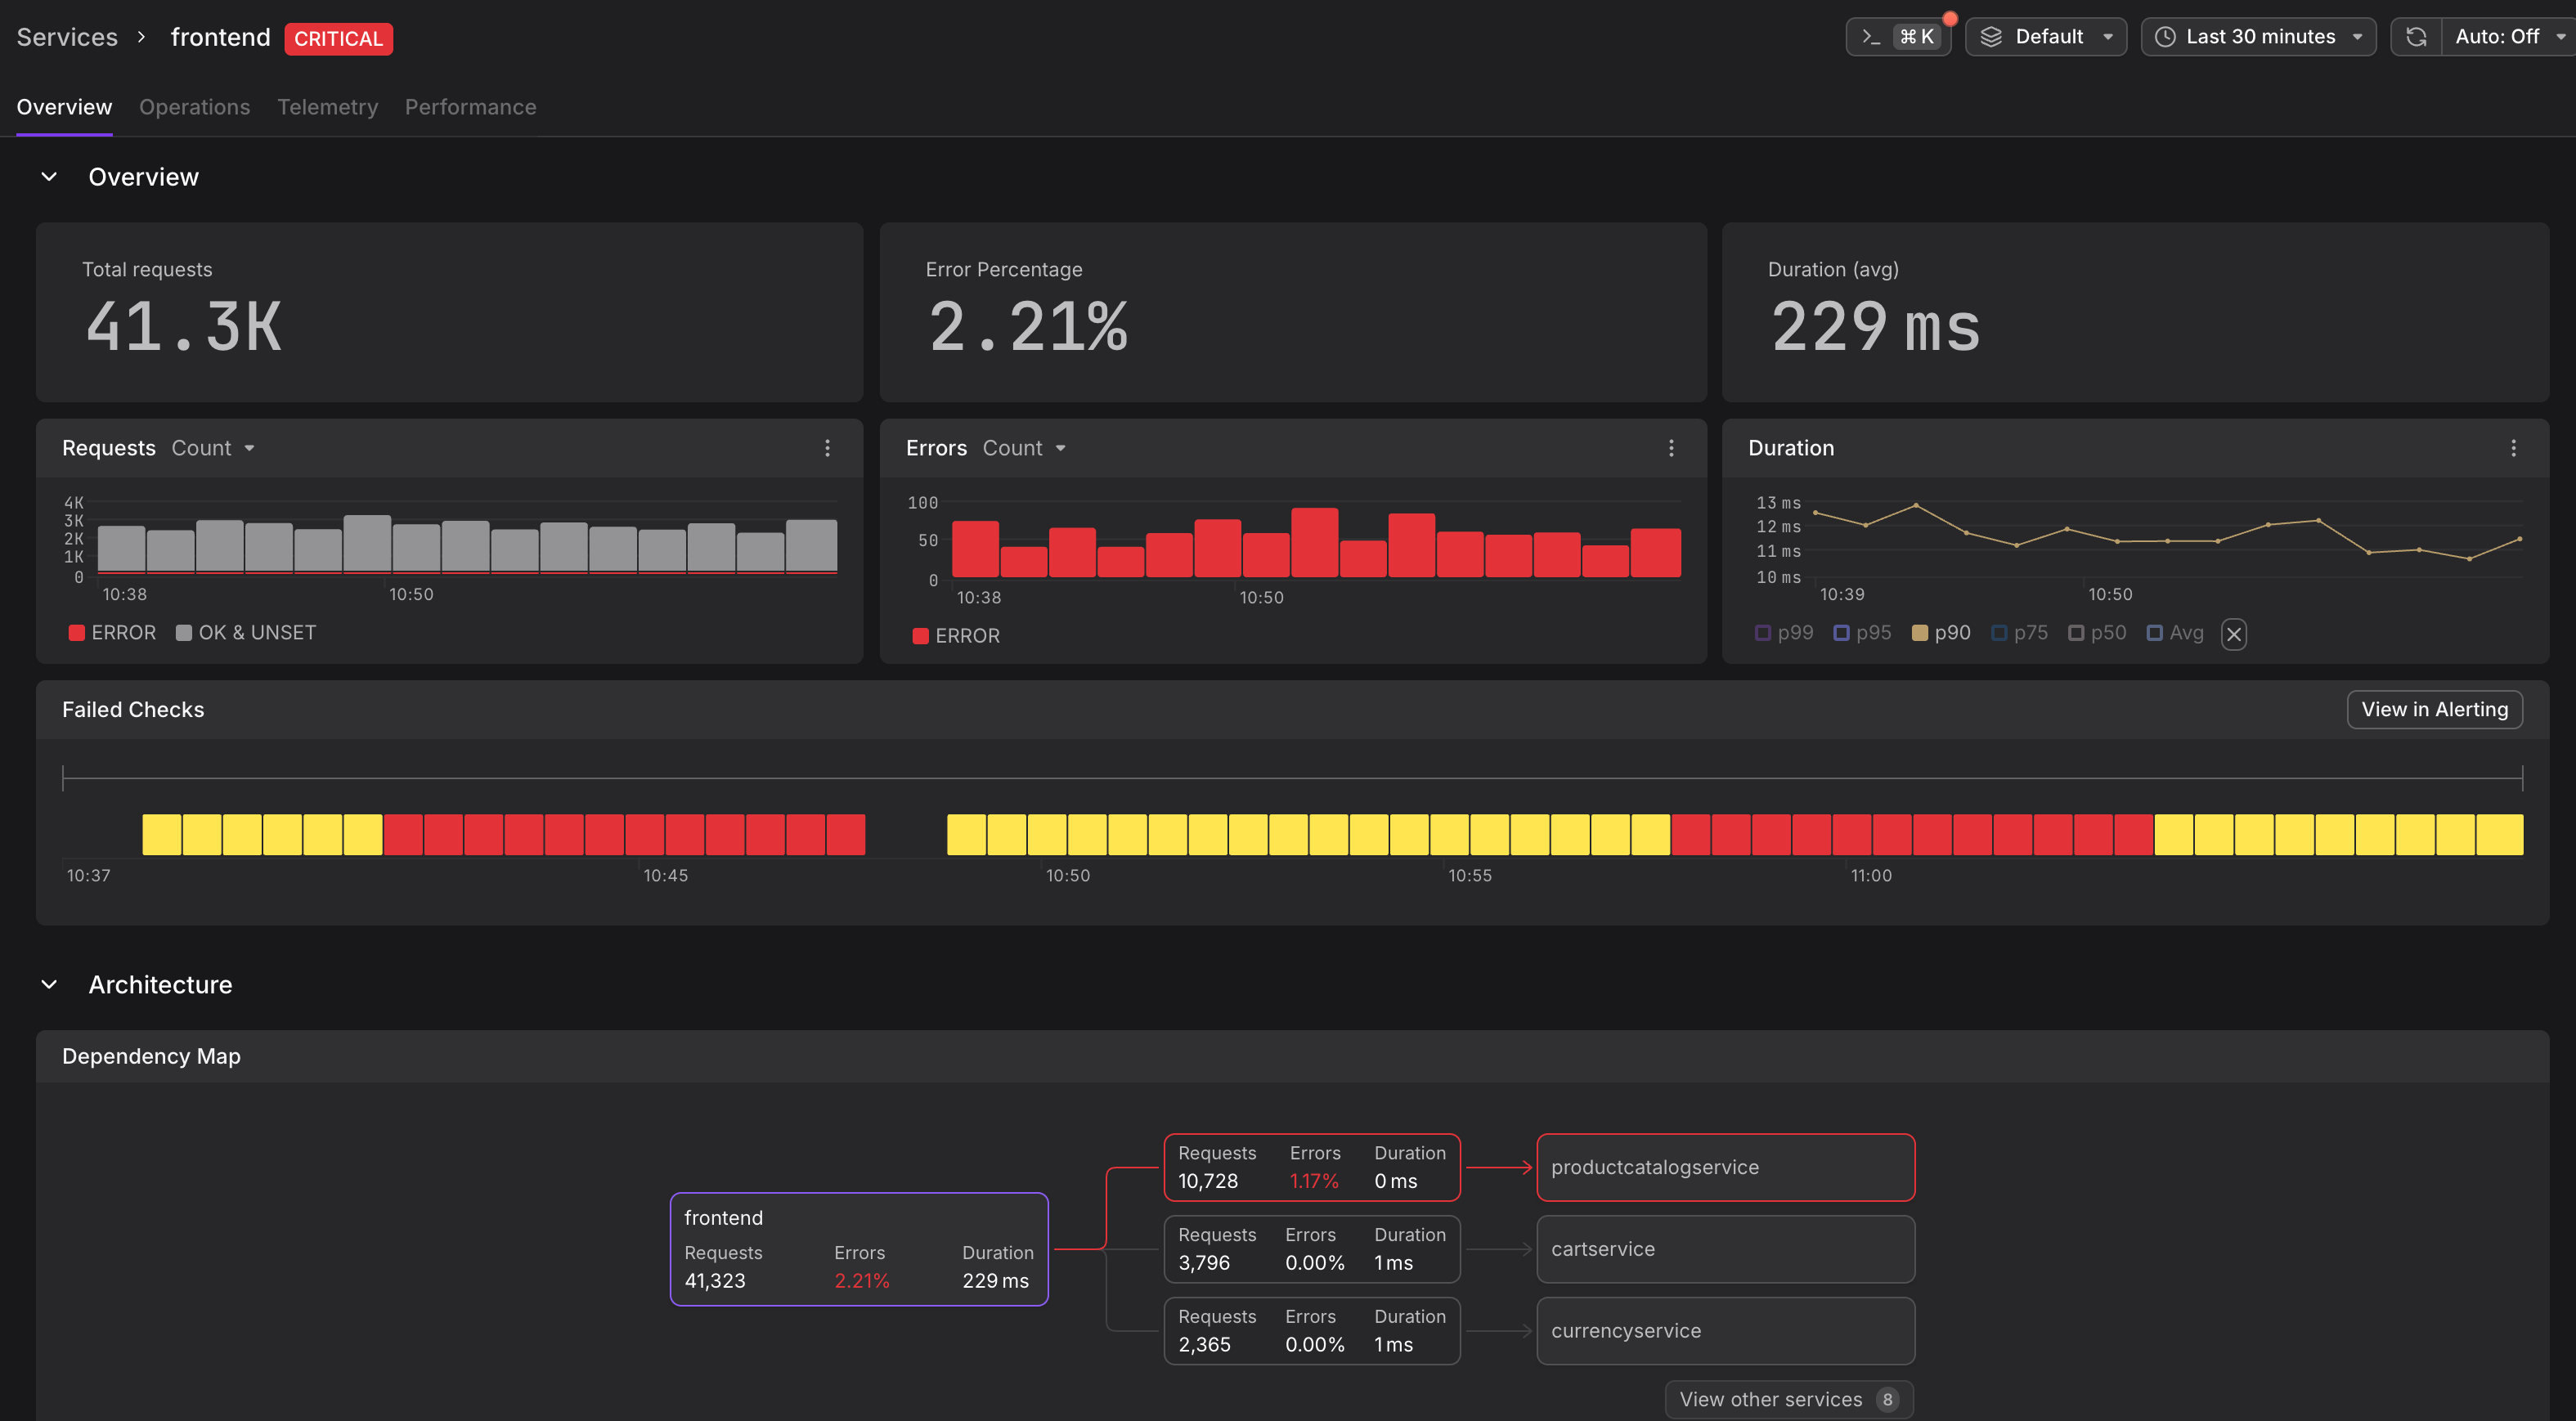
Dash0 turns your OpenTelemetry data into powerful APM insights. No extra setup needed. Instantly see service KPIs, detect bottlenecks, and analyze failures with fully correlated telemetry.
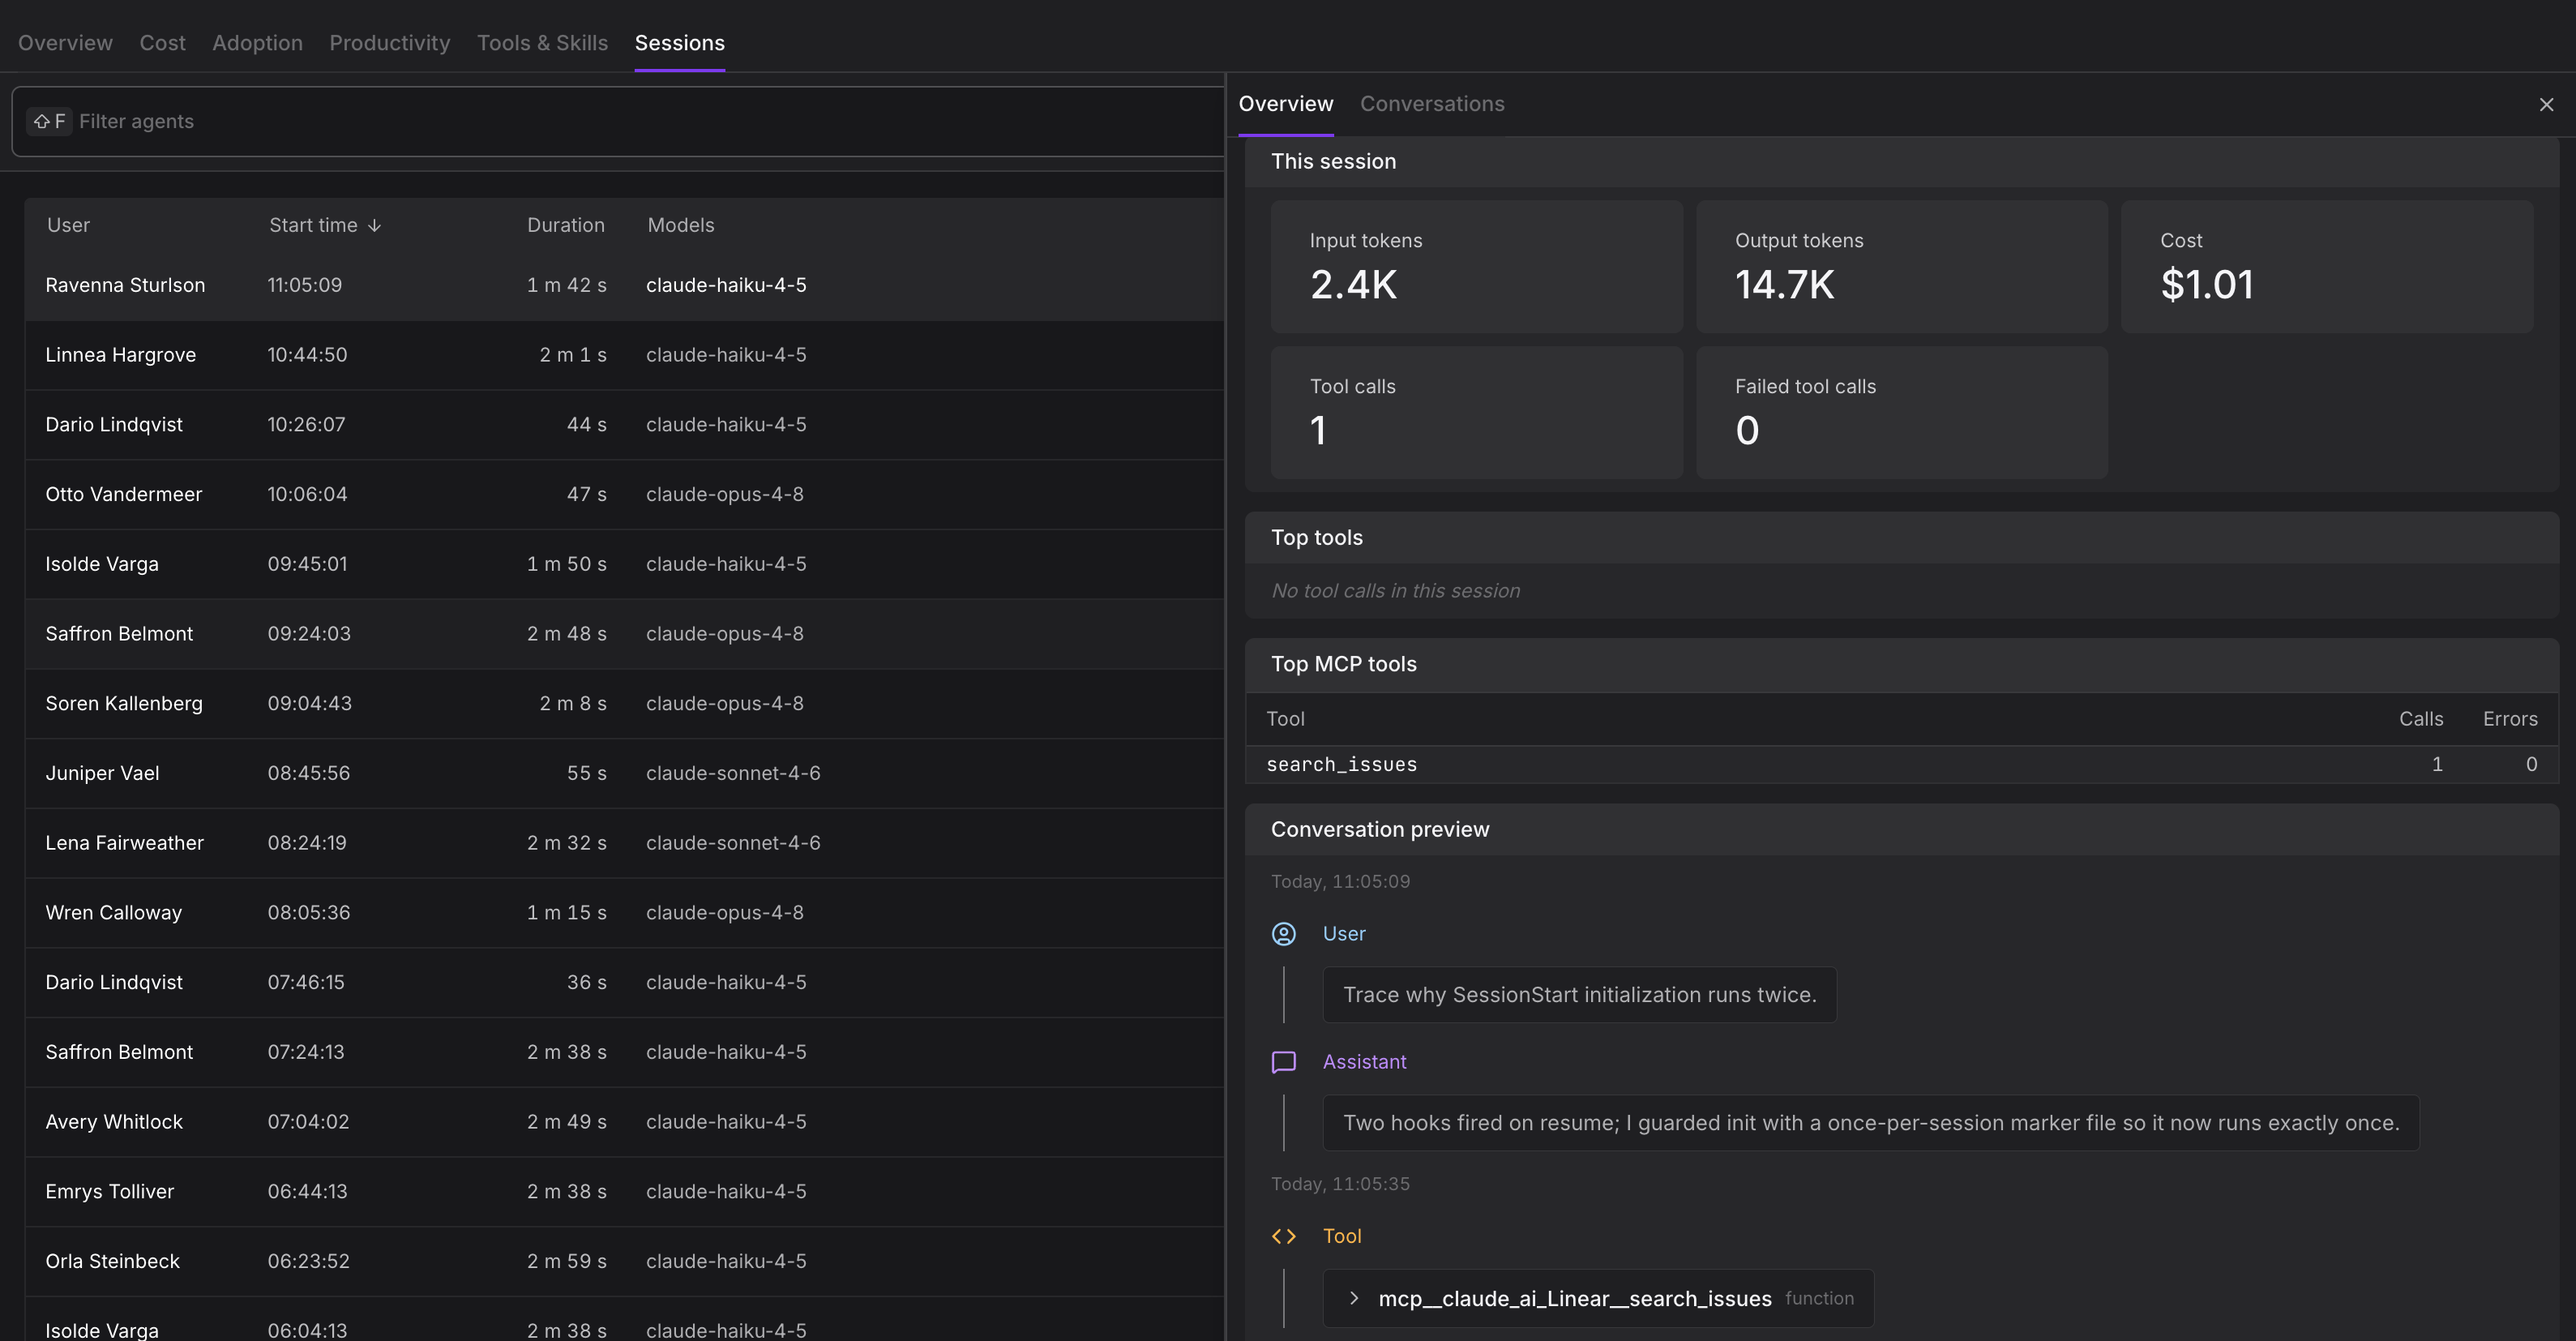
Your systems are increasingly powered by LLMs and autonomous agents. Dash0 gives you visibility into every AI call: token usage, latency, costs, and errors. Multi-step agent traces show you every tool call, handoff, and reasoning step.
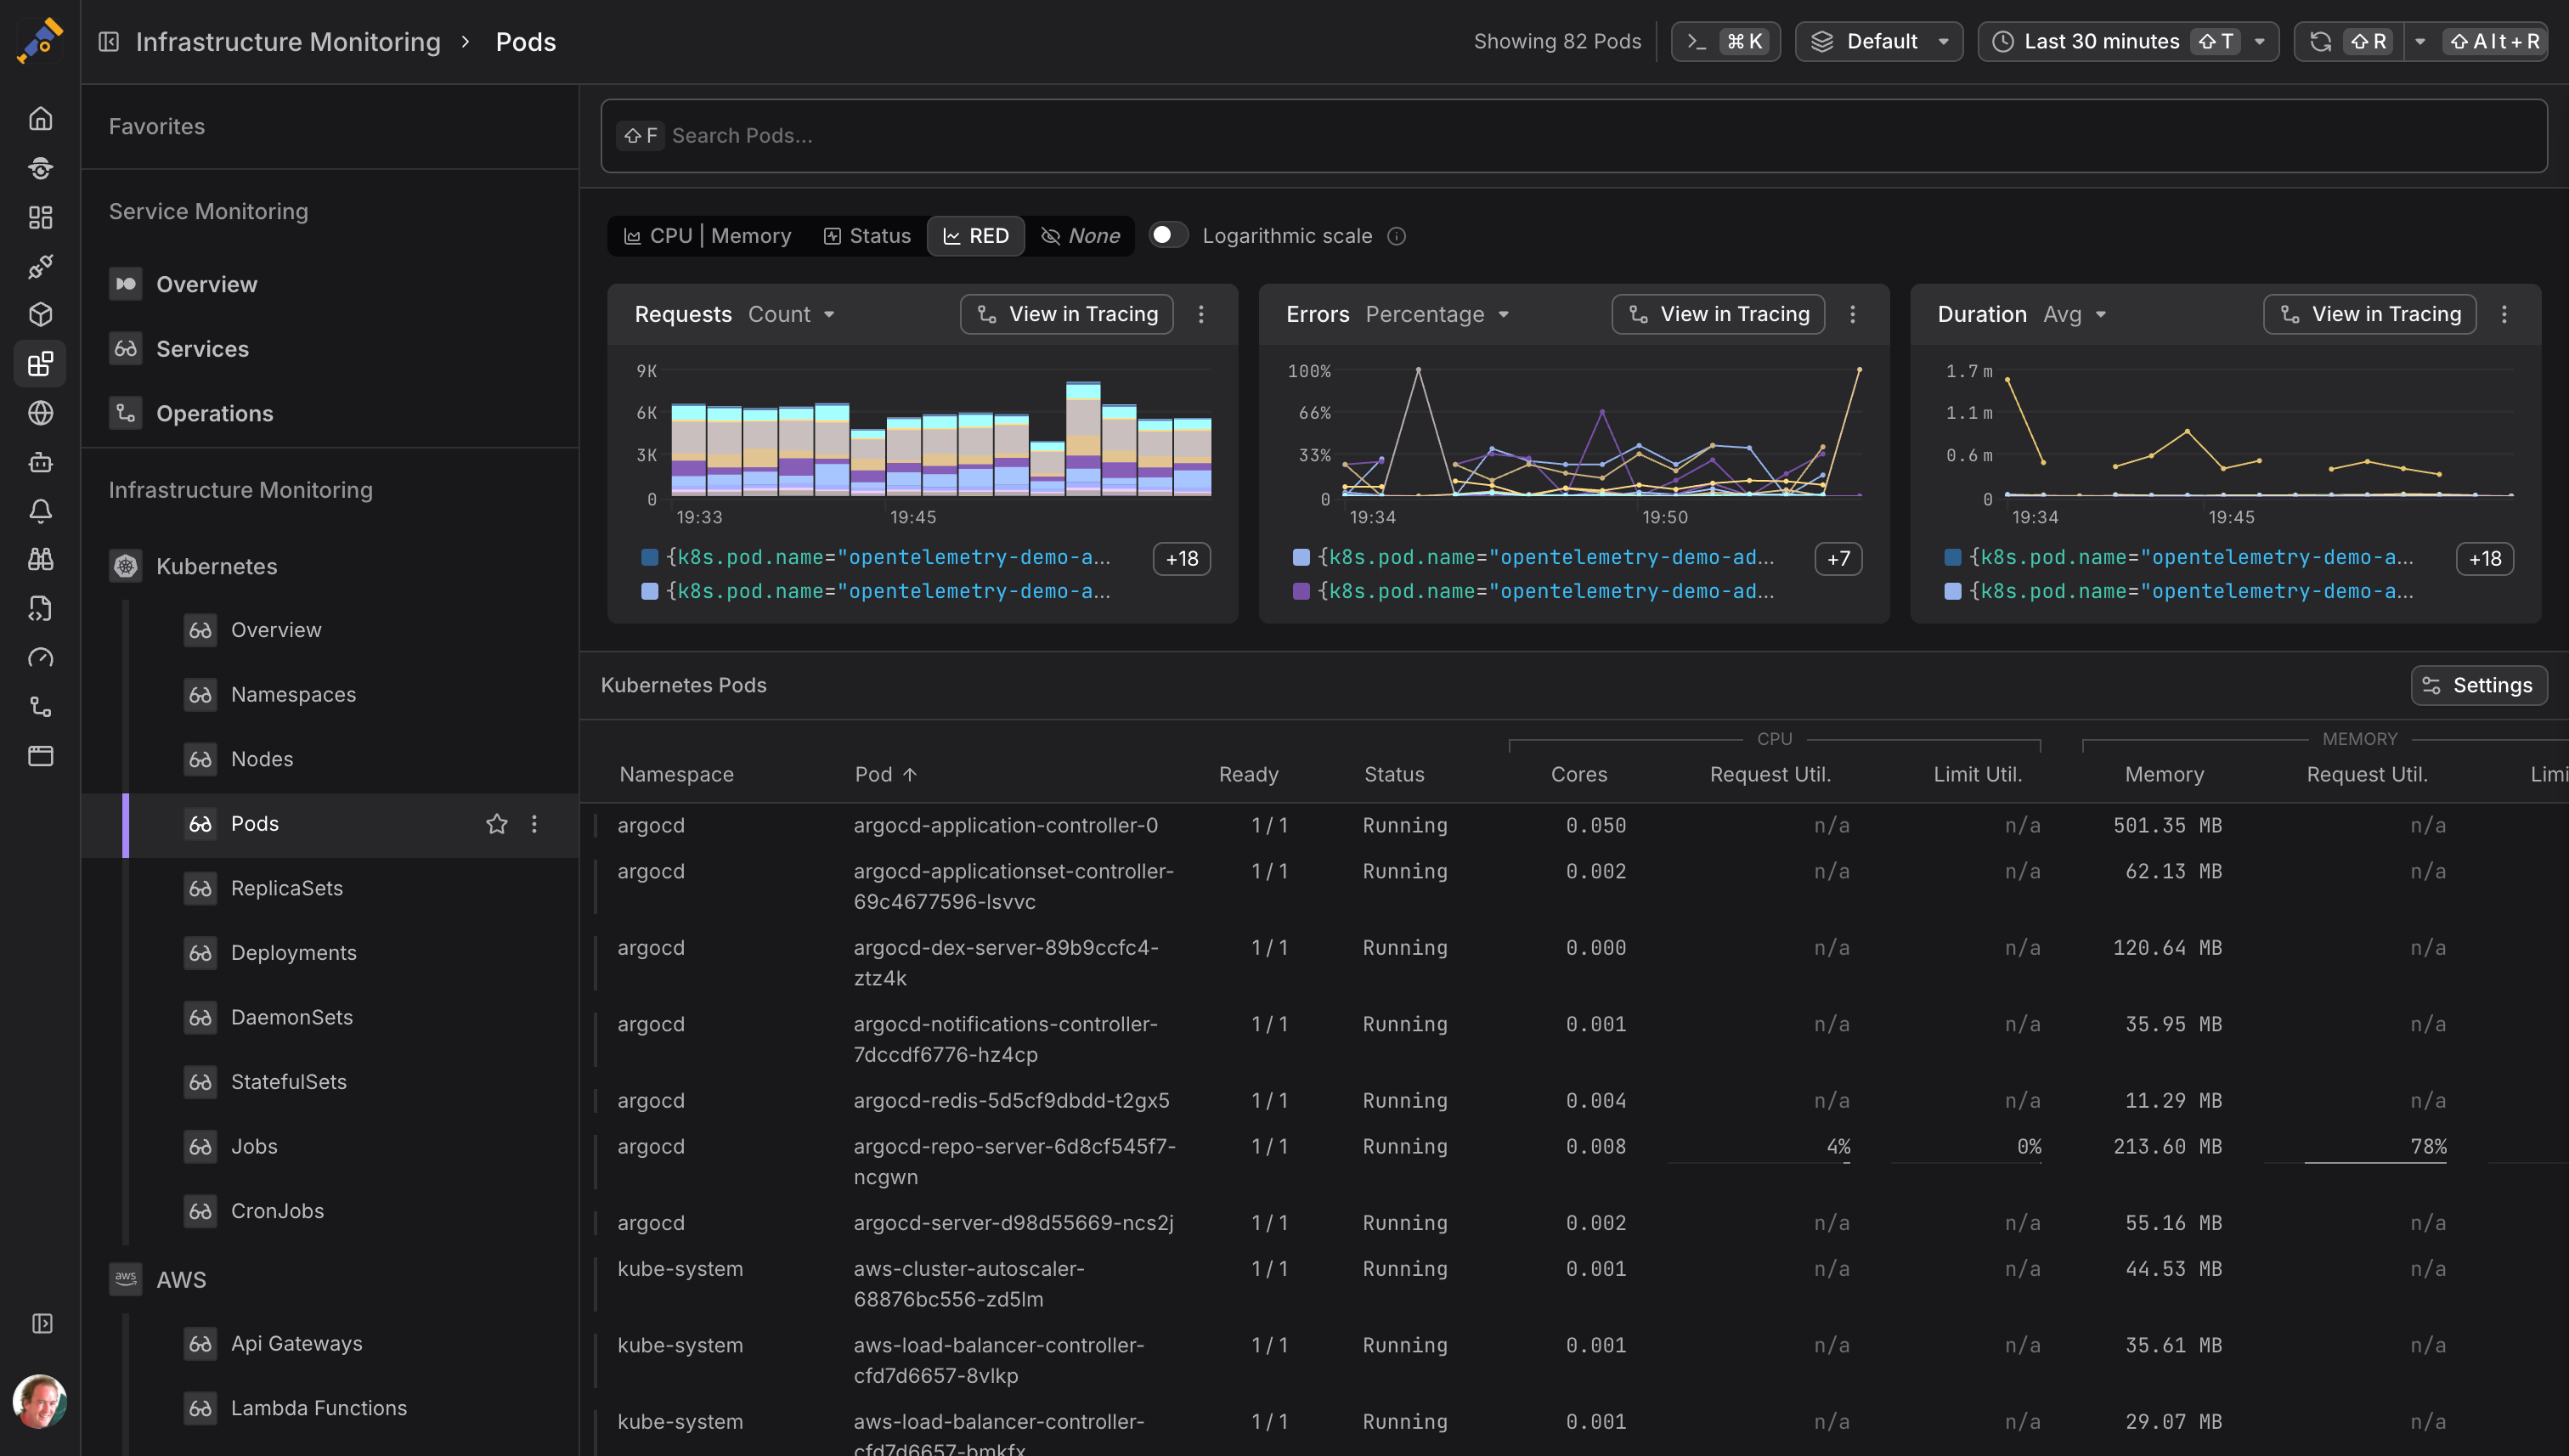
Full visibility into your Kubernetes clusters, cloud infrastructure, and containers. The Dash0 Kubernetes Operator handles the complexity so your team does not have to.
The tracing UI is amazing. When we switched to Dash0, it significantly cut down the amount of time from a bug being reported to figuring out why it happened and fixing it.
Dash0 has significantly streamlined our approach to observability and OpenTelemetry, bringing everything together in one place. The intuitive interface and seamless integration have enabled us to quickly gain valuable insights into our systems.
In an age of overly complex tools, Dash0 stands out for its simplicity and speed. Simple pricing, easy integration, amazing filtering capabilities, fast handling of large data volumes, and straightforward alerting.
Why Dash0 is moving beyond observability to close the loop between AI-written code and the production it runs in.
How Dash0 is evolving to help engineering teams operate software at AI-era velocity.
How to trace LLM calls, monitor token usage, and debug AI applications in production.
Start a free trial and connect your first environment today. Already on OpenTelemetry? You are ready to go.
