Last updated: March 25, 2026
PHP Logging with Monolog: A Complete Guide
If you build PHP applications, chances are you already rely on Monolog. It comes
bundled with Laravel, Symfony, and most modern frameworks, implements the PSR-3
LoggerInterface, and gives you a flexible foundation that keeps your
application decoupled from any specific logging backend.
While it is mature, well-documented, and capable of handling nearly any logging scenario you encounter, there's a meaningful difference between using Monolog and using it well.
Many applications stop at a basic setup: a single handler writing to a file or
stdout, paired with a handful of logging calls scattered across the codebase.
While this technically produces logs, they rarely carry enough context to be
useful when something goes wrong in production.
In this guide, you'll take a more deliberate approach and design a system that produces structured, context-rich, and actionable log data from the start.
By the end, your Monolog setup will emit logs that flow through an OpenTelemetry pipeline into a centralized platform, where you can search, filter, and correlate them with traces and metrics to understand your system as a whole.
Let's begin!
Prerequisites
Before proceeding, make sure your environment is ready for the examples in this guide:
You should also be comfortable running commands in your terminal and creating simple PHP scripts.
Setting up the demo (optional)
If you'd like to experiment with the concepts in this guide as you read, a demo is available in the companion repository. It spins up a PHP script alongside an OpenTelemetry Collector so you can see structured Monolog output and its OTel-normalized equivalent side by side.
123git clone https://github.com/dash0hq/dash0-examplescd dash0-examples/monolog-phpdocker compose up --build
The application exercises every pattern covered in this
guide, from JSON-formatted output and processors to
exception logging and the OTel Monolog handler. You can
modify index.php as you follow along and re-run the
container to see the results immediately.
Getting started with Monolog
To get a feel for how Monolog works, you'll create a minimal setup and inspect the output it produces. Start by creating a new project directory and installing Monolog:
12mkdir monolog-php && cd monolog-phpcomposer require monolog/monolog
This installs Monolog 3.x along with its PSR-3 dependency. Composer will also
generate the vendor directory and the composer.lock file to keep your
dependencies consistent.
Next, create an index.php file in the project root and add the following code:
12345678910111213141516<?phpdeclare(strict_types=1);require __DIR__ . '/vendor/autoload.php';use Monolog\Logger;use Monolog\Handler\StreamHandler;use Monolog\Level;$logger = new Logger('app');$logger->pushHandler(new StreamHandler('php://stdout', Level::Debug));$logger->info('Application started.');
This snippet creates a logger named app, attaches a handler that writes to
standard output, and emits a single log entry at the INFO level. Even in this
simple setup, you can already see the core building blocks of Monolog: a logger,
one or more handlers, and log records flowing through them.
Run the script:
1php index.php
You should see output similar to this:
1[2026-03-19T10:15:22.438291+00:00] app.INFO: Application started. [] []
This reveals how Monolog structures log records by default. The timestamp
appears first, followed by the channel name (app) and the severity level
(INFO). The message comes next, while the two empty arrays at the end
represent the context and extra fields, which are both empty for now.
A note on PSR-3
When you installed Monolog, Composer also pulled in the psr/log package. This
package defines the PSR-3 LoggerInterface, a standard created by the PHP-FIG
(PHP Framework Interoperability Group) that specifies how logging libraries
should behave.
The interface defines eight severity-level methods such as debug() and
info(), along with a generic log() method and a consistent way to attach
contextual data to log entries.
Because Monolog implements this interface, your application code stays decoupled from the logging implementation. If you ever need to switch to a different PSR-3-compatible logger, your logging calls remain unchanged.
This standardization also enables tools like OpenTelemetry to integrate at the PSR-3 layer. As you'll see later, this makes it possible to bridge your PHP logs to the OpenTelemetry model with no application-code changes required.
Understanding how Monolog works
Before going further, it's worth spending a moment on how Monolog's internals fit together. The library is built around a pipeline model with four key concepts: Loggers, Handlers, Processors, and Formatters.
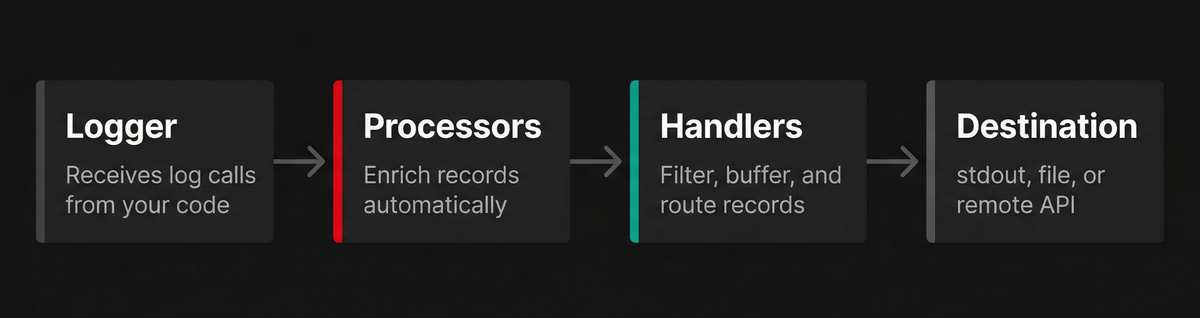
The Logger is what you interact with in your application code to log events.
When you call a method like $logger->info(), Monolog creates a LogRecord
containing the timestamp, channel name, severity level, message, and any context
you pass. That record is then passed through the rest of the pipeline.
Handlers determine where log records go and whether they're handled at all. At
the simplest level, a handler writes logs to a destination such as a file,
stdout, a database, or a remote API. The StreamHandler you used earlier is
the most basic example of this.
In practice, handlers are much more powerful than simple output targets. They enforce minimum log levels, decide which records should be processed, and can modify how records are delivered. Some handlers buffer logs and flush them in batches, while others wrap additional logic such as retries, fallbacks, or sampling strategies.
Each logger can have multiple handlers, and they are evaluated in a Last-In, First-Out (LIFO) order. This stacking mechanism is what allows you to build complex logging pipelines from simple, composable building blocks.
Processors sit between the logger and the handlers. Before a record reaches any handler, each processor can inspect and enrich it with additional data. This is where you attach information such as request IDs, authenticated user details, memory usage, or deployment metadata.
This leads to an important design distinction in Monolog: context versus
extra. Context is the data you pass explicitly with each log call, while extra
is data injected automatically by processors.
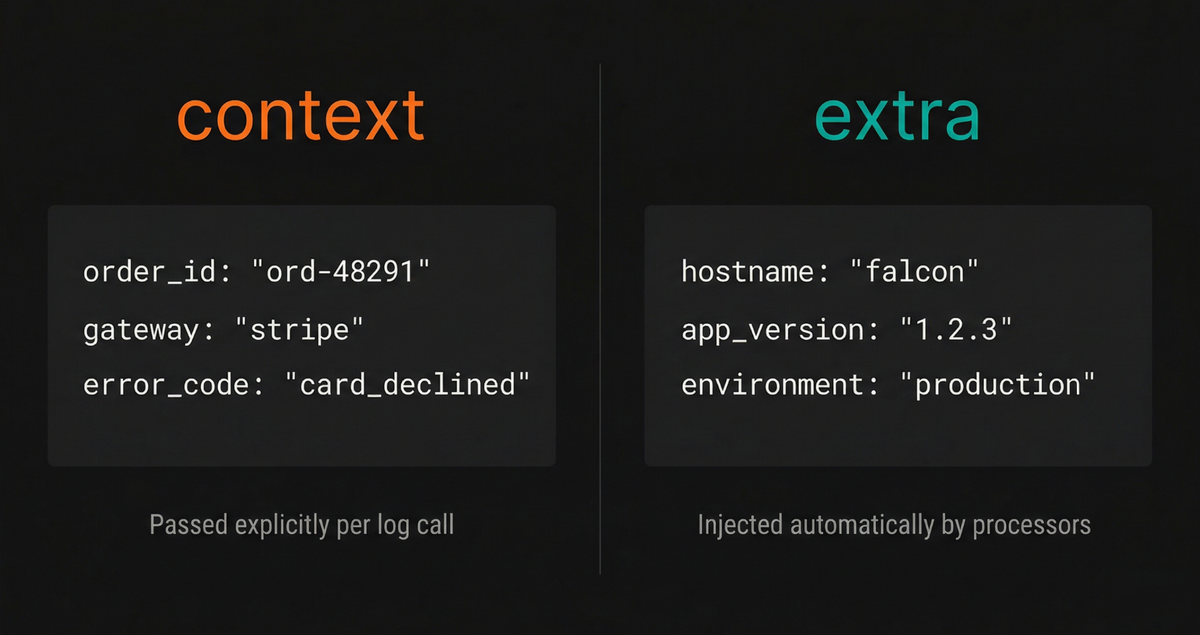
That separation is not just cosmetic. Cross-cutting information such as request
IDs or environment details should not be repeated in every log statement.
Instead, it belongs in processors that run automatically for every record.
Monolog formalizes this pattern by keeping context and extra as separate
fields on every log entry.
Finally, each handler can use a formatter to control how records are serialized.
The default LineFormatter produces human-readable output, which is useful
during development. For production systems, however, you will typically switch
to a JsonFormatter so logs can be parsed, queried, and correlated more
effectively across your observability stack.
Controlling the signal-to-noise ratio with log levels
One of the most important aspects of logging is deciding what not to log. Without clear boundaries, logs quickly become noisy, expensive to store, and difficult to reason about when something goes wrong.
Monolog follows the RFC 5424
severity levels, which define eight levels (listed below in increasing order of
urgency). In Monolog 3, these are represented by the Monolog\Level backed
enum:
| Level | Enum Value | Numeric Value | Description |
|---|---|---|---|
| DEBUG | Level::Debug | 100 | Detailed diagnostic information for developers |
| INFO | Level::Info | 200 | Normal operational events worth recording |
| NOTICE | Level::Notice | 250 | Unusual but non-erroneous conditions |
| WARNING | Level::Warning | 300 | Potential problems that deserve attention |
| ERROR | Level::Error | 400 | A failed operation |
| CRITICAL | Level::Critical | 500 | A serious failure in a major component |
| ALERT | Level::Alert | 550 | Action must be taken immediately |
| EMERGENCY | Level::Emergency | 600 | The system is unusable |
Each level maps directly to a method on the logger:
12345678$logger->debug('Detailed diagnostic information.');$logger->info('Normal operational events.');$logger->notice('Unusual but not erroneous conditions.');$logger->warning('Potential problems worth attention.');$logger->error('A failed operation that needs investigation.');$logger->critical('A serious failure in a major component.');$logger->alert('Action must be taken immediately.');$logger->emergency('The system is unusable.');
Handlers use these levels to decide which records to process. When you assign a minimum level to a handler, any log below that threshold is ignored. This is your primary tool for controlling the signal-to-noise ratio.
For example, if you only care about warnings and above:
123456$logger->pushHandler(new StreamHandler('php://stdout', Level::Warning));$logger->info('This will be ignored.');$logger->warning('This will be logged.');
In production, a common baseline is Level::Info or Level::Warning, depending
on how chatty your application is. You'll typically reserve Level::Debug for
local development or short-lived debugging sessions, since it can generate a
large volume of data very quickly.
Making levels configurable
Hard-coding log levels means every change in verbosity requires a redeploy. Instead, you should make this configurable so you can adjust it at runtime.
A simple approach is to read the level from an environment variable:
123456789101112function getLogLevel(): Level{$level = strtoupper(getenv('LOG_LEVEL') ?: 'INFO');return Level::fromName($level);}$logger->pushHandler(new StreamHandler('php://stdout', getLogLevel()));
The Level::fromName() method accepts case-insensitive strings such as
"debug" or "WARNING" and returns the corresponding enum value. If the value
is invalid, it throws an UnhandledMatchError, which helps you catch
misconfiguration early.
If you need even more flexibility, handlers also expose a setLevel() method,
allowing you to adjust verbosity dynamically during execution:
1$handler->setLevel(Level::Error);
This is useful for temporarily increasing log verbosity around specific code paths (e.g during an incident) without affecting the rest of your system.
Setting up structured logging with JSON
The default LineFormatter output is fine for local development, but it's not
suitable for production. Plain text logs are difficult to parse
programmatically, expensive to search at scale, and fragile when messages
contain special characters or multi-line content like stack traces.
That's why structured logging, typically in JSON format, has become the industry standard. Instead of emitting unstructured strings, your application produces well-defined key-value data that downstream systems can reliably index, search, and analyze.
Switching Monolog to JSON output only requires changing the formatter:
12345678910111213141516use Monolog\Logger;use Monolog\Handler\StreamHandler;use Monolog\Formatter\JsonFormatter;use Monolog\Level;$handler = new StreamHandler('php://stdout', Level::Info);$handler->setFormatter(new JsonFormatter());$logger = new Logger('app');$logger->pushHandler($handler);$logger->info('Order placed successfully.', ['order_id' => 'ord-48291','customer_id' => 'cust-1024','total' => 79.99,]);
This snippet configures a StreamHandler as before, but replaces the default
formatter with JsonFormatter. This ensures every log record is serialized as a
structured JSON object instead of a formatted string.
Running this code produces newline-delimited JSON output (formatted below for readability):
12345678910111213{"message": "Order placed successfully.","context": {"order_id": "ord-48291","customer_id": "cust-1024","total": 79.99},"level": 200,"level_name": "INFO","channel": "app","datetime": "2026-03-19T15:00:33.836309+00:00","extra": {}}
Each field now has a clear structure and meaning. The message remains the
human-readable summary, while context carries structured business data. The
level and level_name describe severity, channel identifies the source, and
datetime provides a precise timestamp. The extra field is reserved for data
injected automatically by processors, which you'll use later.
By switching your PHP logs to JSON, you've laid the foundation that makes your logs a genuinely useful signal for observability rather than a stream of text that cannot be used to debug today's complex systems.
Enriching PHP logs with contextual attributes
Switching to JSON format alone will not make your logs useful. A perfectly
structured JSON record that says {"message": "Something went wrong"} is no
more helpful than its plain-text equivalent.
Logs become valuable when they carry enough context to explain what actually happened. When something fails in production, you're not just looking for an error message. You want to know which request triggered it, which user was affected, and what inputs led to the failure.
Monolog provides two complementary mechanisms for attaching this context: the context array (per-message data you pass explicitly) and processors (cross-cutting data injected automatically into every record).
The context array is the simplest mechanism. It is the second argument you pass to a logging method, and it is meant for data that is specific to that single event:
12345$logger->error('Payment processing failed.', ['order_id' => 'ord-48291','gateway' => 'stripe','error_code' => 'card_declined',]);
However, not all context is tied to a single log statement. Imagine a function
that processes an order and emits several log entries along the way. You would
likely want every one of those entries to include the same order_id, not just
the first one.
If you zoom out further, you'll find context that applies to an entire request lifecycle, like a distributed trace ID. Go one level higher, and you have global metadata like the application version or deployment environment that should appear on every log record.
Passing all of this manually into every logging call would quickly become tedious, inconsistent, and error-prone. This is exactly the problem processors are designed to solve.
A processor is a callable that intercepts each LogRecord before it reaches the
handlers. It can inspect the record and enrich it by adding fields to the
extra array, ensuring that important context is attached automatically and
consistently across your entire application.
In the next section, you will use processors to inject request-scoped and application-wide metadata without changing individual log statements.
Built-in processors
Monolog comes with several built-in processors that let you enrich logs with useful runtime and environment metadata without writing any custom code.
These processors attach global context automatically to every log record by
adding fields to the extra array, which is exactly the kind of cross-cutting
information that should not live inside individual log statements.
Here are some of the most commonly used ones:
123456789101112131415161718192021use Monolog\Processor\GitProcessor;use Monolog\Processor\ProcessIdProcessor;use Monolog\Processor\MemoryUsageProcessor;use Monolog\Processor\HostnameProcessor;use Monolog\Processor\IntrospectionProcessor;// Adds the current git branch and commit SHA.$logger->pushProcessor(new GitProcessor());// Adds the process ID of the running PHP process.$logger->pushProcessor(new ProcessIdProcessor());// Adds current memory usage.$logger->pushProcessor(new MemoryUsageProcessor());// Adds the server hostname.$logger->pushProcessor(new HostnameProcessor());// Adds the file, line, class, and function// that triggered the log call.$logger->pushProcessor(new IntrospectionProcessor());
Each processor focuses on a specific type of metadata, and you can stack them to build up a rich picture of what is happening inside your application at runtime.
After registering these processors, the extra field of each log record will
contain additional context similar to the following:
12345678910111213141516{[...]"extra": {"line": 51,"file": "/app/src/OrderService.php","class": "App\\OrderService","function": "processPayment","hostname": "falcon","memory_usage": "2 MB","process_id": 70657,"git": {"branch": "master","commit": "5e1d261efebe7ca251de526ea68444a46b03fa78"}}}
This kind of metadata is invaluable during debugging. You can quickly identify which code path produced a log, which host handled the request, how much memory was being used, and even which version of the code was running at the time.
Since this data is injected automatically, it remains consistent across your entire codebase without requiring developers to include it manually in every log call.
Writing a custom processor
The built-in processors cover many common scenarios, but in practice you'll almost always need to attach application-specific context. Things like your deployment version, environment, tenant ID, or feature flags are unique to your system and will not be provided out of the box.
This is where custom processors come in.
A processor is simply a callable that receives a LogRecord and returns a new
one with additional data. In Monolog 3, LogRecord is immutable, so you cannot
modify it directly. Instead, you use the with() method to create a modified
copy.
Here's a simple processor that injects the application version and environment into every log record:
123456789101112131415161718192021use Monolog\LogRecord;class AppVersionProcessor{public function __invoke(LogRecord $record): LogRecord{return $record->with(extra: array_merge($record->extra,['app_version' => getenv('APP_VERSION')?: 'unknown','environment' => getenv('APP_ENV')?: 'production',]));}}$logger->pushProcessor(new AppVersionProcessor());
This processor reads values from environment variables and merges them into the
existing extra array. Because it runs automatically for every log entry, you
get consistent metadata across your entire application without touching any
individual logging calls.
Once configured, your logs will include this additional context:
1234567{[...],"extra": {"app_version": "1.2.3","environment": "production"}}
This kind of metadata becomes especially valuable when debugging issues across multiple deployments or environments. You can immediately tell which version of your application produced a log and whether it came from staging, production, or another environment.
As your system grows, custom processors become one of the most effective ways to standardize observability data and ensure every log carries the context you need to understand it.
Handlers control where and how logs are written
Broadly speaking, Monolog handlers fall into two categories:
-
Destination handlers that write log records somewhere, such as a file,
stdout, a socket, or a database. -
Wrapper handlers that do not write logs themselves but instead modify the behavior of other handlers they wrap.
By combining destination handlers with wrappers, you can build logging pipelines that match your production needs without complicating your application code.
Monolog ships with dozens of handlers, but most applications rely on a small subset. The following patterns cover the majority of real-world use cases.
Writing to stdout/stderr with StreamHandler
In containerized environments such as Docker or Kubernetes, the recommended approach is to write logs to standard output or standard error and let the runtime handle collection and aggregation.
This aligns with the twelve-factor app methodology and keeps your application portable across environments:
1234567use Monolog\Handler\StreamHandler;use Monolog\Formatter\JsonFormatter;$stdout = new StreamHandler('php://stdout', Level::Info);$stdout->setFormatter(new JsonFormatter());$logger->pushHandler($stdout);
Writing to log files
If you're running outside of a containerized environment, you may prefer to
write logs to disk. StreamHandler supports file paths directly:
1234567$handler = new StreamHandler('/path/to/app.log',Level::Info);$handler->setFormatter(new JsonFormatter());$logger->pushHandler($handler);
However, writing to a single file indefinitely is not sustainable since files grow without bound and eventually consume disk space.
To address this, Monolog provides RotatingFileHandler, which rotates logs
daily and keeps a limited number of historical files:
12345678910use Monolog\Handler\RotatingFileHandler;$handler = new RotatingFileHandler('/path/to/app.log',10,level: Level::Info);$handler->setFormatter(new JsonFormatter());$logger->pushHandler($handler);
This creates files like app-2026-03-19.log and retains only the most recent
files based on your configuration.
For high-volume production systems, it's better to delegate rotation to the operating system using tools like logrotate. This keeps concerns like compression and retention policies outside your application.
Capturing detailed context only when it matters
One of the hardest trade-offs in logging is choosing between verbosity and cost.
You want DEBUG-level detail when investigating a failure, but logging at that
level continuously in production generates enormous volumes of data that is
expensive to store and almost never read.
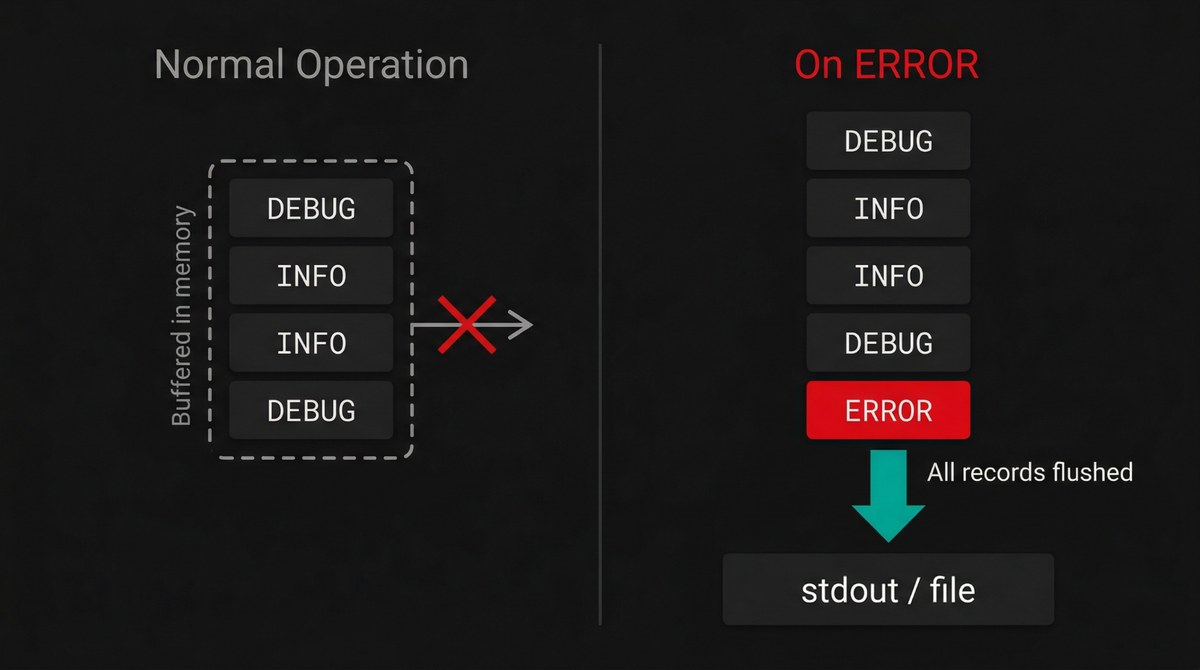
The FingersCrossedHandler eliminates this trade-off by silently accumulating
all records in memory without writing them anywhere. The moment a record at or
above a configurable trigger level (e.g., ERROR) arrives, the handler flushes
the entire buffer to the wrapped handler:
123456789use Monolog\Handler\FingersCrossedHandler;use Monolog\Handler\StreamHandler;$inner = new StreamHandler('php://stdout', Level::Debug);$inner->setFormatter(new JsonFormatter());$logger->pushHandler(new FingersCrossedHandler($inner, Level::Error));
The result is that during normal operation, nothing is written. But the instant something goes wrong, you get a complete timeline of everything that happened leading up to the failure without paying the cost of logging it on every successful request.
Other notable handlers to be aware of
Monolog includes many additional handlers that can help you refine your logging strategy:
-
DeduplicationHandlerwraps another handler and suppresses duplicate log records within a configurable time window. This is useful for preventing log storms when the same error fires repeatedly in a tight loop. -
SamplingHandlerwraps another handler and only forwards a configurable fraction of records (such as 1 in 10). This is one way to keep high-volume logging enabled in production without paying the full storage cost. -
FilterHandlerlets you specify an exact range of levels that should be forwarded to the wrapped handler, rather than just a minimum threshold. For example, you could route onlyWARNINGandNOTICErecords to one destination while sendingERRORand above to another. -
FallbackGroupHandlertries each wrapped handler in order and stops as soon as one succeeds. This is useful for building failover chains where a primary destination is preferred but a backup is available if it fails. -
NullHandlerdiscards all records. It is primarily useful for library authors that want to provide a default logger that does nothing unless the consuming application configures one.
You can find the complete list of built-in and third-party handlers in the Monolog documentation.
Logging errors and exceptions
Errors and exceptions deserve special attention in any logging strategy. It's not enough to just record that something failed; you also need enough detail to reconstruct what failed, where it failed, and what caused it.
Monolog makes this straightforward because it understands PHP exceptions
natively. When you include an exception in the context array under the
exception key, JsonFormatter serializes it into structured data. That
includes the exception class, message, code, file, line number, and stack trace.
If the exception wraps another exception, Monolog also captures that chain.
Here's a simple example:
123456789101112131415161718192021function connectToDatabase(): void{try {throw new \PDOException('Connection refused on port 5432');} catch (\PDOException $inner) {throw new \RuntimeException('Database unavailable',previous: $inner);}}try {connectToDatabase();} catch (\RuntimeException $e) {$logger->alert('Service degraded: database layer down.', ['exception' => $e,]);}
In this example, the original PDOException is wrapped in a RuntimeException.
When you log the outer exception, Monolog preserves that relationship so you can
see both the high-level failure and the lower-level cause.
With JsonFormatter, the resulting log entry contains structured exception data
that can be indexed and queried by your log backend:
12345678910111213141516171819202122{"message": "Service degraded: database layer down.","context": {"exception": {"class": "RuntimeException","message": "Database unavailable","code": 0,"file": "/home/ayo/dev/dash0/demo/php-monolog-logging/index.php:72","previous": {"class": "PDOException","message": "Connection refused on port 5432","code": 0,"file": "/home/ayo/dev/dash0/demo/php-monolog-logging/index.php:68"}}},"level": 550,"level_name": "ALERT","channel": "app","datetime": "2026-03-19T17:34:35.294565+00:00","extra": {}}
This is much more useful than flattening an exception into a single string. You can search by exception class, filter by message patterns, and inspect nested causes without manually parsing stack traces out of free-form text.
Handling uncaught exceptions
When an exception bubbles all the way up without being handled, PHP terminates
the script with a FATAL error. If you do nothing, you lose the opportunity to
log what actually happened.
To avoid this, you can register a global exception handler using
set_exception_handler(). This ensures that any uncaught exception is logged
before the process exits:
12345678set_exception_handler(function (\Throwable $e) use ($logger): void {$logger->critical('Uncaught exception, application terminating.',['exception' => $e]);});
In full-featured frameworks like Laravel or Symfony, this is already handled for you as part of their error handling infrastructure. However, in standalone scripts, CLI tools, or long-running workers, you need to set this up yourself.
It's a small addition, but it closes an important gap. Without it, the most critical failures in your application could disappear without a trace.
Connecting Monolog to OpenTelemetry
In production, your PHP application is only one piece of a much larger system. Logs are emitted from many different sources such as your database, web server, container runtime, and background workers. Each of these components produces logs in its own format, with its own field names and severity conventions.
When you need to investigate an incident that cuts across these boundaries, the lack of a common data model turns what should be a straightforward query into an exercise in manual correlation across incompatible formats.
OpenTelemetry addresses this by introducing a vendor-neutral standard for collecting, processing, and exporting telemetry data. When your PHP logs flow through an OpenTelemetry pipeline, they are normalized into the OTel log data model alongside logs from every other component in your infrastructure.
Severity levels are mapped to a common scale, contextual attributes follow consistent naming conventions, and resource metadata (service name, version, deployment environment) is attached uniformly. The result is that every log record in your system, regardless of its origin, becomes queryable through the same interface with the same field names.
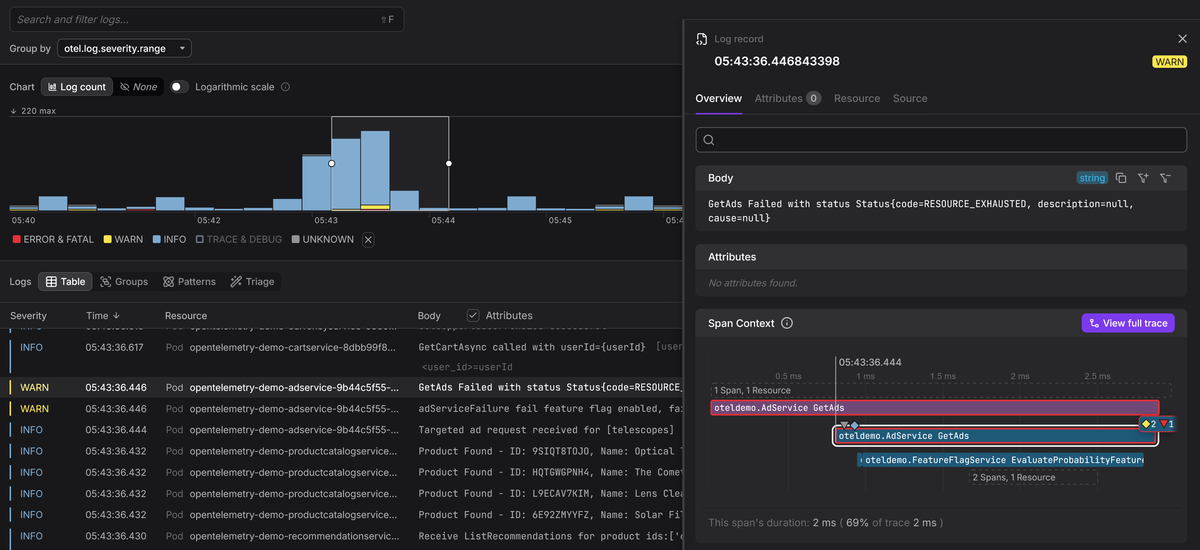
Another major benefit is correlation between logs and traces. Once your logs
are in the OpenTelemetry model, each record can include identifiers like
trace_id and span_id to link directly to the distributed traces that
represent request flows through your system.
This completely changes how you debug issues. Rather than searching logs by timestamp and trying to reconstruct what happened, you can jump from a log entry directly to the full trace it belongs to. From there, you can see every service involved, how long each step took, and where failures occurred.
This tight integration between logs and traces turns logging into more than just a record of events. It becomes part of a broader observability strategy where logs, metrics, and traces work together to give you a complete picture of your system.
The fastest path: zero-code PSR-3 instrumentation
Since Monolog implements the PSR-3 LoggerInterface (as discussed earlier), you
can use OpenTelemetry's automatic PSR-3 instrumentation to bridge your logs into
an OTel pipeline with no code changes whatsoever.
This approach relies on the OpenTelemetry PHP extension, which instruments function calls at the engine level so you need to install and enable this extension before adding the Composer packages:
1sudo pecl install opentelemetry
Then enable it in your php.ini:
12[opentelemetry]extension=opentelemetry.so
Alternatively, you can register it system-wide so it loads across all Server APIs:
123# Adjust the PHP version to match yours (8.4, 8.5, etc.)echo "extension=opentelemetry.so" | \sudo tee /etc/php/8.4/mods-available/opentelemetry.ini
1sudo phpenmod opentelemetry
Verify that the extension is active:
1php -m | grep opentelemetry
Once the extension is loaded, install the required OpenTelemetry packages:
1234567composer require \open-telemetry/sdk \open-telemetry/exporter-otlp \open-telemetry/opentelemetry-auto-psr3 \google/protobuf \guzzlehttp/guzzle \guzzlehttp/psr7
The OTLP exporter sends telemetry data over HTTP, but it depends on PSR-18 (HTTP client) and PSR-17 (HTTP factories) interfaces. Guzzle provides concrete implementations for both. If your project already uses another PSR-18 client, you can use that instead.
Next, configure the instrumentation using environment variables:
123456OTEL_PHP_AUTOLOAD_ENABLED=trueOTEL_PHP_PSR3_MODE=inject,exportOTEL_LOGS_EXPORTER=otlpOTEL_EXPORTER_OTLP_PROTOCOL=http/protobufOTEL_EXPORTER_OTLP_ENDPOINT=http://localhost:4318OTEL_SERVICE_NAME=my-php-app
With this configuration in place, every call to a PSR-3 logger in your application is automatically captured and routed through OpenTelemetry.
At runtime, the SDK autoloader initializes on each request, reads the OTEL_*
environment variables, and configures a global logger provider. The PSR-3
instrumentation then intercepts all logging calls and forwards them into the
pipeline.
The OTEL_PHP_PSR3_MODE variable controls how this works:
injectaddstraceIdandspanIdfields to your existing log context so they appear in your JSON logs.exportconverts each log into an OpenTelemetryLogRecordand sends it to the configured exporter.
When export mode is enabled and a collector is running with the
debug exporter
enabled, each log entry is transformed into a consistent structure:
123456789101112131415161718192021222324252627282930313233343536ResourceLog #0Resource SchemaURL:Resource attributes:-> service.name: Str(my-php-app)-> host.name: Str(falcon)-> host.arch: Str(x86_64)-> os.type: Str(linux)-> os.description: Str(6.6.87.2-...)-> process.runtime.name: Str(cli)-> process.runtime.version: Str(8.4.18)-> process.pid: Int(13830)-> process.executable.path: Str(/usr/bin/php8.4)-> telemetry.sdk.name: Str(opentelemetry)-> telemetry.sdk.language: Str(php)-> telemetry.sdk.version: Str(1.13.0)ScopeLogs #0ScopeLogs SchemaURL:InstrumentationScope io.opentelemetry.contrib.php.psr3LogRecord #0ObservedTimestamp: 2026-03-20 13:44:44.551... +0000 UTCTimestamp: 1970-01-01 00:00:00 +0000 UTCSeverityText:SeverityNumber: Info(9)Body: Str(Incoming request.)Attributes:-> http.request.method: Str(POST)-> http.route: Str(/api/v2/orders)-> server.address: Str(api.acme.io)-> user_agent.original: Str(AcmeMobile/3.4.1 ...)-> client.address: Str(203.0.113.42)-> user.id: Str(usr_8f3a2c91)-> user.role: Str(customer)-> tenant.id: Str(tenant_acme_corp)Trace ID:Span ID:Flags: 0
The Resource attributes section contains metadata about the process and
environment that the OTel SDK attaches automatically such as the service name,
hostname, OS details, PHP version, and SDK version.
Your Monolog context data appears under Attributes, flattened as top-level
keys, while the Trace ID and Span ID fields are empty in this example
because there was no active trace, but in a web application with tracing
enabled, these fields would be populated automatically, linking every log entry
to its originating request.
This is the fastest way to bring your existing logging setup into an OpenTelemetry pipeline. With minimal effort, your logs become part of a unified observability system where they can be correlated with traces and metrics across your entire infrastructure.
Explicit control: the OTel Monolog handler
Automatic instrumentation is the fastest way to get started, but it applies to every PSR-3 logger in your application. In some cases, you may want more control over which loggers are exported, or how they interact with your existing handler stack.
For this, OpenTelemetry provides a dedicated Monolog handler via the
open-telemetry/opentelemetry-logger-monolog package. Go ahead and install the
required dependencies:
1234567composer require \open-telemetry/opentelemetry-logger-monolog \open-telemetry/sdk \open-telemetry/exporter-otlp \google/protobuf \guzzlehttp/guzzle \guzzlehttp/psr7
Then configure your logger to include both your existing handlers and the OTel handler:
1234567891011121314151617181920212223242526272829303132333435<?phpdeclare(strict_types=1);require __DIR__ . '/vendor/autoload.php';use Monolog\Logger;use Monolog\Level;use Monolog\Handler\StreamHandler;use Monolog\Formatter\JsonFormatter;use OpenTelemetry\API\Globals;use OpenTelemetry\Contrib\Logs\Monolog\Handleras OTelHandler;$logger = new Logger('app');// Local console output (always active)$consoleHandler = new StreamHandler('php://stdout',Level::Debug);$consoleHandler->setFormatter(new JsonFormatter());$logger->pushHandler($consoleHandler);// OTel export (active when the SDK is configured)$loggerProvider = Globals::loggerProvider();$otelHandler = new OTelHandler($loggerProvider,Level::Info,);$logger->pushHandler($otelHandler);$logger->info('This log goes to both stdout and OTel.', ['order_id' => 'ord-48291',]);
In this setup, the OTelHandler behaves like any other Monolog handler. It sits
in the handler stack and processes records according to its configured level.
When a log record reaches the handler, it is converted into the OpenTelemetry
log data model and passed to the SDK's LoggerProvider, which handles export to
your configured backend.
By default, Monolog's context and extra arrays are mapped into OpenTelemetry
attributes under namespaced keys:
12Attributes:-> context: Map({"order_id":"ord-48291"})
If your attribute names already follow OpenTelemetry semantic conventions and you want them promoted to top-level fields, you can adjust this behavior with an environment variable:
1OTEL_PHP_MONOLOG_ATTRIB_MODE=otel
With this mode enabled, your attributes appear directly:
12Attributes:-> order_id: Str(ord-48291)
Using the dedicated handler is a good choice when you need fine-grained control over your logging pipeline while still benefiting from OpenTelemetry's unified data model and correlation capabilities.
Centralizing your Monolog logs in an observability platform
Once your Monolog logs are flowing through an OpenTelemetry pipeline, the next step is sending them to a backend where they can be explored, correlated, and used to investigate real problems.
At this point, your logs already conform to the OpenTelemetry data model, so any OTLP-compatible backend can ingest them without proprietary agents or custom translation layers.
You get the most value from this setup, however, when you use an OpenTelemetry-native platform that treats OTLP as a first-class data model instead of translating it into a proprietary schema.
When logs, traces, and metrics all share the same structure and semantic conventions, you no longer have to jump between disconnected tools or translate between incompatible schemas.
This fundamentally changes how you investigate issues. You might start with a spike in error rates, drill into the logs behind it, and then jump directly to the distributed traces for those requests. Because everything uses the same attributes and identifiers, each step flows naturally into the next.
Dash0 is one example of a platform built natively around OpenTelemetry. Because it doesn't rely on translation layers or proprietary schemas, your logs retain their full structure and semantic meaning from ingestion to query time.
This is where the earlier investment in structured logging and context pays off. Instead of treating logs as isolated text output, you now have a unified observability system where logs, traces, and metrics reinforce each other and provide a complete view of your system.
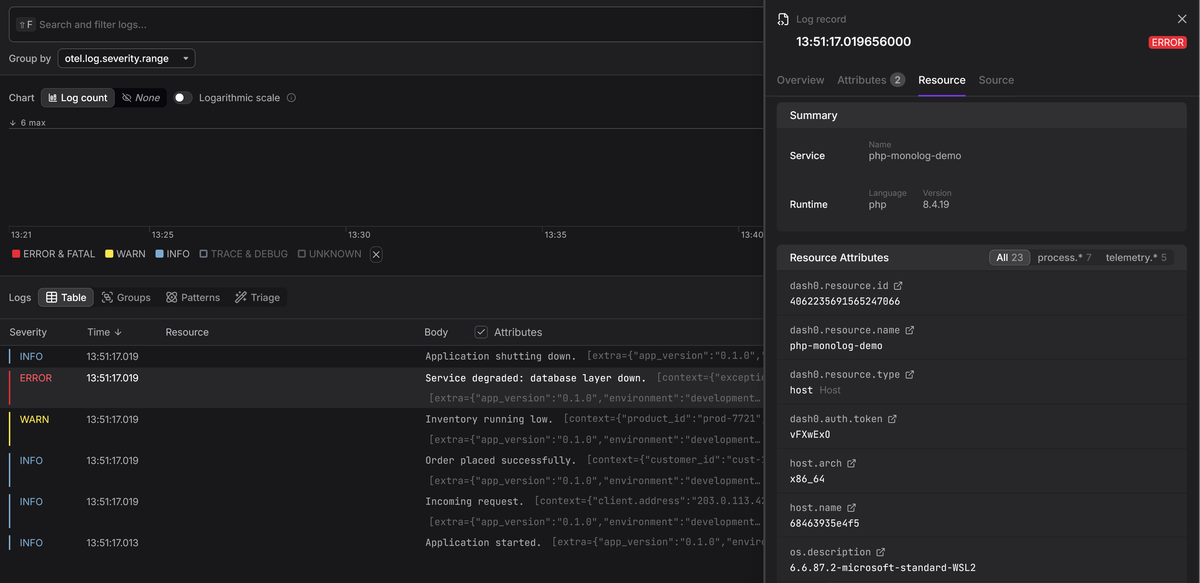
To see this in practice, the companion repository for this guide includes a Docker Compose playground that sends Monolog logs through an OpenTelemetry Collector to Dash0. You can have it running in under a minute, and the difference becomes clear the moment you move from raw log lines to a system where every event is connected and queryable.
Final thoughts
Monolog has earned its position as the standard PHP logging library because it is flexible enough to handle almost any requirement. But that flexibility can be a double-edged sword if it leads to ad hoc configurations that produce noisy, unstructured, and ultimately useless log data.
The patterns in this guide are designed to prevent that outcome. Structured JSON output makes your logs machine-parsable from the get-go, processors inject consistent context without cluttering your application code, and OpenTelemetry connects your logs to the broader observability ecosystem, giving you a unified data model and trace correlation across your entire infrastructure.
The best time to invest in all of this is well before you need it. Your future self, debugging a production incident with well-structured context-rich logs and a trace ID to follow, will be immensely grateful.
For further reading, check out the Monolog documentation, the OpenTelemetry PHP documentation, and our logging best practices article.
Then sign up for a free Dash0 trial to see your PHP logs alongside traces and metrics in a single, unified view.
Thanks for reading!
