Last updated: March 18, 2026
What Is OTLP and Why It's the Future of Observability
You're probably reading this because you don't want to sink time and money into proprietary observability platforms and agents anymore. Why would you? It ties you to a single vendor, forces you to accept their quirks, and makes it painful to change direction later.
What you really need is an open, consistent way to instrument, collect, and move your telemetry without worrying about compatibility or lock-in. That's exactly what OpenTelemetry (OTel) gives you, and at the center of it all is the OpenTelemetry Protocol (OTLP), the common language that makes your services, collectors, and backends speak fluently with each other.
This guide will walk you through OTLP in detail: what it is, why it matters, and how to use it in real pipelines. By the end, you'll see how embracing OTLP and pairing it with an OTel-native backend helps you solve the challenges of modern observability while keeping your stack open, reliable, and free of lock-in.
Let's get started!
Understanding OTLP fundamentals
The single most important benefit of the OpenTelemetry Protocol is that it decouples your instrumentation from your observability backend.
In the past, sending data to Vendor A meant using their proprietary agent and format. Switching to Vendor B meant re-instrumenting code and replacing agents, which was a costly and disruptive process that reinforced vendor lock-in.
With OTLP, you can instrument your code once using standard OpenTelemetry SDKs and then transmit the data to any OTLP-compliant backend, whether commercial or open-source. Changing vendors now becomes a simple configuration tweak, not a major engineering project.
OTLP provides the standardized format and transport that makes this portability possible. It defines a consistent format and set of rules for sending traces, metrics, and logs from a source (like your application) to a receiver (like the Collector or an observability backend).
To solve the practical challenges of real-world observability pipelines, OTLP was designed with a few key characteristics, which you'll need to keep in mind:
1. Transport flexibility
OTLP can be transmitted over multiple network protocols. The two primary transports are gRPC and HTTP. This makes it suitable across a wide range of environments, from high-performance backend services where gRPC shines to browser-based or constrained applications where HTTP is often the only option.
2. Efficient payload encoding
Telemetry is encoded using Protocol Buffers (Protobuf), a binary serialization format that's compact, strongly typed, and designed for safe schema evolution. New fields can be added without breaking older clients, and older fields are ignored gracefully by newer clients, as long as field numbers aren't reused.
This makes Protobuf ideal for telemetry pipelines which often need to evolve over time without disrupting compatibility. For environments where Protobuf isn't supported (like browsers), OTLP also defines a canonical JSON representation known as OTLP JSON.
3. Hop-to-hop reliability
OTLP uses a request/response model with acknowledgments. If a server is overloaded, it can signal clients to slow down or retry, preventing data loss and cascading failures.
4. Schema and versioning
OTLP is defined by
formal specification and a
set of .proto files.
This ensures backward and forward compatibility, so older clients and newer
servers can interoperate smoothly. At the time of writing, logs, metrics, and
traces are stable while profiles are in active development.
These design choices make OTLP a reliable foundation for building telemetry pipelines. In most production setups, OTLP flows through the OpenTelemetry Collector, which receives data, enriches or transforms it, and exports it to one or more backends.
Examining the OTLP data model
To really understand OTLP, you need to look at the shape of the data it carries. The protocol isn't just about moving bytes across the wire; it defines a hierarchical model that wraps every trace, metric, and log in the context you need to make sense of it. Without that context, your telemetry is just noise. With it, you get signals you can actually correlate and act on.
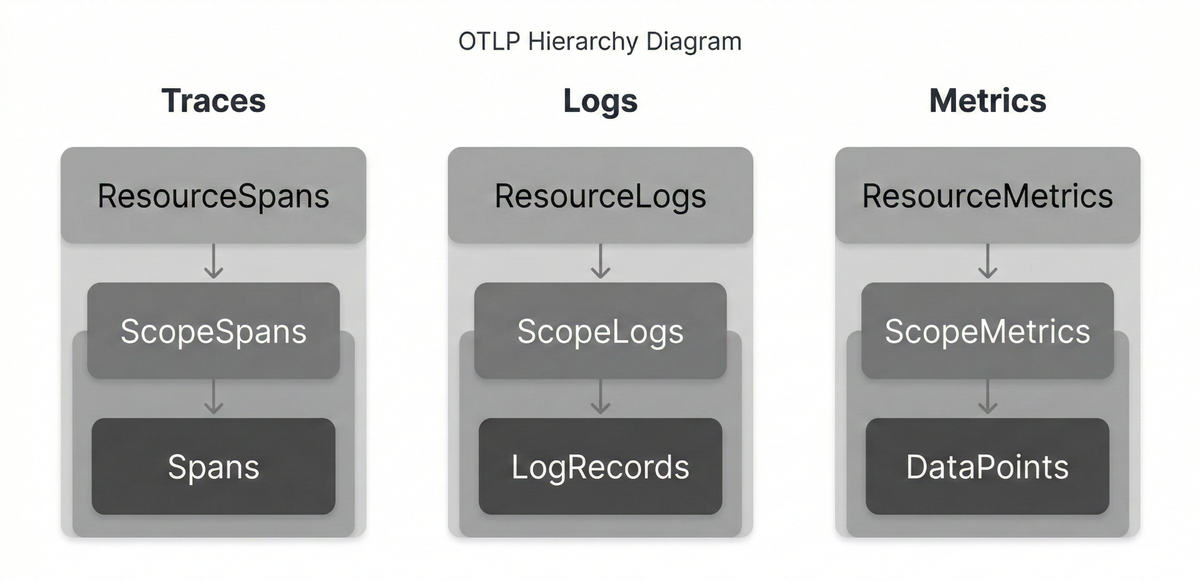
Every OTLP payload follows the same three-tiered structure:
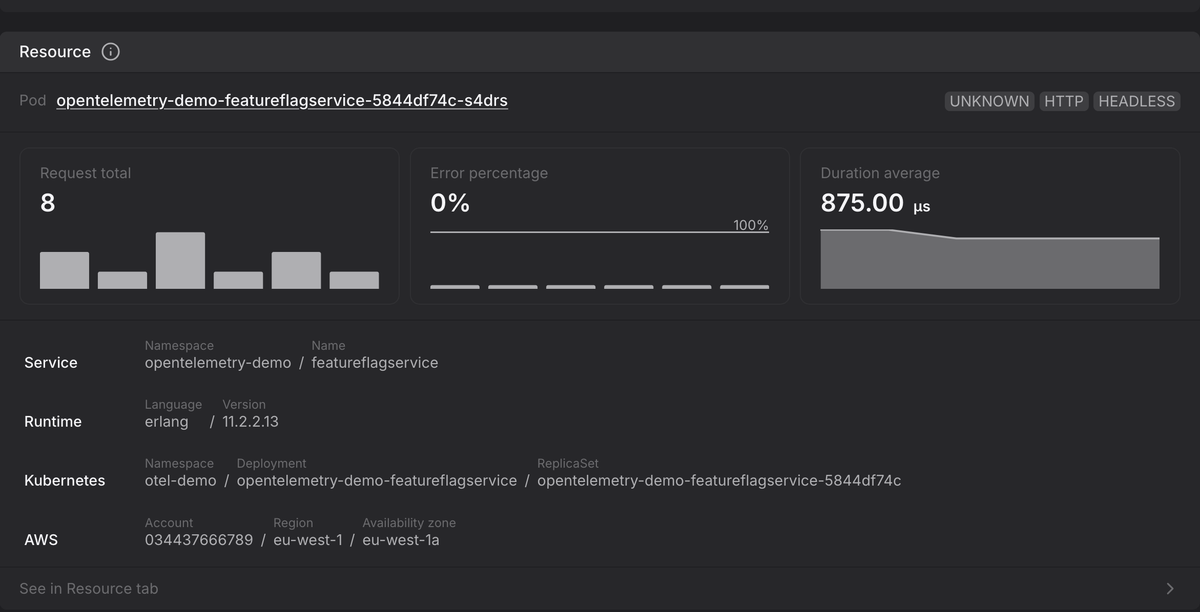
1. Resource
This is the “who” and “where” of your telemetry. It's the entity producing the data and its runtime environment.
A Resource is described by a set of attributes, such as service.name,
service.version, host.name, cloud.region, or k8s.pod.name. A single OTLP
payload can contain data from multiple resources, making this the primary anchor
for everything that follows.
2. Instrumentation scope
This tells you the code that produced a piece of telemetry by identifying the specific library or instrumentation that generated the signal.
For example, if you're using automatic instrumentation for Node.js and Express, the scope name might look like:
1@opentelemetry/instrumentation-express
This helps you tell apart signals from different libraries or frameworks in your app, and can be a lifesaver when you're debugging instrumentation itself.
3. Signal
This is the actual telemetry data itself, which could be a collection of Spans , Metrics, or LogRecords.
This Resource -> Scope -> Signal structure ensures that every data point in
OTLP carries not only the measurement but also its origin and method of
generation.
How traces are represented in OTLP
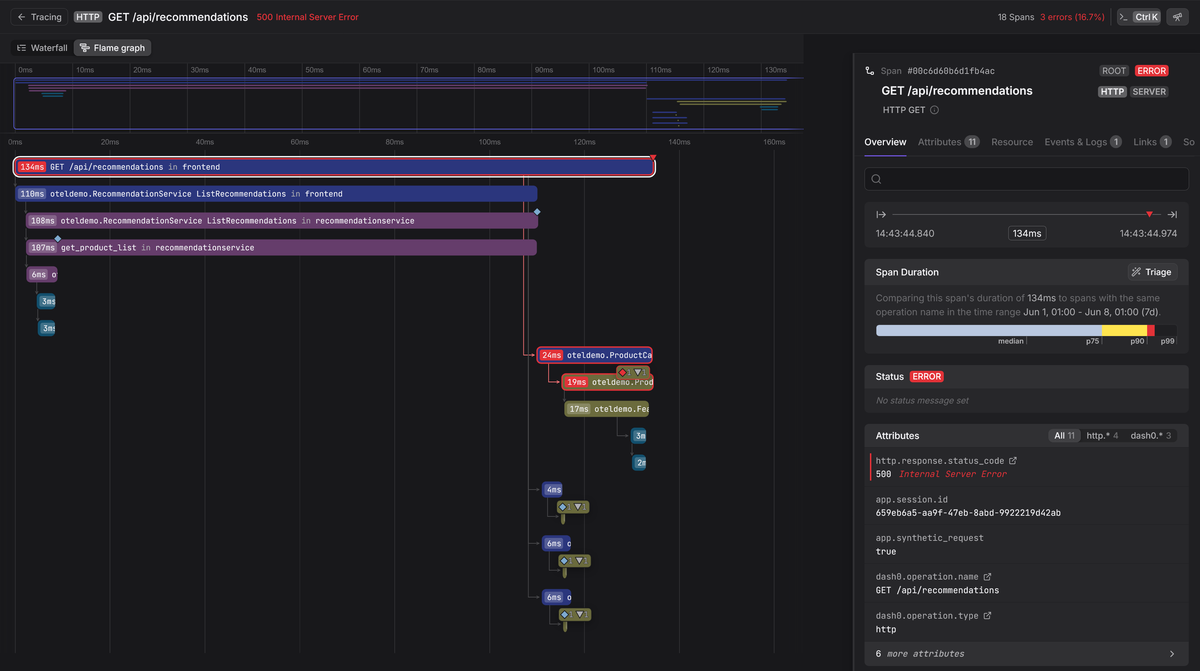
A trace is the end-to-end journey of a request through a distributed system. In OTLP, that story is told through spans, with each one representing a single operation, like a database query, an HTTP request, or a function call. Once they're linked together, you'll get a tree (or timeline) that shows the full execution path.
The full trace data model is defined in the OTLP trace specification, but here's a simplified look at the Span signal:
123456789101112131415161718192021message Span {bytes trace_id = 1;bytes span_id = 2;string trace_state = 3;bytes parent_span_id = 4;fixed32 flags = 16;string name = 5;enum SpanKind {...}SpanKind kind = 6;fixed64 start_time_unix_nano = 7;fixed64 end_time_unix_nano = 8;repeated opentelemetry.proto.common.v1.KeyValue attributes = 9;uint32 dropped_attributes_count = 10;message Event {...}repeated Event events = 11;uint32 dropped_events_count = 12;message Link {...}repeated Link links = 13;uint32 dropped_links_count = 14;Status status = 15;}
Some key fields to understand include:
trace_id&span_id: The unique identifiers that stitch the story of a request together. Every span in a trace share the sametrace_id.parent_span_id: This is what creates the parent-child relationship between spans, which lets backends render the trace as a tree or timeline.name: A human-readable label for the operation, likeGET /api/users.kind: This describes the role of the span, such asSERVER(for a request received),CLIENT(for a request made),PRODUCER,CONSUMER, orINTERNAL.attributes: Key-value pairs that provide detailed context about the operation.events: These are essentially structured logs attached directly to a span which is perfect for capturing notable occurrences that don't warrant their own span.links: These are references to spans in other traces (useful for messaging or batch jobs).status: Specifies whether the operation was successful (OK), failed (ERROR), or is unset. AnERRORstatus immediately flags a span for investigation.
Spans are wrapped in a three-level envelope that mirrors the
Resource → Scope → Signal hierarchy mentioned earlier. Even a single span is
carried this way, though batches are common (and desired):
resourceSpans: Groups spans by the resource that produced them.scopeSpans: Groups spans by the instrumentation scope.spans: One or more actual spans, as defined above.
Here's a truncated example in OTLP JSON:
123456789101112131415161718192021222324252627282930313233343536373839{"resourceSpans": [{"resource": {"attributes": [{ "key": "service.name", "value": { "stringValue": "frontendproxy" } }],"droppedAttributesCount": 0},"schemaUrl": "https://opentelemetry.io/schemas/1.36.0","scopeSpans": [{"schemaUrl": "https://opentelemetry.io/schemas/1.36.0","scope": {...},"spans": [{"attributes": [...],"droppedAttributesCount": 0,"droppedEventsCount": 0,"droppedLinksCount": 0,"endTimeUnixNano": "1756571696709237000","events": [],"flags": 0,"kind": 2,"links": [],"name": "ingress","parentSpanId": "","spanId": "fa7f0ea9cb73614c","startTimeUnixNano": "1756571696706248000","status": { "code": 0, "message": "" },"traceId": "da5b97cecb0fe7457507a876944b3cf","traceState": ""}]}]}],}
While trace coherence is determined by the span identity graph (traceId,
spanId, parentSpanId), this structure ensures that spans always carry the
context of their resource and scope which is valuable for attribution and
processing.
How metrics are represented in OTLP
OTLP also defines a structured and extensible data model for metrics, which is designed to align with existing ecosystems like Prometheus while adding richer semantics and cross-tool interoperability.
Here's a simplified look at the Metric specification:
12345678910111213message Metric {string name = 1;string description = 2;string unit = 3;oneof data {Gauge gauge = 5;Sum sum = 7;Histogram histogram = 9;ExponentialHistogram exponential_histogram = 10;Summary summary = 11;}repeated opentelemetry.proto.common.v1.KeyValue metadata = 12;}
The primary data point types include:
-
Sum: A scalar value that accumulates over time. Unlike the Prometheus Counter, it can be monotonic (only goes up, like
http_requests_total) or non-monotonic (likeactive_goroutines, which can rise or fall). -
Gauge: Captures the value of something at a specific point in time (
cpu_temperature,queue_size). -
Histogram: Groups measurements into fixed buckets (0–100ms, 100–250ms, …), which is perfect for latency percentiles (p95, p99) and distribution analysis.
-
Exponential histogram: A more advanced histogram using a logarithmic scale. It captures a wide range of values compactly, with high precision at the low end and coarser precision at the high end.
Note: The Summary type only exists for compatibility with older monitoring
systems. It isn't generated by OpenTelemetry SDKs and shouldn't be used for new
instrumentation.
Like traces, metrics are wrapped in a Resource → Scope → Signal envelope.
Here's a truncated OTLP JSON example showing a histogram metric for HTTP server
latency:
123456789101112131415161718192021222324252627282930313233343536373839404142434445464748{"resourceMetrics": [{"resource": {"attributes": [{ "key": "service.name", "value": { "stringValue": "checkoutservice" } }]},"scopeMetrics": [{"scope": {"name": "@opentelemetry/instrumentation-http","version": "0.43.0"},"metrics": [{"name": "http.server.duration","description": "Duration of inbound HTTP requests","unit": "ms","histogram": {"dataPoints": [{"attributes": [{"key": "http.method","value": { "stringValue": "GET" }},{"key": "http.status_code","value": { "intValue": 200 }}],"count": 123,"sum": 4567.0,"bucketCounts": [12, 50, 40, 21],"explicitBounds": [50, 100, 250],"startTimeUnixNano": "1756571600000000000","timeUnixNano": "1756571699999999000"}]}}]}]}]}
How logs are represented in OTLP
Log comes in many shapes and formats: plain text lines written by legacy applications and frameworks, structured JSON emitted by modern services, and system logs from the OS, containers, and infrastructure. Each carries valuable context, but differences in structure and semantics make it hard to aggregate and correlate them.
The OTLP log data model addresses this by:
-
Normalizing log content with a common LogRecord schema that can represent both simple strings and rich structured objects.
-
Preserving metadata from the original source via
attributes. -
Attaching correlation identifiers (
trace_id,span_id) so logs can be automatically linked to distributed traces.
Here's a simplified view of the LogRecord specification:
1234567891011121314message LogRecord {reserved 4;fixed64 time_unix_nano = 1;fixed64 observed_time_unix_nano = 11;SeverityNumber severity_number = 2;string severity_text = 3;opentelemetry.proto.common.v1.AnyValue body = 5;repeated opentelemetry.proto.common.v1.KeyValue attributes = 6;uint32 dropped_attributes_count = 7;fixed32 flags = 8;bytes trace_id = 9;bytes span_id = 10;string event_name = 12;}
Some of the most important fields are:
body: The log content itself (string or structured object).attributes: These are key-value pairs providing metadata about the log, just like with spans.trace_id&span_id: If a log is emitted during an active trace, the OTel SDK automatically injects the currenttrace_idandspan_idinto the log record. This allows an observability platform to automatically link your logs directly to the specific trace and span that produced them.severity_text&severity_number: Standardized log severity across frameworks, captured as both a canonical numeric value and a human-readable string.
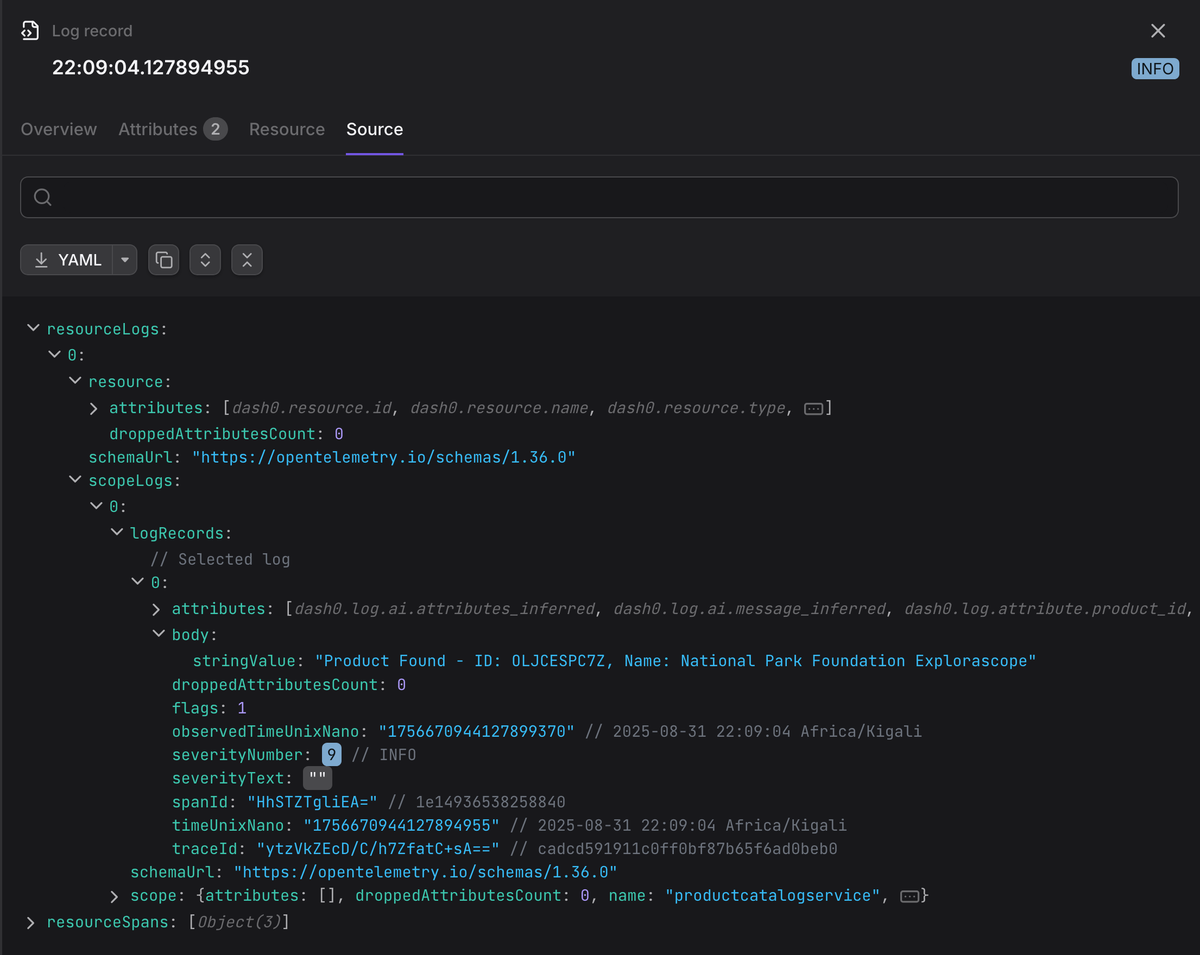
Like traces and metrics, logs are also wrapped in the
Resource → Scope → Signal envelope. Here's a truncated example in OTLP JSON:
12345678910111213141516171819202122232425262728293031323334353637{"resourceLogs": [{"resource": {"attributes": [{"key": "service.name","value": { "stringValue": "checkoutservice" }}]},"scopeLogs": [{"scope": { "name": "logback", "version": "1.4.0" },"logRecords": [{"timeUnixNano": "1756571696706248000","observedTimeUnixNano": "1756571696710000000","severityNumber": 17,"severityText": "ERROR","body": { "stringValue": "Database connection failed" },"attributes": [{ "key": "thread.id", "value": { "intValue": 42 } },{"key": "exception.type","value": { "stringValue": "SQLException" }}],"traceId": "da5b97cecb0fe7457507a876944b3cf","spanId": "fa7f0ea9cb73614c"}]}]}]}
Note that OpenTelemetry doesn't aim to replace your existing logging framework. It instead provides a log bridge, which adapts logs from existing libraries like Pino, Log4j, Serilog, or Slog into the OTLP log data model.
This means you can keep your current logging practices while seamlessly feeding those logs into an OTLP pipeline.
How to transition to OTLP
In practice, using OTLP comes down to three key steps: instrumenting your applications, normalizing other formats through the Collector, and choosing a backend that can make full use of the data.
1. Instrumenting your applications
The most direct way to produce OTLP telemetry is to instrument your services with an official OpenTelemetry SDK. When you configure the SDK to use an OTLP Exporter, it automatically serializes telemetry into the OTLP format and delivers it to a target endpoint.
By default, most SDKs ship with these endpoints which assume you’re using a local OpenTelemetry Collector sidecar:
http://localhost:4318→ OTLP/HTTPhttp://localhost:4317→ OTLP/gRPC
While these defaults are convenient, it's always best to configure the endpoint explicitly to avoid surprises.
For logs, you can keep using your existing framework, and simply integrate the appropriate bridge as discussed earlier.
2. Converting other formats to OTLP
A major strength of the Collector is its ability to ingest telemetry (whether logs, metrics, or spans) in various proprietary or open-source formats and convert them into OTLP through its various receivers.
For example, many existing systems expose metrics in the Prometheus format. You can use the Collector's prometheus receiver to scrape these metrics, convert them to OTLP, and send them to an OTLP endpoint:
1234567891011121314151617181920212223# otelcol.yamlreceivers:prometheus:config:scrape_configs:- job_name: my-app-metricsscrape_interval: 15sstatic_configs:- targets: [my-application:8080] # Your app's /metrics endpointexporters:otlphttp/dash0:endpoint: <your_dash0_otlp_endpoint>headers:Authorization: Bearer <your_dash0_secret_token>Dash0-Dataset: <your_dash0_dataset>service:pipelines:metrics:receivers: [prometheus]processors: [batch]exporters: [otlphttp/dash0]
3. Choose an OpenTelemetry-native backend
The final and most crucial step is choosing a destination for your standardized OTLP data. While many observability platforms claim to "support" OTLP, they often translate it into their proprietary internal format, which often strips away critical context and weakens your telemetry.
The full potential of your efforts is only realized when you send your data to an OpenTelemetry-native backend. A platform like Dash0, for instance, is built from the ground up with the OTel data model and semantic conventions at its core. It doesn't just receive OTLP; it thinks in OTLP.
That matters because it gives you:
-
Lossless data fidelity since there is no translation. This means every attribute and structure is preserved.
-
Automatic correlation because an OTel-native backend understands the relationships defined in the OTLP spec.
-
Context-rich insights out of the box through OpenTelemetry Semantic Conventions. For example, a
db.statementattribute isn't just text—it's actionable data for analyzing slow queries. -
The ability to see and export OTLP raw data unchanged for replay into other OTLP-compliant systems, which is an important and often missing ingredient in avoiding lock-in.
Choosing an OTel-native backend ensures that you aren't just using OTLP as a transport pipe but are fully capitalizing on the rich, interconnected observability data it was designed to deliver.
Why semantic conventions matter
If you've ever tried to stitch together telemetry from different services,
you've probably run into this problem: one app calls it http.status, another
calls it http_response_code, and a third decides on statusCode. All three
mean the same thing, but your Observability tool can't tell that automatically.
That's where Semantic Conventions come in. They aren't part of the OTLP protocol itself, but they sit alongside it as a specification, standardizing the names and values for attributes across resources, spans, metrics, and logs.
OpenTelemetry-native platforms like Dash0 are built to
understand these conventions. If a span reports db.system.name = "postgresql",
the platform knows to parse db.query.text and provide database-specific
insights.
Or, when http.server.request.duration spikes, the platform can connect that
metric to the error logs and traces from the same service.name because they
all share the same conventions.
Semantic Conventions may sound pedantic at first, but they're what transform telemetry from scattered key-value pairs into a cohesive, actionable story.
How OTLP data is transmitted
So far we've looked at what OTLP is and the structure of the data. But how does that data actually travel from your app to a backend?
OTLP is a request/response protocol. A client sends an
Export*ServiceRequest and the server (collector, proxy, or backend) replies
with a corresponding Export*ServiceResponse. This acknowledgment is the
foundation of OTLP's hop-to-hop reliability since every handoff confirms whether
the data was accepted or not.
A response from the server can fall into one of three categories:
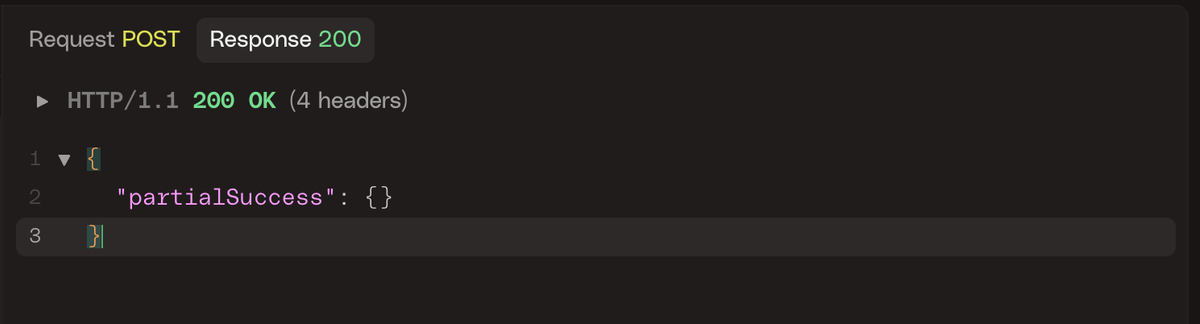
1. Full success
This is the happy path. The server fully accepts the data, and the response body
is an Export*ServiceResponse message with the partial_success unset.
2. Partial success
This one trips people up. Partial success means the server accepted some data but rejected the rest due to a contract violation.
The response body's partial_success field is set, and it includes:
rejected_spans,rejected_data_points, orrejected_log_records: A count of how many items were rejected.error_message: A human-readable string explaining why the data was rejected.
123456{"partial_success": {"rejected_spans": 2,"error_message": "2 spans were rejected due to invalid 'trace_id' or 'span_id' fields"}}
When a client receives a partial success response, it must not retry the request. The valid data has already been accepted, and the invalid data should be dropped. Instead, you should log the error message and increment counters for dropped telemetry.
Servers may also use partial success to send warnings even if nothing was
dropped. In that case, the rejected_<signal> count is 0, but error_message
will contain the warning.
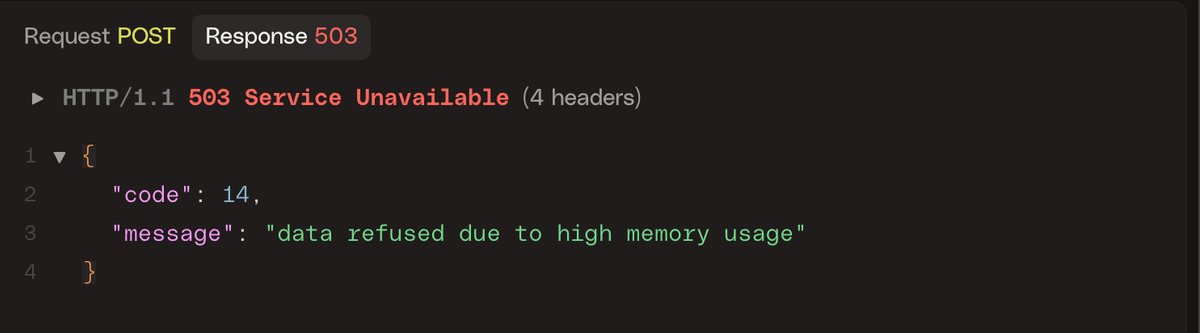
3. Failure
In this scenario, the entire request was rejected which can happen for two main reasons:
- The server cannot process the request due to temporary conditions.
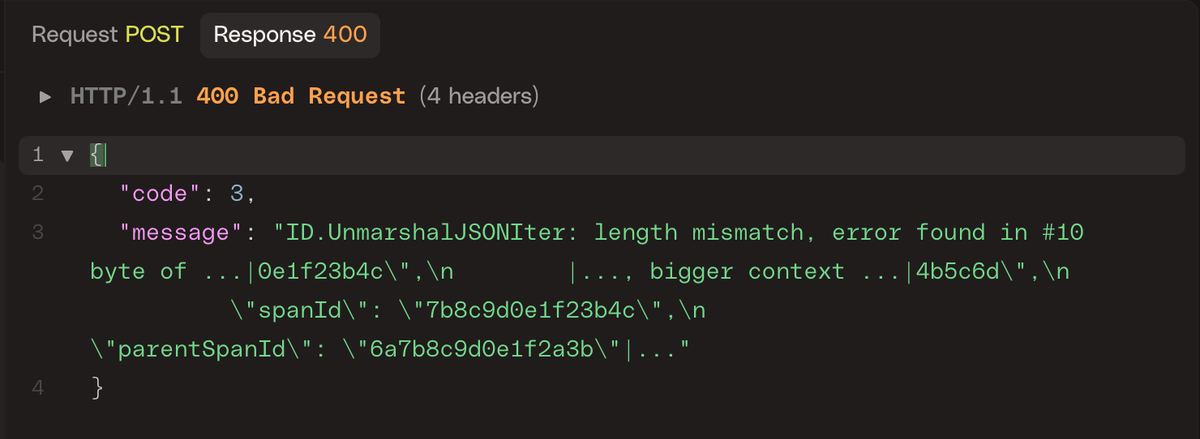
- The request itself is invalid or malformed and cannot ever succeed.
In the first case, the client should retain the data and attempt to resend the
same batch later, typically with exponential backoff and jitter to avoid
flooding the server. It allows the server to signal backpressure (e.g with the
Retry-After header) while giving the client a chance to deliver the data once
conditions improve.
In the latter case, the client must drop the data and must not retry. Such errors usually indicate instrumentation bugs or version incompatibilities and should be logged for investigation.
The protocol provides specific codes to distinguish between both retryable and non-retryable errors. You can find the full list for gRPC and HTTP in the OpenTelemetry docs.
Concurrency and request pipelining
The way your OTLP clients issue requests and wait for responses has a direct impact on throughput.
You can have sequential requests where the client sends one request at a time and waits for a response before sending the next. This approach is simple but inefficient in high-latency networks.
Throughput improves when the client issues multiple requests concurrently, keeping several in flight at once. This pipelining overlaps network and server processing, significantly increasing overall efficiency.
Building reliable OTLP pipelines
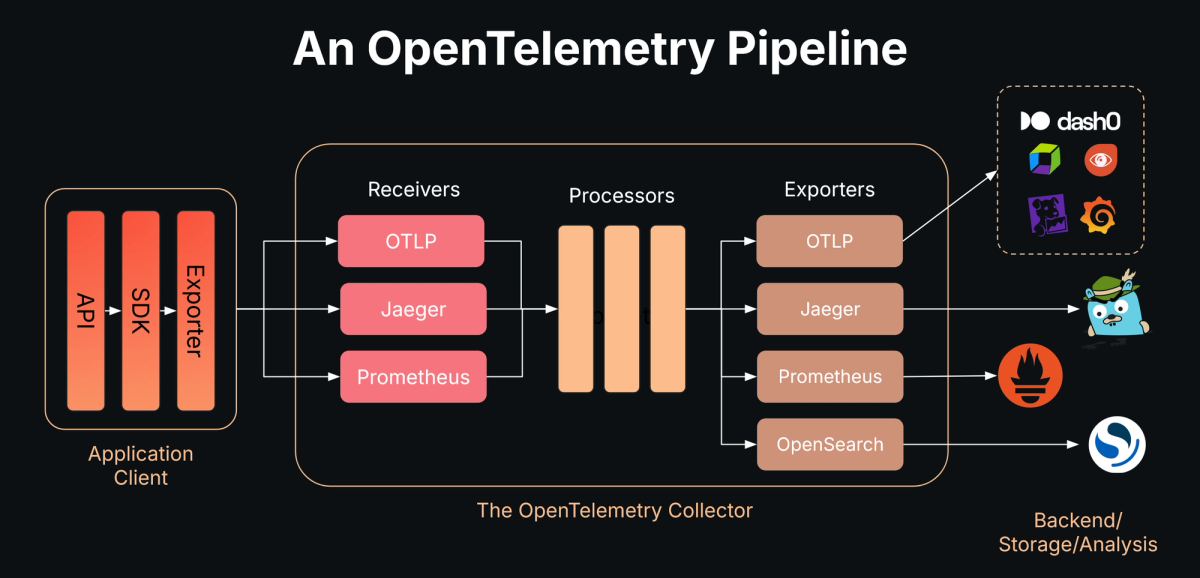
While it's possible to send OTLP data directly from your applications to a backend, in any production environment you should use the OpenTelemetry Collector.
The Collector provides the operational features that SDK exporters alone cannot: buffering, batching, enrichment, routing, and graceful handling of failures. These capabilities make the Collector the foundation of any production-grade OTLP deployment.
At its core, the Collector centralizes buffering and retry logic, so that transient failures or downstream outages don't immediately translate into dropped data.
It can also batch telemetry intelligently, combining small trickles of signals from many services into larger, more efficient payloads that reduce overhead and improve throughput.
Beyond transport, the Collector is capable of processing and enriching data—for example, attaching Kubernetes metadata, filtering out noisy telemetry, or applying advanced techniques like tail-based sampling to reduce cost while keeping the most valuable traces.
Just as importantly, it serves as a stable point of decoupling since applications only need to know how to reach the Collector, while backend changes can be managed entirely through configuration.
Taken together, these features make the Collector the operational backbone of any serious OTLP deployment.
Final thoughts
OTLP is quickly becoming the common language of modern observability. It standardizes how telemetry moves and how it's described, giving you a foundation that's open, consistent, and future-proof.
If you're investing in OpenTelemetry, don't stop at the wire protocol. Pair it with a platform that's equally committed to the standard. To see what that looks like in practice, start your free trial with Dash0 today.
