Last updated: April 17, 2026
Prometheus Monitoring: From Zero to Hero, The Right Way
In the world of cloud-native observability, knowing Prometheus isn’t just a nice-to-have; it’s a fundamental skill. But many guides are outdated, gloss over critical details, or worse, give you bad advice that will lead to production headaches.
This guide is different. We’re going to cover what Prometheus is, how it actually works, and how to use it effectively without falling into common traps. We’ll give you the practical knowledge a senior engineer wishes they had when they were starting out.
Let’s dive in!
What is Prometheus?
Prometheus is an open-source monitoring and alerting toolkit originally built at SoundCloud in 2012. It has since become the de facto standard for metrics-based monitoring in the cloud-native ecosystem and was the second project, after Kubernetes, to graduate from the Cloud Native Computing Foundation (CNCF).
At its core, Prometheus is a time-series database with a powerful query language called PromQL. Its fundamental design is based on a pull model, where the central Prometheus server actively “scrapes” metrics from your applications and infrastructure at regular intervals.
This pull-based architecture is highly effective for monitoring everything from traditional servers to dynamic, containerized environments like Kubernetes. To understand how it all fits together, let’s look at the different components that make up the Prometheus model so effective.
The Prometheus server
The Prometheus server is the core component of the monitoring system. It’s a Go application that is distributed as a single binary so that you install and run it anywhere. The server has several key responsibilities:
- Scraping: It’s configured to reach out to a list of targets over HTTP on a set schedule (such as every 15 seconds).
- Storage: The scraped data is saved in a highly efficient time-series database on the local disk.
- Rule evaluation: It constantly evaluates configured rules against the stored data to either generate new time-series or trigger alerts.
To interact with the server, you can use its built-in web interface (typically exposed at port 9090). You can use its expression browser to run ad-hoc queries with PromQL, check the status of your scrape targets on the /targets page, and see the current state of all alerts on the /alerts page.
For integration with other systems and scaling your setup, the Prometheus server has two important capabilities.
The primary feature is remote_write, which allows a Prometheus server to forward a copy of the metrics it collects to a centralized, Prometheus-compatible backend. This is the standard method for achieving long-term storage and a global view of your data.
A specialized application of this is agent mode, where the server doesn’t store any data locally. It acts exclusively as a lightweight collection agent, scraping targets and immediately forwarding the metrics using remote_write.
Targets and the /metrics endpoint
A target is anything you want to monitor. This could be a web application, a microservice, or a piece of infrastructure like a database or a server.
For Prometheus to monitor a target, the target must expose its current metrics on an HTTP endpoint, which by convention is /metrics.
When the Prometheus server “scrapes” the target, it’s simply making an HTTP GET request to this endpoint and parsing the text-based response.
This response must be in a specific format which has become known as the OpenMetrics format.

Exporters
What if you want to monitor a Linux server’s CPU usage or a PostgreSQL database? These systems don’t have a built-in /metrics endpoint, so this is where exporters come in.
An exporter is a helper application designed to run alongside the specific system you want to monitor. The exporter’s job is to:
- Collect the raw metric data from the target system.
- Translate these metrics into the Prometheus text format.
- Expose them on its own
/metricsendpoint for the Prometheus server to scrape.
Popular examples include the Node Exporter for server metrics, the Postgres Exporter for PostgreSQL, and the Redis Exporter.
Service discovery
In modern environments like Kubernetes or cloud platforms, servers and applications are constantly being created and destroyed, so manually updating a configuration file with the IP address of every target is impossible.
Service discovery is Prometheus’s solution to this. You can configure the Prometheus server to connect directly to the API of your platform (e.g., the Kubernetes API, AWS EC2 API). The platform then becomes the source of truth, providing Prometheus with a constantly updated list of available targets to scrape. This allows Prometheus to automatically start monitoring new services as they appear and stop trying to scrape them once they’re terminated.
Alertmanager
While Prometheus determines when to fire an alert based on predefined rules, it doesn’t handle the logic of sending notifications. This task is outsourced to a separate component called the Alertmanager.
When an alerting rule is met, Prometheus fires its alert to the Alertmanager. The Alertmanager then takes over and applies its own logic to:
- Deduplicate to prevent a flood of notifications if the same alert is firing from multiple sources.
- Group related alerts into a single, concise notification.
- Silence alerts for known maintenance windows.
- Route the notifications to the correct destination (such as Slack, email or PagerDuty) based on the alert’s labels.
Understanding the Prometheus data model and metric types
Every piece of data stored in Prometheus is a time series: a stream of timestamped values belonging to the same metric and the same set of labeled dimensions. This data model is what makes Prometheus so powerful.
A time series is uniquely identified by its metric name and a set of key-value pairs called labels. For example:
1http_requests_total{method="POST", path="/api/users", status="200"}
The metric name here is http_requests_total, and it should describe the general thing being measured (total number of HTTP requests). The labels are method, path and status, and they allow you to slice, dice, and aggregate your data with precision (such as calculating the rate of 500 errors on a specific endpoint).
A critical note on cardinality: The power of Prometheus comes from its labels, but this is also its biggest potential pitfall. Cardinality refers to the number of unique time series a metric has. If you use labels for values with very high uniqueness (like user IDs or request UUIDs), you can create millions of time series, overwhelming your Prometheus server. As a core best practice, always use labels for values with a low and finite number of possibilities.
There are four metric types you can use to structure this data. Getting them right is non-negotiable for effective monitoring.
1. Counter
A Counter is a cumulative metric that represents a single value that only ever increases or resets to zero on an application restart. Use cases include counting the number of requests served, background jobs completed, or errors that have occurred.
The raw value of a counter is rarely useful by itself. In most cases, you want to know its rate of change so that you can understand current system throughput, detect spikes or trends, and create meaningful alerts (such as “alert if the 500 error rate exceeds 10 per minute”).
2. Gauge
A Gauge is a metric representing a single numerical value that can arbitrarily go up and down. It’s perfect for measuring values that reflect a point-in-time state, like the current temperature, available memory, or the number of items in a queue.
Since they represent a current state, gauges are straightforward to use. You’ll typically use their direct value for thresholding and alerting, for instance, in a query like items_in_queue > 100.
3. Histogram
A Histogram is the most powerful metric type for measuring distributions of values like request latency. It works by sampling observations and counting them in configurable buckets.
When you instrument your code with a histogram, it exposes multiple time series: a cumulative _count of all observations, a cumulative _sum of their values (which lets you calculate an average), and a series of _bucket counters for each configured threshold, each with a specific le (less than or equal to) label.
12345678# HELP http_request_duration_seconds The latency of HTTP requests.# TYPE http_request_duration_seconds histogramhttp_request_duration_seconds_bucket{le="0.1"} 5http_request_duration_seconds_bucket{le="0.5"} 12http_request_duration_seconds_bucket{le="1.0"} 18http_request_duration_seconds_bucket{le="+Inf"} 20http_request_duration_seconds_sum 8.4http_request_duration_seconds_count 20
The key advantage of histograms is that they are aggregatable. Since they are fundamentally a collection of counters, you can reliably scrape and combine them from thousands of different application instances.
This allows you to use the histogram_quantile() function in PromQL to calculate accurate quantiles, like the 95th or 99th percentile latency, across your entire distributed system.
Since v2.40, native histograms were introduced as a newer, far more efficient format that offers higher resolution with lower data overhead. However, at the time of writing, it is still considered experimental and requires the --enable-feature=native-histograms feature flag to enable it.
4. Summary
A Summary metric samples observations, much like a histogram, but with a key difference: it calculates streaming quantiles (like the 99th percentile) directly in the client application and exposes them as pre-computed time series.
Its primary disadvantage, which is critical to understand, is that summaries are not aggregatable. Because calculating quantiles is not a linear operation, you cannot average the 99th percentile from server A and the 99th percentile from server B to get a meaningful system-wide value. This severely limits their usefulness in modern distributed systems.
Your first Prometheus stack
Let’s build a complete Prometheus monitoring stack with Docker. This will include the Prometheus server, a Node Exporter to collect system metrics from the host, and an Alertmanager to handle alerts. We’ll set up all the necessary configuration files first, then launch everything at once.
Start by creating the following docker-compose.yml file:
docker-compose.yml1234567891011121314151617181920212223242526272829303132333435363738394041424344454647484950networks:monitoring:driver: bridgevolumes:prometheus_data:alertmanager_data:services:prometheus:image: prom/prometheus:v3.4.2container_name: prometheusrestart: unless-stoppedvolumes:- ./prometheus.yml:/etc/prometheus/prometheus.yml- ./alerts.yml:/etc/prometheus/alerts.yml- prometheus_data:/prometheuscommand:- --config.file=/etc/prometheus/prometheus.yml- --storage.tsdb.path=/prometheus- --storage.tsdb.retention.time=15d- --web.enable-lifecycleports:- 9090:9090node_exporter:image: prom/node-exporter:v1.9.1container_name: node_exporterrestart: unless-stoppedvolumes:- /proc:/host/proc:ro- /sys:/host/sys:ro- /:/rootfs:rocommand:- --path.procfs=/host/proc- --path.sysfs=/host/sys- --path.rootfs=/rootfs- --collector.filesystem.mount-points-exclude=^/(sys|proc|dev|host|etc)($$|/)ports:- 9100:9100alertmanager:image: prom/alertmanager:v0.28.1container_name: alertmanagerrestart: unless-stoppedvolumes:- ./alertmanager.yml:/etc/alertmanager/alertmanager.yml- alertmanager_data:/alertmanagerports:- 9093:9093
This file defines the three services in our monitoring stack. The node_exporter service requires some special setup to monitor the host system rather than just the container it runs in.
In the volumes section, we’re mounting the host’s /proc, /sys, and /directories into the container, allowing it to access information about the host’s system resources.
The command arguments then tell the exporter where to find this host information so that it reports on the host machine and not the container itself.
Next, you’ll need to create a prometheus.yml file to tell the Prometheus server what targets to scrape:
prometheus.yml12345678910111213141516global:scrape_interval: 10sevaluation_interval: 10salerting:alertmanagers:- static_configs:- targets: ["alertmanager:9093"]rule_files:- alerts.ymlscrape_configs:- job_name: node_exporterstatic_configs:- targets: ["node_exporter:9100"]
This file sets global scrape and evaluation intervals to 10 seconds, points to the alertmanager service, and defines a single scrape job for the node_exporter service.
Now, create the alerts.yml file that was referenced in the configuration above:
alerts.yml1234567891011groups:- name: HostMonitoringrules:- alert: LowDiskSpaceexpr: (1 - (node_filesystem_avail_bytes{fstype!~"tmpfs|overlay"} / node_filesystem_size_bytes{fstype!~"tmpfs|overlay"})) * 100 > 80for: 1mlabels:severity: warningannotations:summary: "Low disk space on {{ $labels.instance }}"description: 'Filesystem at {{ $labels.mountpoint }} is {{ printf "%.2f" $value }}% full.'
This defines a single alert, LowDiskSpace, that will fire if any monitored filesystem has more than 80% of its space used for at least one continuous minute. The PromQL query in its expr field works by calculating the percentage of used disk space, not free space.
Note that while this example uses an alerting rule, Prometheus also supports recording rules, which let you precompute and store expensive or frequently-used queries as new time series to improve performance and simplify complex expressions in both dashboards and alerts.
Finally, create an alertmanager.yml file to define how alerts are handled:
alertmanager.yml123456789101112131415global:resolve_timeout: 5mroute:receiver: webhook-testgroup_by: ["alertname", "job"]group_wait: 30sgroup_interval: 5mrepeat_interval: 2hreceivers:- name: webhook-testwebhook_configs:- url: "<your_webbhok_url_here>" # Replace this in the next stepsend_resolved: true
This configuration defines an alert pipeline that groups similar alerts together to prevent spam. It waits 30 seconds to collect related alerts before sending the first notification, waits five minutes before notifying about new alerts in the same group, and resends alerts every two hours if an issue persists.
By default, all alerts are sent to the receiver named webhook-test, which is defined as a webhook that forwards the alert details to a specific URL. The global resolve_timeout also ensures alerts are automatically cleared if they haven’t been seen for five minutes.
With all the files in place, you’re ready to start the services. Before you proceed, go to webhook.site and copy the unique URL it provides you. Paste this URL into your alertmanager.yml, replacing <your_webhook_url_here>:

With this in place, you’re now ready to start the services by running:
1docker compose up -d

Once the containers are running, you can explore the different components of your new stack. You’ll see the actual data that Prometheus scrapes from the Node Exporter at http://localhost:9100/metrics:
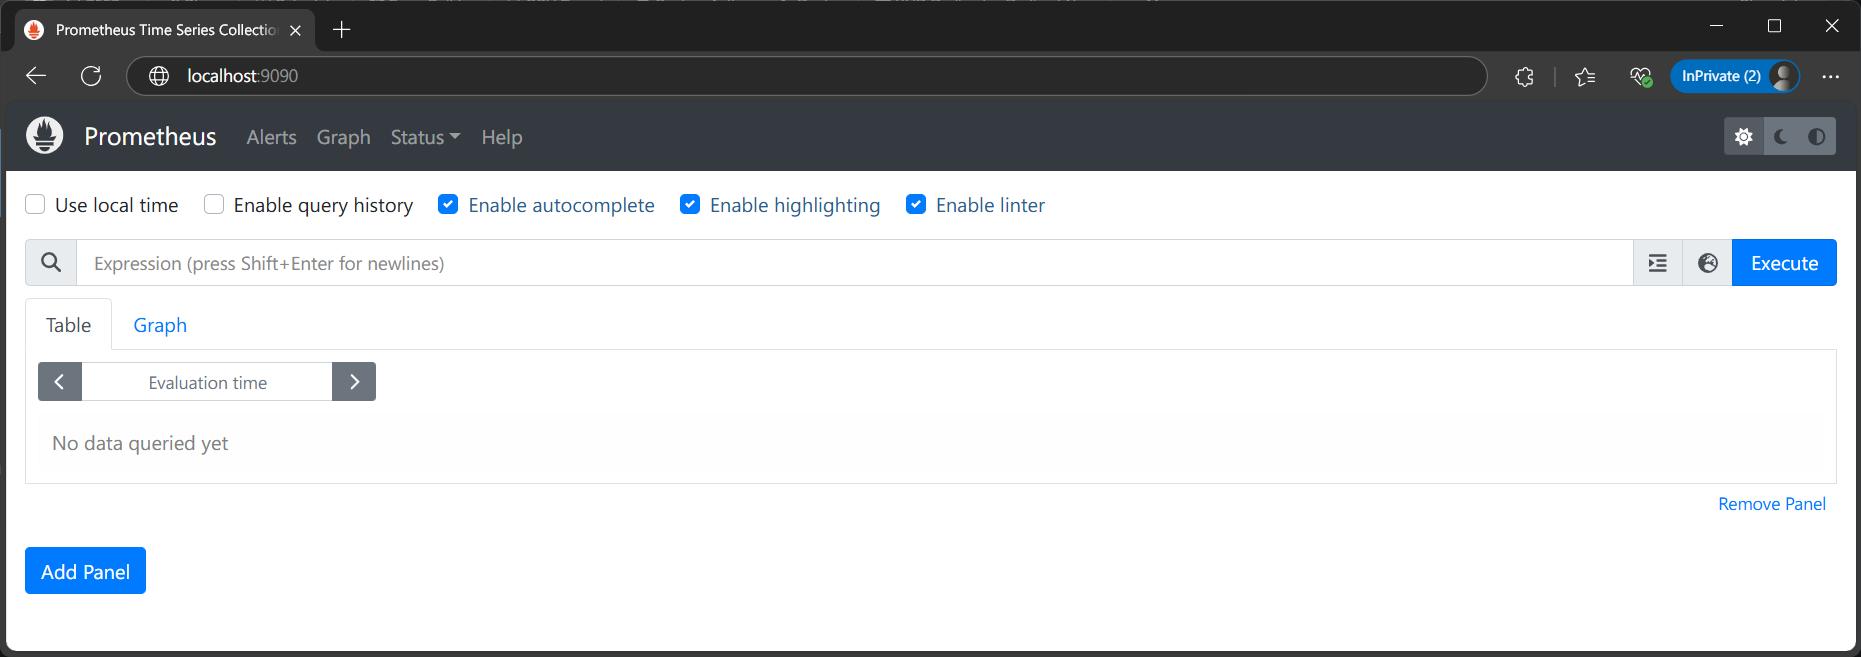
Then open your Prometheus UI at http://localhost:9090 and check the Alerts page. You should see the LowDiskSpace alert, but it will be green (inactive) if your disk usage is not over 80%.

To trigger an alert, you can consume additional disk space by using the dd command. This example creates a 10GB file (it may take a while). Adjust the count based on your free space to get over the 80% threshold:
1dd if=/dev/zero of=temp_space_eater.img bs=1M count=10240
After the next scrape (within 10 seconds), Prometheus will see the condition is met. The alert will appear on the Alerts page with a yellow Pending status. This means Prometheus is waiting for the for: 1m duration to complete.

After one minute, the alert’s status will change to a red Firing. Prometheus now sends the alert to Alertmanager.

You can now see the active alert in the Alertmanager interface at http://localhost:9093:

Alertmanager waits for the group_wait: 30s period, then sends the notification to your webhook URL. You’ll see the alert’s JSON data appear on the webhook.site page.

To stop the alert, simply remove the file you created:
1rm temp_space_eater.img
Prometheus will detect that the condition is no longer true and will stop sending the alert to Alertmanager. After the resolve_timeout (5 minutes), Alertmanager will send a resolved notification to your webhook (send_resolved: true).

The missing piece: visualizing your metrics
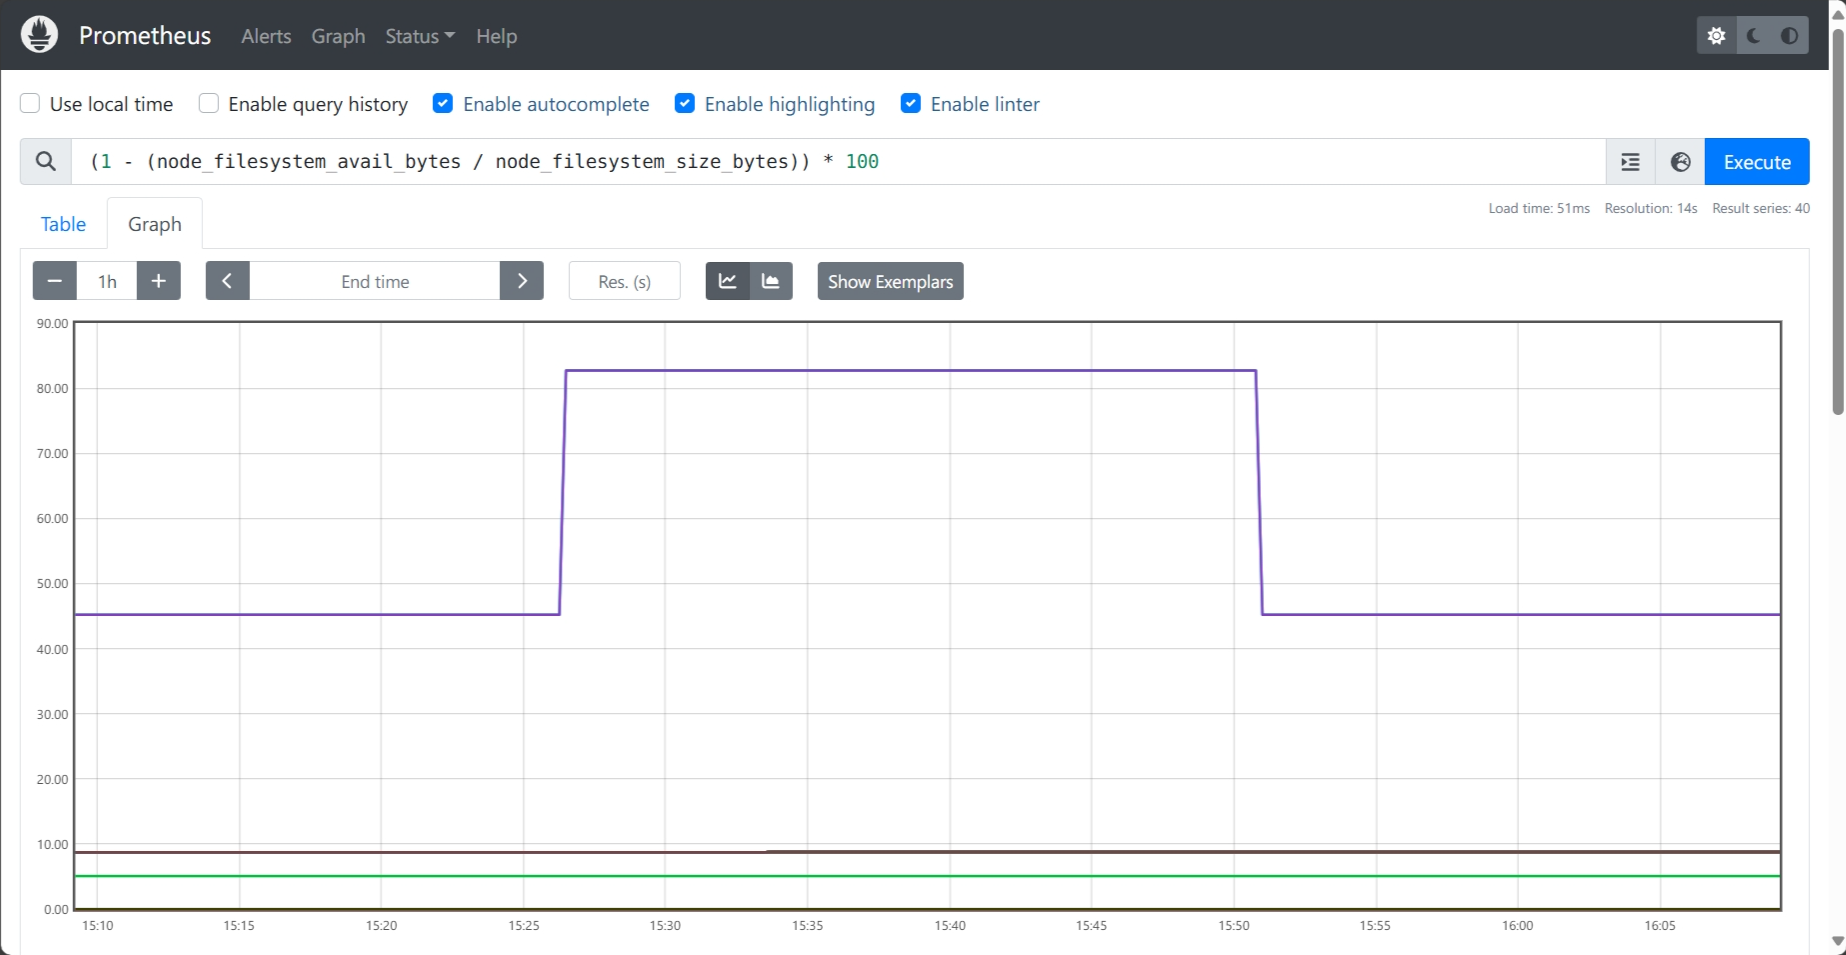
In the workflow we just explored, we saw the LowDiskSpace alert appear in the Prometheus and Alertmanager UIs. But how would you analyze the trend that led to that alert?
This is where a visualization platform comes in. You would build a dashboard with a graph panel showing the disk usage percentage over time. On this graph, you could clearly see the metric climb past the 80% threshold when you created the large file, and then see it drop back to normal after you deleted it.
This provides crucial visual context for troubleshooting by helping you understand if an issue was a sudden spike or a gradual problem—something the simple alert status cannot show you.
While the Prometheus UI provides basic visualization tools, you’ll need a dedicated visualization platform to build rich, professional-grade dashboards.
The most popular choice is Grafana, the de facto open-source standard known for its flexibility and support for hundreds of data sources.

A newer, CNCF-backed alternative is Perses, which is built with a “Dashboard as Code” philosophy where dashboards are defined in YAML, making them ideal for automation and GitOps workflows.

Understanding Prometheus service discovery
In the previous examples, we used static_configs to explicitly list targets for Prometheus to scrape. This approach is simple, but it’s not practical for dynamic environments where services are constantly being added or removed. The solution to this is service discovery.
The easiest way to see this in action is with Prometheus’s built-in file-based service discovery, where Prometheus watches a file for a list of targets and automatically reloads its configuration when the file changes.
First, you need to update your docker-compose.yml to mount a targets file into the Prometheus container:
docker-compose.yaml1234567services:prometheus:# ... (previous prometheus config)volumes:# ... (previous volumes)- ./targets.json:/etc/prometheus/targets.json # Mount the targets file# ...
In your prometheus.yml, instead of a static list, we’ll now use file_sd_configs:
prometheus.yml12345scrape_configs:- job_name: "dynamic-services"file_sd_configs:- files:- "targets.json"
Finally, create a file named targets.json. This file will initially tell Prometheus to scrape both the node_exporter and Prometheus itself:
targets.json1234567891011121314[{"targets": ["node_exporter:9100"],"labels": {"app": "node_exporter"}},{"targets": ["localhost:9090"],"labels": {"app": "prometheus"}}]
To see this in action, recreate the containers to apply the changes:
1docker compose up -d --force-recreate
Then open the Prometheus UI at http://localhost:9090 and go to the Status > Targets page. You will see both node_exporter and prometheus listed under the dynamic-services job:

Now, open targets.json on your host machine and delete the entire prometheus block, leaving only the node_exporter.
Within about a minute, refresh the Prometheus Targets page. The prometheus target would have disappeared from the list automatically, without requiring a restart:

In a production environment, this same principle applies but on a much larger, automated scale. Instead of you manually editing a JSON file, Prometheus would be configured to ask the Kubernetes API (through kubernetes_sd_config) directly for a list of running applications to monitor.
When you deploy a new service, Kubernetes would automatically tell Prometheus about it, and it would immediately be added as a scrape target. This allows your monitoring to automatically keep pace with your infrastructure, no matter how quickly it changes.
Monitoring ephemeral jobs in Prometheus
Ephemeral or short-lived tasks—like nightly cron jobs or one-off batch scripts—pose an obvious question for Prometheus’s pull model: how can the server scrape something that isn’t running most of the time? Two primary patterns exist to solve this.
1. The Pushgateway model
The Prometheus Pushgateway is a service that allows ephemeral jobs to push their metrics to it. Prometheus then scrapes the Pushgateway as a long-lived target. However, it’s crucial to understand its trade-offs.
The Pushgateway is a metrics cache that holds onto the last metrics it received until they are explicitly deleted via an HTTP request. This creates a risk of stale data: if a job succeeds on Monday but fails to run on Tuesday, its old success metrics will still be served, making your monitoring deceptive.
The Pushgateway is best reserved for specific use cases, such as service-level batch jobs (like a CI/CD pipeline) where the metrics don’t belong to a specific instance, and when you are prepared to manage the lifecycle of your metrics by deleting them after they have been scraped or have expired.
2. The Textfile Collector
For jobs that execute on a host where the Node Exporter is already running, the Textfile Collector is the simplest and most direct solution. The workflow is robust and aligns perfectly with the pull model:
- Your job finishes its work.
- It writes its metrics in the Prometheus text format to a file ending in
.prominside the exporter’s watched directory. - The Node Exporter automatically detects the file and exposes its metrics on its own
/metricsendpoint for Prometheus to scrape.
This pattern correctly binds the metrics’ lifecycle to the job’s execution. If the job never runs, the metric file isn’t updated, and alerts can fire reliably. There’s no extra service to manage or secure.
Here’s how a simple backup script could write its metrics following this pattern:
12345678910111213141516#!/bin/bashMETRICS_FILE="/var/lib/node_exporter/textfile_collector/backup.prom"# --- Job logic ---start_time=$(date +%s)sleep 30 # Simulate backup workend_time=$(date +%s)# --- Write metrics atomically ---cat <<EOF > "$METRICS_FILE.tmp"# HELP backup_last_completion_timestamp_seconds The timestamp of the last successful backup.# TYPE backup_last_completion_timestamp_seconds gaugebackup_last_completion_timestamp_seconds $end_timeEOFmv "$METRICS_FILE.tmp" "$METRICS_FILE"
For a job that’s supposed to run every 24 hours, the PromQL alert expression could be:
1time() - backup_last_completion_timestamp_seconds > 25 * 3600 # Fire if last run was > 25 hours ago
Scaling Prometheus: long-term storage and global view
A single Prometheus server is powerful and simple, and for a while, it’s all you need. But as your applications and infrastructure grow, you’ll inevitably hit a wall.
You might need to:
- Retain metrics for months or years, not just weeks.
- Query across multiple data centers or cloud regions.
- Handle high volumes of metrics without overloading a single server.
- Centralize alerting and dashboards for a global view.
The standard strategy for scaling is using Remote-Write. Your Prometheus servers scrape locally for reliability, then forward a copy of their data to a central system.
Three major open-source projects dominate this space:
- Thanos is often deployed as a “sidecar” alongside each Prometheus instance. It presents a single query interface across all your servers and can back up metrics to cheap object storage (like AWS S3), providing a cost-effective solution for long-term retention.
- Grafana Mimir is a horizontally-scalable, all-in-one system built for massive scale. It ingests data via
remote_writeand centrally handles storage, querying, and alerting in a single, large cluster. - VictoriaMetrics is a fast and resource-efficient time-series database known for its high performance and operational simplicity. Like Mimir, its cluster variant uses
remote_writeto ingest data from all your Prometheus servers.
You don’t need these tools on day one. But when your monitoring needs grow, it’s important to know that there is a clear and well-established path forward for scaling your Prometheus setup.
Final thoughts
You’ve now learned the core philosophy of Prometheus, how to get a functional monitoring stack running, and what the path to scale looks like.
This is a far more solid foundation than most beginner guides provide. You are now equipped not just to use Prometheus, but to think in the Prometheus way.
Your journey doesn’t end here. The next step is to apply this knowledge by instrumenting your own applications, adding exporters for your databases, and building rich dashboards to visualize it all.
If you’re looking to offload the operational burden of self-hosting the entire stack while keeping the power of the Prometheus model, Dash0 provides a compelling alternative.

Your Prometheus instances remain at the edge doing what they do best (scraping metrics) while Dash0 handles the heavy lifting of long-term storage, fast queries, dashboarding, alerting, and cross-signal correlation with logs and traces.
Happy monitoring!
