Last updated: July 7, 2026
Migrating from Datadog to OpenTelemetry and Dash0
Migrating from Datadog to OpenTelemetry (OTel) does not require a big-bang cutover. The OpenTelemetry Collector speaks both Datadog's wire protocol and the OpenTelemetry Protocol (OTLP), which means you can receive traffic from your existing Datadog Agents and fan it out to Datadog and other observability vendors like Dash0 simultaneously. You validate Dash0 with live production data before touching a single application, then migrate services one at a time at whatever pace suits your team.
- Phase 1: Deploy the Collector and enable fan-out
- Phase 2: Migrate application instrumentation
- Phase 3: Migrate log collection
- Phase 4: Kubernetes environments
- Phase 5: Translate dashboards and alerts
- Phase 6: Validate before cutting over
- Phase 7: Cut over
For a quick reference on how Datadog attributes map to OTel semantic conventions, see the attribute mapping table.
Prerequisites
- OpenTelemetry Collector Contrib: the Contrib distribution includes the Datadog receiver and exporter; the core distribution does not
- A Datadog account and API key (your existing setup remains unchanged until you cut over)
- A Dash0 account: create one for free and retrieve your OTLP ingress endpoint and create an auth token scoped for ingestion under Settings
- Docker or a Linux host to run the Collector
- For Kubernetes: kubectl and Helm 3
Frequently asked questions
Do I need to change application code to start the migration? No. Deploy the Collector, configure the datadog receiver on port 8126, and point existing Datadog Agents at it by setting DD_AGENT_HOST and DD_TRACE_AGENT_PORT. Traces flow to both Datadog and Dash0 with no application code changes.
Can Datadog and Dash0 run in parallel? Yes and that is the recommended approach. The Collector fans out identical telemetry to both backends. Validate Dash0 for 1–2 weeks before reducing your Datadog footprint.
How long does the full migration take? Phase 1 (fan-out) takes a few hours. Migrating application instrumentation takes days to weeks per service. Rebuilding dashboards and alerts is typically the longest phase but Agent0 can significantly shorten that. Budget 3–6 weeks end to end for a small-to-medium environment.
What happens to DogStatsD custom metrics? The statsd receiver accepts DogStatsD traffic on port 8125 and converts it to OTel metrics without any changes to your application or StatsD client.
Architecture overview
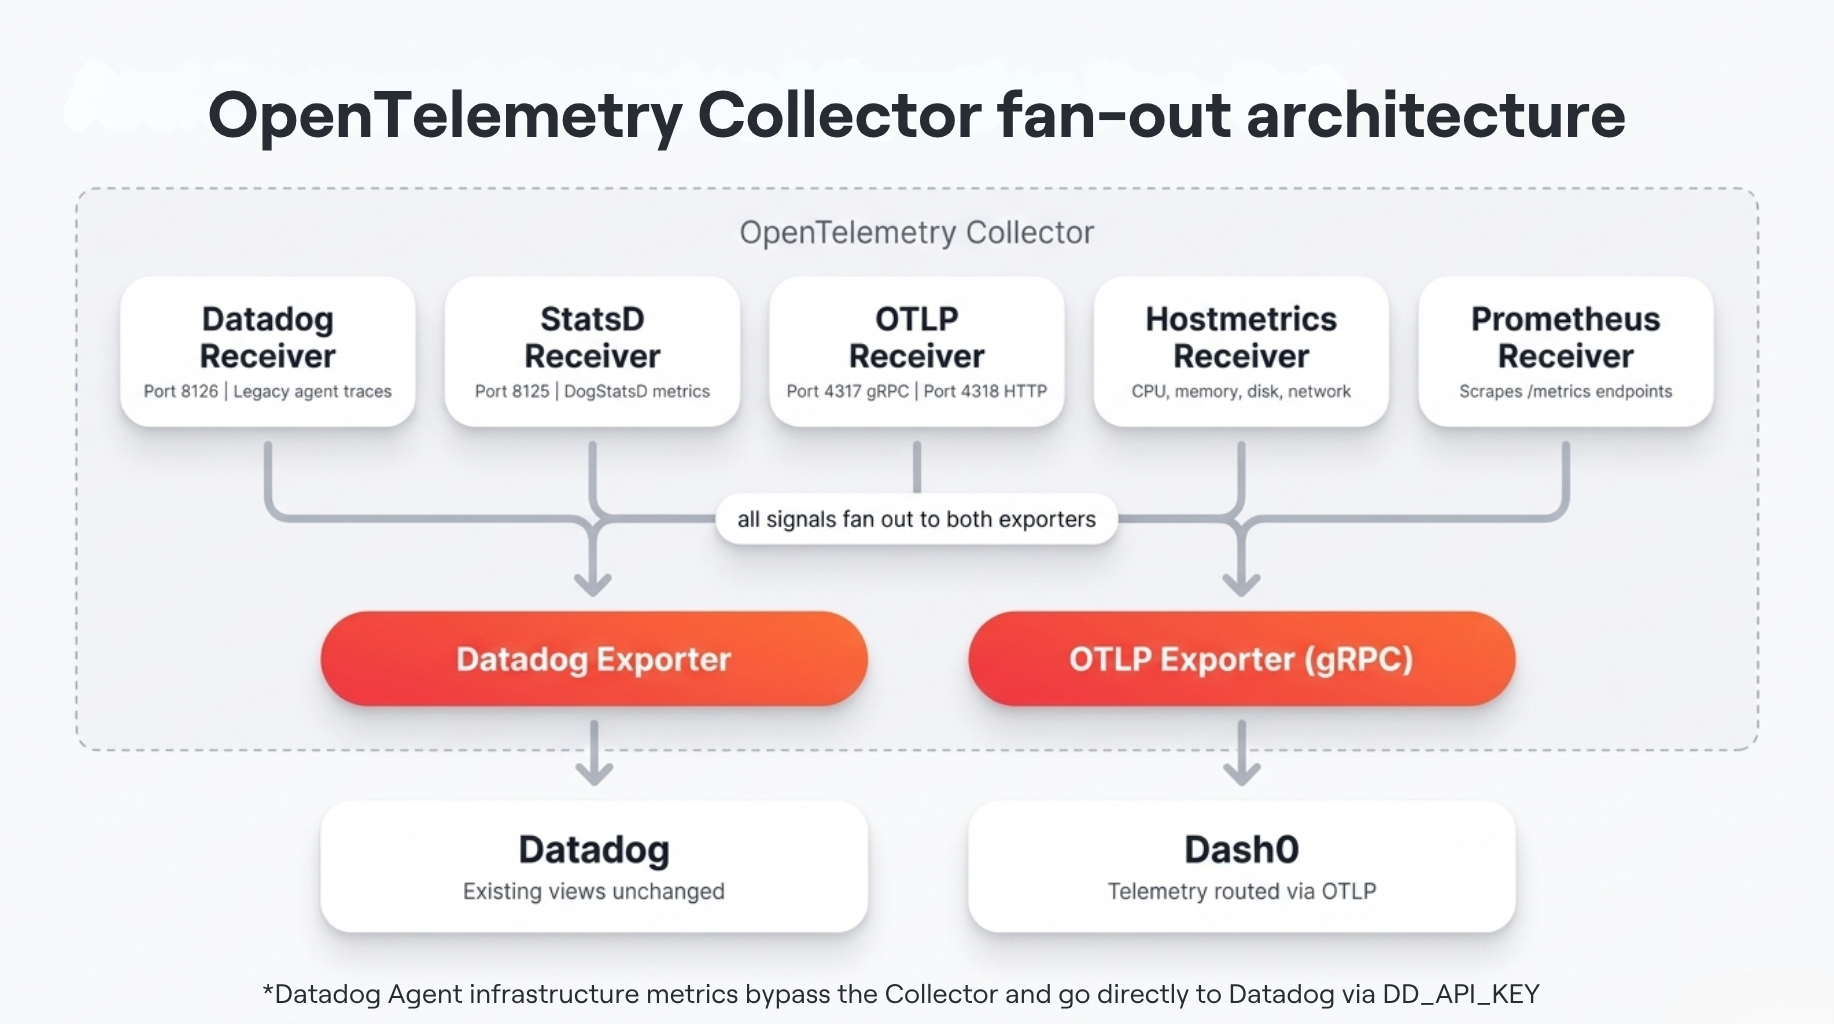
During Phases 1–6, both exporters are active. Datadog receives the same data it always did. Dash0 receives the same data in parallel. When you are ready to cut over, remove the Datadog exporter and decommission your Datadog Agents.
Phase 1: Deploy the Collector and enable fan-out
Estimated time: ~2 hours
This phase gets telemetry flowing to Dash0 without any application code changes.
Step 1: Install the Collector Contrib
Pull the Docker image:
1docker pull otel/opentelemetry-collector-contrib:0.151.0
For production, pin to a specific version rather than latest. The releases page lists all versions.
Step 2: Configure credentials
Your Dash0 OTLP ingress endpoint has the format:
1ingress.<REGION>.aws.dash0.com
Find the exact value for your organization under Settings → Endpoints. Store all credentials as environment variables, never hard-code tokens in config files:
1234export DASH0_ENDPOINT=ingress.<REGION>.aws.dash0.comexport DASH0_AUTH_TOKEN=<your-ingestion-token>export DASH0_DATASET=default #change only if you have created a dedicated dataset in your orgexport DD_API_KEY=<your-datadog-api-key>
Step 3: Configure the fan-out pipeline
This config accepts Datadog Agent traffic and native OTLP, and exports to both backends simultaneously. It is the starting point for migration. No application changes are required yet:
1234567891011121314151617181920212223242526272829303132333435363738394041424344454647484950515253545556575859606162636465666768697071727374757677787980818283848586878889# otel-collector.yamlextensions:health_check:endpoint: 0.0.0.0:13133receivers:# Accept existing Datadog APM Agent traces (no app changes required)datadog:endpoint: 0.0.0.0:8126# Accept native OTLP from services you migrate in Phase 2otlp:protocols:grpc:endpoint: 0.0.0.0:4317http:endpoint: 0.0.0.0:4318# Collect host-level metrics without any app changeshost_metrics:collection_interval: 10sscrapers:cpu:disk:load:filesystem:memory:network:# Accept DogStatsD/StatsD custom metrics (no app changes required)statsd:endpoint: 0.0.0.0:8125timer_histogram_mapping:- statsd_type: timingobserver_type: histogram- statsd_type: distributionobserver_type: histogramprocessors:# Detect host/container resource attributes automaticallyresourcedetection:detectors: [system, env]timeout: 5s# Batch before exporting to reduce connection overheadbatch:send_batch_size: 10000timeout: 10s# Convert Prometheus-style cumulative counters to delta for OTLP exportcumulativetodelta:exporters:# Keep sending to Datadog during the validation perioddatadog:api:key: ${env:DD_API_KEY}site: datadoghq.com# Send to Dash0 via OTLP/gRPCotlp_grpc/dash0:endpoint: ${env:DASH0_ENDPOINT}:4317headers:Authorization: Bearer ${env:DASH0_AUTH_TOKEN}Dash0-Dataset: ${env:DASH0_DATASET}service:extensions: [health_check]telemetry:metrics:readers:- pull:exporter:prometheus:host: 0.0.0.0port: 8888pipelines:traces:receivers: [otlp, datadog]processors: [resourcedetection, batch]exporters: [datadog, otlp_grpc/dash0]metrics:receivers: [otlp, host_metrics, statsd]processors: [resourcedetection, cumulativetodelta, batch]exporters: [datadog, otlp_grpc/dash0]logs:receivers: [otlp]processors: [resourcedetection, batch]exporters: [datadog, otlp_grpc/dash0]
Run the Collector:
1234567891011docker run -d \--name otel-collector \-p 4317:4317 -p 4318:4318 -p 8126:8126 -p 8125:8125/udp \-p 13133:13133 -p 8888:8888 \-e DD_API_KEY="${DD_API_KEY}" \-e DASH0_ENDPOINT="${DASH0_ENDPOINT}" \-e DASH0_AUTH_TOKEN="${DASH0_AUTH_TOKEN}" \-e DASH0_DATASET="${DASH0_DATASET}" \-v $(pwd)/otel-collector.yaml:/etc/otel-collector.yaml \otel/opentelemetry-collector-contrib:0.151.0 \--config /etc/otel-collector.yaml
Verify it is healthy:
1curl -s http://localhost:13133/
Step 4: Point application tracers at the Collector
Redirect your apps by setting two environment variables in each application's deployment environment:
12DD_AGENT_HOST=<collector-host>DD_TRACE_AGENT_PORT=8126
No changes to datadog.yaml or the Datadog Agent itself are required.
> Note: The datadog receiver is alpha stability in otelcol-contrib. It works well for migration, but pin your Collector version and don't assume the config surface or attribute mapping stays identical across releases.
Step 5 (optional): Bridge existing Prometheus metrics
If Prometheus already scrapes your services, add a prometheus receiver to the Collector config and route it through the existing otlp_grpc/dash0 exporter; no additional exporter is needed:
12345678receivers:prometheus:config:scrape_configs:- job_name: my-servicescrape_interval: 15sstatic_configs:- targets: [my-service:9090]
Then add prometheus to your service.pipelines.metrics receivers list alongside otlp, host_metrics, and statsd. The Collector converts the scraped Prometheus metrics to OTLP and forwards them to Dash0 via the existing exporter.
Step 6: Smoke-test the pipeline
You do not need a live Datadog account to validate the Collector configuration and the Dash0 export path.
Validate the config syntax: the Collector's validate subcommand loads and checks the config without starting any listeners or making any network connections. Pass placeholder values for secrets:
12345678docker run --rm \-e DD_API_KEY=placeholder \-e DASH0_ENDPOINT=ingress.<REGION>.aws.dash0.com \-e DASH0_AUTH_TOKEN=placeholder \-e DASH0_DATASET=placeholder \-v $(pwd)/otel-collector.yaml:/etc/otel-collector.yaml \otel/opentelemetry-collector-contrib:0.151.0 \validate --config /etc/otel-collector.yaml
A clean exit with no output means the config is valid.
Send synthetic traces to Dash0: once the Collector is running with real credentials, use telemetrygen to push OTLP spans through it and confirm they appear in Dash0:
123docker run --rm \ghcr.io/open-telemetry/opentelemetry-collector-contrib/telemetrygen:latest \traces --otlp-insecure --otlp-endpoint host.docker.internal:4317 --duration 10s
Linux note: host.docker.internal is only available on Docker Desktop (macOS and Windows). On Linux, add --network=host to the docker run command and replace host.docker.internal with localhost.
Open Dash0 and search for the telemetrygen service. Traces should appear within a few seconds. If they do not, inspect Collector logs (docker logs otel-collector) for export errors. The curl localhost:8888/metrics command in Phase 6 requires the service.telemetry.metrics section to be present in your config; without it the endpoint returns empty.
Note: The datadog receiver and exporter in the fan-out config require a real Datadog Agent and API key to exercise end-to-end. Everything else is fully testable without a Datadog account: OTLP ingestion, resource detection, batching, and export to Dash0.
Phase 2: Migrate application instrumentation
Estimated time: 1–2 days per service
With fan-out running, migrate services to native OpenTelemetry instrumentation one at a time. Start with the lowest-risk service and validate in Dash0 before moving to the next. For a complete reference on OTel SDK environment variables, see the OpenTelemetry environment variables guide.
Auto-instrumentation (no code changes)
OTel provides zero-code agents for most common runtimes. The auto-instrumentation documentation lists all supported frameworks. In every case, the application sends OTLP to the Collector, which handles the rest.
Jump to your language: Python · Node.js · Java · .NET · Ruby
Python
Install the distro and detect instrumentation libraries:
12pip install opentelemetry-distro opentelemetry-exporter-otlpopentelemetry-bootstrap -a install
Run the application:
123OTEL_SERVICE_NAME=my-service \OTEL_EXPORTER_OTLP_ENDPOINT=http://<collector-host>:4318 \opentelemetry-instrument python app.py
Node.js
Install the SDK and auto-instrumentation bundle:
1npm install @opentelemetry/sdk-node @opentelemetry/auto-instrumentations-node
Run the application:
123OTEL_SERVICE_NAME=my-service \OTEL_EXPORTER_OTLP_ENDPOINT=http://<collector-host>:4318 \node --require @opentelemetry/auto-instrumentations-node/register app.js
Java
Download the agent JAR:
1curl -LO https://github.com/open-telemetry/opentelemetry-java-instrumentation/releases/latest/download/opentelemetry-javaagent.jar
Run the application with the agent attached. See Dash0's Java auto-instrumentation guide for Spring Boot, Quarkus, and Micronaut specifics:
123OTEL_SERVICE_NAME=my-service \OTEL_EXPORTER_OTLP_ENDPOINT=http://<collector-host>:4318 \java -javaagent:/path/to/opentelemetry-javaagent.jar -jar your-app.jar
.NET
Install the auto-instrumentation tooling:
12curl -L -O https://github.com/open-telemetry/opentelemetry-dotnet-instrumentation/releases/latest/download/otel-dotnet-auto-install.shbash otel-dotnet-auto-install.sh
Run the application:
12345678OTEL_SERVICE_NAME=my-service \OTEL_EXPORTER_OTLP_ENDPOINT=http://<collector-host>:4318 \CORECLR_ENABLE_PROFILING=1 \CORECLR_PROFILER={918728DD-259F-4A6A-AC2B-B85E1B658318} \CORECLR_PROFILER_PATH=$HOME/.otel-dotnet-auto/linux-x64/OpenTelemetry.AutoInstrumentation.Native.so \DOTNET_ADDITIONAL_DEPS=$HOME/.otel-dotnet-auto/AdditionalDeps \DOTNET_SHARED_STORE=$HOME/.otel-dotnet-auto/store \dotnet your-app.dll
Platform note: The path above uses linux-x64. Replace with linux-arm64 for Linux ARM, osx-x64 or osx-arm64 for macOS, or win-x64 / win-arm64 for Windows (using OpenTelemetry.AutoInstrumentation.Native.dll instead of .so).
Ruby
Add the gems:
1gem install opentelemetry-sdk opentelemetry-exporter-otlp opentelemetry-instrumentation-all
Initialize in your application entrypoint (e.g. config/initializers/opentelemetry.rb for Rails):
12345678require 'opentelemetry/sdk'require 'opentelemetry/exporter/otlp'require 'opentelemetry/instrumentation/all'OpenTelemetry::SDK.configure do |c|c.service_name = 'my-service'c.use_allend
Run with:
12OTEL_EXPORTER_OTLP_ENDPOINT=http://<collector-host>:4318 \bundle exec rails server
Manual instrumentation: before and after
For services with custom spans built on Datadog's ddtrace or dd-trace-* libraries, the following shows the equivalent OTel API calls.
Python
Before (Datadog ddtrace):
1234567from ddtrace import tracer@tracer.wrap(service="payment-service", resource="process_payment")def process_payment(order_id: str):with tracer.trace("db.query") as span:span.set_tag("db.type", "postgresql")span.set_tag("order.id", order_id)
After (OpenTelemetry):
123456789from opentelemetry import tracetracer = trace.get_tracer("payment-service")def process_payment(order_id: str):with tracer.start_as_current_span("process_payment") as span:with tracer.start_as_current_span("db.query") as db_span:db_span.set_attribute("db.system.name", "postgresql")db_span.set_attribute("order.id", order_id)
Go
Before (Datadog dd-trace-go):
1234567import ddtracer "gopkg.in/DataDog/dd-trace-go.v1/ddtrace/tracer"span := ddtracer.StartSpan("process_payment",ddtracer.ServiceName("payment-service"),)span.SetTag("order.id", orderID)defer span.Finish()
After (OpenTelemetry):
123456789import ("go.opentelemetry.io/otel""go.opentelemetry.io/otel/attribute")tracer := otel.Tracer("payment-service")ctx, span := tracer.Start(ctx, "process_payment")span.SetAttributes(attribute.String("order.id", orderID))defer span.End()
Node.js
Before (Datadog dd-trace):
1234const tracer = require('dd-trace').init({ service: 'payment-service' })const span = tracer.startSpan('process_payment')span.setTag('order.id', orderId)span.finish()
After (OpenTelemetry):
12345const { trace } = require('@opentelemetry/api')const tracer = trace.getTracer('payment-service')const span = tracer.startSpan('process_payment')span.setAttribute('order.id', orderId)span.end()
Metrics: from DogStatsD to OpenTelemetry
The statsd receiver added in Phase 1 already handles your DogStatsD traffic. When you are ready to migrate to the native OTel Metrics API:
Before (DogStatsD):
1234from datadog import statsdstatsd.increment('payment.processed', tags=['method:card'])statsd.histogram('payment.duration_ms', duration)
After (OpenTelemetry Metrics API):
12345678from opentelemetry import metricsmeter = metrics.get_meter("payment-service")payment_counter = meter.create_counter("payment.processed")payment_duration = meter.create_histogram("payment.duration", unit="ms")payment_counter.add(1, {"method": "card"})payment_duration.record(duration_ms)
Setting resource attributes
Every service should emit at minimum service.name and deployment.environment.name as resource attributes. These drive service-level views and environment filtering in Dash0, and are the OTel equivalents of Datadog's service and env tags.
Via environment variables (applies to all OTel SDKs):
12OTEL_SERVICE_NAME=payment-serviceOTEL_RESOURCE_ATTRIBUTES=deployment.environment.name=production,service.version=1.4.2
Via the Python SDK (other languages follow the same pattern):
123456789from opentelemetry.sdk.resources import Resourcefrom opentelemetry.sdk.trace import TracerProviderresource = Resource.create({"service.name": "payment-service","service.version": "1.4.2","deployment.environment.name": "production",})provider = TracerProvider(resource=resource)
Phase 3: Migrate log collection
Estimated time: ~4 hours
Log collection is typically the last thing to migrate, as it depends on how logs reach the Datadog Agent: file tailing, Docker log driver, or direct API shipping.
File-based log collection
The Collector's filelog receiver tails log files and converts them to OTel log records:
1234567891011121314receivers:filelog:include:- /var/log/myapp/*.log- /var/log/nginx/access.logoperators:- type: json_parserif: 'body matches "^\\{"'timestamp:parse_from: attributes.timestamplayout: '%Y-%m-%dT%H:%M:%SZ'- type: movefrom: attributes.messageto: body
Add this receiver to the logs pipeline alongside the existing otlp receiver.
Bridging from Fluentd or Fluent Bit
The Collector's fluent forward receiver acts as a drop-in replacement for the Fluent Forward output plugin, so you can keep your existing log shippers and simply re-route their output.
Point your Fluent Bit or Fluentd output at the Collector:
12345# fluent-bit.conf[OUTPUT]Name forwardHost <collector-host>Port 24224
Add the receiver to your Collector config:
123receivers:fluentforward:endpoint: 0.0.0.0:24224
No changes to application logging code are required.
Phase 4: Kubernetes environments
Estimated time: ~4 hours (DaemonSet) or ~1 hour (Dash0 Operator)
Kubernetes deployments have two migration paths: running the Collector as a DaemonSet alongside your existing Datadog Agent (the manual approach), or installing the Dash0 Kubernetes Operator, which handles Collector deployment and pod auto-instrumentation automatically.
Choose your deployment path: Pick one of the two options below — you do not need both. The DaemonSet gives you direct control over Collector configuration and works with any Kubernetes cluster. The Dash0 Operator automates Collector deployment, pod instrumentation, and backend configuration through Kubernetes custom resources.
Collector as a DaemonSet
In Kubernetes, deploy the Collector as a DaemonSet so one Collector pod runs on each node, matching the Datadog Agent topology.
Create the namespace, ServiceAccount, and credentials:
12kubectl create namespace observabilitykubectl create serviceaccount otel-collector -n observability
1234567kubectl create secret generic datadog-secret \--from-literal=api-key="${DD_API_KEY}" \-n observabilitykubectl create secret generic dash0-secret \--from-literal=auth-token="${DASH0_AUTH_TOKEN}" \-n observability
Create a ConfigMap from the otel-collector.yaml you configured in Phase 1:
123kubectl create configmap otel-collector-config \--from-file=otel-collector.yaml \-n observability
DaemonSet manifest:
123456789101112131415161718192021222324252627282930313233343536373839404142434445464748495051525354555657apiVersion: apps/v1kind: DaemonSetmetadata:name: otel-collectornamespace: observabilityspec:selector:matchLabels:app: otel-collectortemplate:metadata:labels:app: otel-collectorspec:serviceAccountName: otel-collectorcontainers:- name: otel-collectorimage: otel/opentelemetry-collector-contrib:0.151.0args: ["--config=/conf/otel-collector.yaml"]ports:- containerPort: 4317- containerPort: 4318- containerPort: 8126- containerPort: 8125protocol: UDPenv:- name: DD_API_KEYvalueFrom:secretKeyRef:name: datadog-secretkey: api-key- name: DASH0_AUTH_TOKENvalueFrom:secretKeyRef:name: dash0-secretkey: auth-token- name: DASH0_ENDPOINTvalue: ingress.<REGION>.aws.dash0.com- name: DASH0_DATASETvalue: default- name: K8S_NODE_NAMEvalueFrom:fieldRef:fieldPath: spec.nodeNamevolumeMounts:- name: configmountPath: /conf- name: varlogmountPath: /var/logreadOnly: truevolumes:- name: configconfigMap:name: otel-collector-config- name: varloghostPath:path: /var/log
Add the k8sattributes processor to enrich all telemetry with pod, node, and namespace metadata:
1234567891011121314151617181920212223processors:k8sattributes:auth_type: serviceAccountpassthrough: falseextract:metadata:- k8s.namespace.name- k8s.deployment.name- k8s.statefulset.name- k8s.daemonset.name- k8s.node.name- k8s.pod.name- k8s.pod.uidlabels:- tag_name: app.kubernetes.io/namekey: app.kubernetes.io/namefrom: podpod_association:- sources:- from: resource_attributename: k8s.pod.ip- sources:- from: connection
Add k8sattributes to all three pipelines in your service.pipelines section.
The required ClusterRole and ClusterRoleBinding to allow the Collector to read pod metadata:
1234567891011121314151617181920212223apiVersion: rbac.authorization.k8s.io/v1kind: ClusterRolemetadata:name: otel-collectorrules:- apiGroups: [""]resources: [nodes, pods, namespaces]verbs: [get, list, watch]- apiGroups: [apps]resources: [replicasets, deployments, statefulsets, daemonsets]verbs: [get, list, watch]apiVersion: rbac.authorization.k8s.io/v1kind: ClusterRoleBindingmetadata:name: otel-collectorsubjects:- kind: ServiceAccountname: otel-collectornamespace: observabilityroleRef:kind: ClusterRolename: otel-collectorapiGroup: rbac.authorization.k8s.io
Using the Dash0 Kubernetes Operator
The Dash0 Kubernetes Operator simplifies the Kubernetes migration significantly. It auto-instruments all supported workload types in enabled namespaces by injecting OTel agents into pods at admission time, without changes to your Deployment manifests. It also manages the Collector internally.
Install with Helm:
12345678910111213helm repo add dash0-operator https://dash0hq.github.io/dash0-operatorhelm repo updatehelm install dash0-operator dash0-operator/dash0-operator \--version 0.140.0 \--namespace dash0-system \--create-namespace \--set operator.dash0Export.enabled=true \--set operator.dash0Export.endpoint=ingress.<REGION>.aws.dash0.com:4317 \--set operator.dash0Export.apiEndpoint=https://api.<REGION>.aws.dash0.com \--set operator.dash0Export.token="${DASH0_AUTH_TOKEN}" \--set operator.dash0Export.dataset="${DASH0_DATASET}" \--set operator.clusterName=<your-cluster-name>
Enable monitoring for a namespace:
123456789101112apiVersion: operator.dash0.com/v1beta1kind: Dash0Monitoringmetadata:name: dash0-monitoringnamespace: my-appspec:export:dash0:endpoint: ingress.<REGION>.aws.dash0.com:4317dataset: default # change only if you have created a dedicated dataset in your orgauthorization:token: <your-auth-token>
The Operator supports Java, Node.js, Python, and .NET (added in a recent release).
See Kubernetes Observability with the OTel Operator for full details and the supported workload types.
Phase 5: Translate dashboards and alerts
Estimated time: 1–2 weeks (varies by dashboard complexity)
Preserve dashboard compatibility with the transform processor
During the migration window your Datadog dashboards group by attribute names like service, env, and host. OTel uses service.name, deployment.environment.name, and host.name. The Collector's transform processor lets you create aliases at the pipeline level so you can migrate dashboards and instrumentation independently:
123456789101112131415processors:transform/dd-compat:error_mode: ignoretrace_statements:- context: resourcestatements:# Alias OTel resource attrs to Datadog tag names for legacy dashboard compatibility- set(attributes["service"], attributes["service.name"])where attributes["service"] == nil- set(attributes["env"], attributes["deployment.environment.name"])where attributes["env"] == nil- set(attributes["version"], attributes["service.version"])where attributes["version"] == nil- set(attributes["host"], attributes["host.name"])where attributes["host"] == nil
Add transform/dd-compat to your traces pipeline. Remove it once dashboards are updated to OTel attribute names. For a deeper reference on OpenTelemetry Transformation Language (OTTL) expressions and what the transform processor can do, see Mastering the OpenTelemetry Transform Processor and Mastering the OpenTelemetry Transformation Language (OTTL).
Datadog query syntax → PromQL
When rebuilding dashboards and alerts in Dash0, use the following patterns to convert Datadog queries to Prometheus Query Language (PromQL). If you have a complex Datadog query and are not sure how to express it in PromQL, Oracle, Agent0's PromQL assistant, can translate it for you directly in the UI. See Write Effective PromQL Queries for Dash0-specific guidance and Optimize PromQL Query Performance for large-scale environments.
| Datadog | PromQL |
|---|---|
| avg:system.cpu.user{host:web-*} | avg(system_cpu_user{host=~"web-.*"}) |
| sum:http.requests{service:api}.as_count() | sum(rate(http_requests_total{service_name="api"}[5m])) |
| p99:trace.web.request.duration{env:prod} | histogram_quantile(0.99, rate(trace_web_request_duration_bucket{deployment_environment_name="prod"}[5m])) |
| avg:system.mem.used{*} | avg(system_memory_usage{state="used"}) |
| sum:custom.payment.count{method:card} | sum(rate(custom_payment_count_total{method="card"}[5m])) |
| max:kubernetes.cpu.usage.total{kube_deployment:api} | max(container_cpu_usage_seconds_total{k8s_deployment_name="api"}) |
Key translation rules:
- Dots in metric names become underscores
- Tag filters use = instead of : in PromQL label selectors
- Wildcard matching uses =~ with regex: host:web-* → host=~"web-.*"
- Rate functions require an explicit time window: [5m]
- Percentiles require histogram_quantile() against _bucket metrics
- Datadog's env tag becomes deployment_environment_name in OTel
Phase 6: Validate before cutting over
Estimated time: 1–2 weeks
Run Datadog and Dash0 in parallel for at least one week (two is preferable) before reducing your Datadog footprint. Fan-out through the Collector means both backends receive identical data, so validation carries zero production risk.
What to verify in Dash0:
- Trace completeness: all expected services appear in the service map; root spans are present for sampled requests; span counts match between the two backends for the same time window
- Metric continuity: compare the same metric values across an identical time window in Datadog and Dash0; tolerate small differences from clock skew and sampling, not order-of-magnitude gaps
- Alert parity: re-create critical monitors in Dash0 PromQL; trigger them by sending synthetic traffic or temporarily lowering thresholds to confirm they fire correctly
- Log correlation: open a trace in Dash0 and confirm correlated logs are linked via trace_id; this requires that your log pipeline emits trace_id and span_id fields alongside log records
- Resource attributes: confirm service.name, deployment.environment.name, and Kubernetes k8s.* attributes appear correctly on spans and metrics
During this period, Agent0, Dash0's agentic AI, can help you investigate unfamiliar telemetry in natural language. If a service's trace structure looks different after migrating from Datadog's agent to native OTLP, you can ask Agent0 to explain what it sees and surface instrumentation gaps without writing PromQL from scratch.
Monitor Collector export health to catch any errors before cutting over:
1curl -s http://localhost:8888/metrics | grep otelcol_exporter
A non-zero otelcol_exporter_send_failed_spans_total or otelcol_exporter_send_failed_metric_points_total indicates a problem with the Dash0 exporter that should be resolved before proceeding.
Phase 7: Cut over
Estimated time: hours to days (incremental)
Cut over in this order to minimize blast radius and allow incremental contract reduction:
- Stop exporting traces to Datadog: traces are typically the largest cost driver; removing this first reduces the Datadog bill immediately
- Stop exporting metrics to Datadog: remove the Datadog exporter from the metrics pipeline
- Stop exporting logs to Datadog: remove the Datadog exporter from the logs pipeline
- Decommission Datadog Agents on migrated hosts
- Remove the datadog receiver from the Collector once all application tracers send native OTLP
- Downscale or cancel your Datadog contract
Each step is independent. It is common to handle traces and metrics in weeks 1–2 and treat log pipeline migration as a separate workstream over a longer window.
Reference: Datadog → OpenTelemetry attribute mapping
Datadog uses its own attribute conventions across agents, APM, and infrastructure. OTel uses semantic conventions maintained as part of the specification. Dash0 ingests OTel semantic convention attributes natively and automatically migrates schema versions as the spec evolves, so you do not need to update dashboards when OTel renames an attribute.
| Datadog | OpenTelemetry semantic convention |
|---|---|
| service | service.name (resource attribute) |
| env | deployment.environment.name (resource attribute) |
| version | service.version (resource attribute) |
| host | host.name (resource attribute) |
| span.type | SpanKind property (SERVER, CLIENT, PRODUCER, CONSUMER, INTERNAL); a span property, not a key/value attribute |
| http.method | http.request.method |
| http.url | url.full |
| http.status_code | http.response.status_code |
| db.type | db.system.name (note: older OTel SDKs may emit db.system; Dash0 automatically migrates attribute names to current semconv as data arrives) |
| db.statement | db.query.text |
| db.instance | db.namespace |
| db.operation | db.operation.name |
| error (boolean) | SpanStatus = ERROR (set via SetStatus) + exception event with exception.type, exception.message, exception.stacktrace |
| peer.hostname | server.address |
| peer.port | server.port |
Final thoughts
Migrating from Datadog to OpenTelemetry is a pipeline replacement, not a rewrite. The OpenTelemetry Collector bridges both worlds from day one: it accepts your existing Datadog Agent traffic, routes it to both Datadog and Dash0 in parallel, and gives you a controlled migration window to move service instrumentation, log collection, dashboards, and alerts at your own pace.
The core sequence:
- Deploy the Collector Contrib and configure the fan-out pipeline; Datadog keeps running while Dash0 starts receiving live production data
- Validate Dash0 with 1–2 weeks of parallel data
- Migrate application instrumentation service by service, using auto-instrumentation where possible
- Translate dashboards and alerts to PromQL using the attribute mapping tables above
- Cut over, decommission Datadog Agents, and reduce the contract
Once services emit native OTLP, the backend is a configuration change. And because Dash0 is built on open standards, SIFT, Dash0's observability framework, can immediately begin removing telemetry noise, surfacing instrumentation gaps and improving signal quality on your OTel data, without any additional configuration.
Continue reading:
- For background on why vendor-neutral instrumentation matters, see Breaking Free: Avoiding Vendor Lock-In with Open Observability Standards.
- OpenTelemetry Collector documentation
- OTel Collector Contrib: all receivers and exporters
- OpenTelemetry semantic conventions
- Auto-instrumentation by language
- OpenTelemetry Collector: Beginner's Guide (Dash0)
- A Practical Guide to the OTel OTLP Receiver (Dash0)
- OpenTelemetry Filelog Receiver Guide (Dash0)
- Bridging Fluentd to OpenTelemetry with Fluent Forward (Dash0)
- OpenTelemetry Auto-instrumentation in Java (Dash0)
- Kubernetes Observability with the OTel Operator (Dash0)
- Dash0 Kubernetes Operator
- Write Effective PromQL Queries (Dash0)
- Mastering the OpenTelemetry Transform Processor (Dash0)
- Mastering the OpenTelemetry Transformation Language (OTTL) (Dash0)
- A Practical Guide to Agentic Observability in Dash0 (Dash0)