Last updated: January 5, 2026
Mastering the OpenTelemetry Memory Limiter Processor
The OpenTelemetry Collector plays a critical role in any modern observability stack. Like any high-traffic service, it has resource limits.
A sudden data surge or a memory-heavy processor can push it beyond those limits, potentially consuming all available memory and causing the Collector to crash.
The memory limiter processor guards against this kind of failure by continuously monitoring the Collector’s memory usage and stepping in once usage crosses a configured threshold. Instead of letting the process crash, it temporarily slows down data ingestion to give the system room to recover.
In this guide, you’ll learn what the memory limiter does, how to configure it
for different environments, why it works best alongside Go's GOMEMLIMIT
setting, and what metrics to track to prove that it works.
Let's get started!
Why collector memory usage can spike
Before setting memory limits, it’s helpful to understand what drives high memory usage in the Collector. Several common factors can cause spikes:
-
Sudden traffic surges: A burst of logs, metrics, or traces from your applications can overwhelm the Collector’s ability to process and export data. This causes internal buffers to grow and memory consumption to rise.
-
Buffering components: Processors like batch, or exporters with queuing enabled (such as otlphttp), hold data in memory by design, often aggressively. If a downstream service is slow or unreachable, these buffers can grow quickly.
-
Resource-intensive processing: Some processors, like
transformwith heavy regex use orspanaggregating trace data, consume more memory per operation. These costs add up quickly under load. -
High cardinality: Although often a backend issue, high-cardinality data can also impact the Collector. If processors handle many unique attributes or labels, memory usage can also rise significantly.
The memory limiter acts as a circuit breaker, stepping in when memory use climbs too high to help prevent a crash.
How the memory limiter works
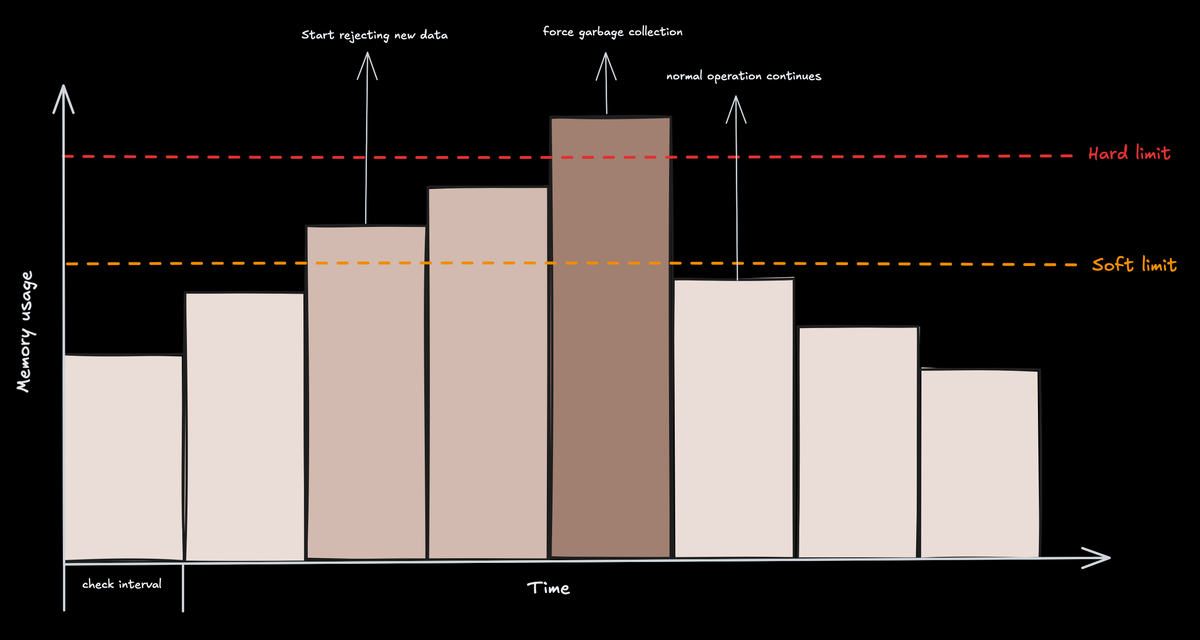
The processor operates on a simple but effective two-level threshold system: a soft limit and a hard limit. You can think of it as traffic management for your data pipeline
-
🟢 Normal operation: As long as memory usage stays below the soft limit, data flows unimpeded.
-
🟡 Soft limit reached: Once memory usage exceeds the soft limit, the limiter starts throttling. It refuses incoming data from receivers by sending back a non-permanent error. This backpressure gives the Collector time to recover. The soft limit is calculated as
limit - spike_limit. -
🔴 Hard limit reached: If memory usage continues to climb and crosses the hard limit (defined by
limit_miborlimit_percentage), the processor takes more aggressive action. In addition to refusing data, it forces the Go runtime to perform a garbage collection (GC) cycle. This is a last-resort attempt to reclaim memory and prevent an OOM crash. Once memory usage falls back below the soft limit, the Collector returns to normal operation.
Note that the limiter relies on upstream components to correctly handle its retryable errors. Standard OpenTelemetry receivers already do this, but if you're using custom components, ensure that they can buffer or retry rejected data to prevent data loss.
Quick start: a basic safety net
The memory limiter is essential in any production Collector setup. For it to work properly, it must be the first processor in each pipeline. This allows it to apply backpressure directly to receivers before any downstream processing increases memory usage.
Below is a simple configuration for a Collector running on a system with 4 GB of available memory:
1234567891011121314151617181920processors:memory_limiter:# Check memory usage every 5 seconds.check_interval: 5s# The hard memory limit for the Collector's heap.# Set to a value safely below the total memory available to the process.limit_mib: 3500# The size of the "buffer" zone.# The soft limit will be (3500 - 500) = 3000 MiB.spike_limit_mib: 500service:pipelines:traces:receivers: [otlp]# memory_limiter MUST be the first processor.processors: [memory_limiter, batch]exporters: [otlp]
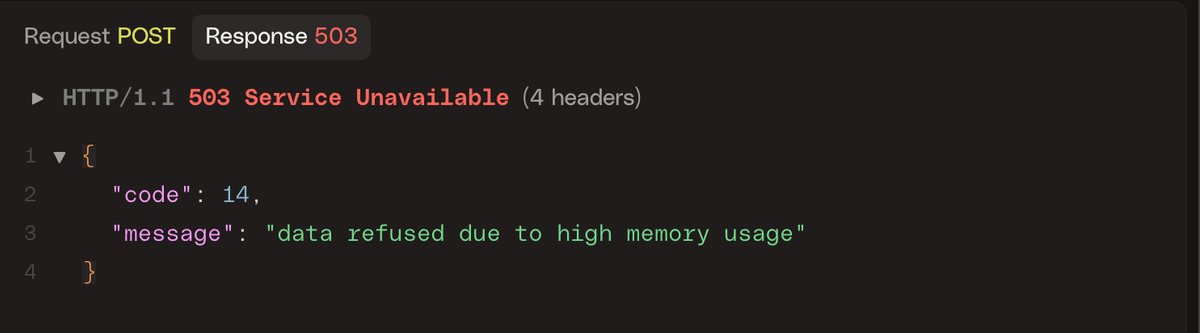
This setup enforces a hard memory limit of 3500 MiB and a soft limit of 3000 MiB, with memory checks running once every five seconds. The client will see an error that looks like the one below when the limit is enforced:
Memory limiter configuration deep dive
Let’s break down the key memory limiter settings and when to use each.
1. check_interval
This setting controls how frequently the processor checks the Collector’s memory
usage. By default, it’s disabled (0s), but for most environments, a one-second
interval is recommended.
Using a shorter interval, such as under one second, allows the limiter to react more quickly to sudden spikes in memory use, though it introduces a slight increase in CPU overhead.
On the other hand, using a longer interval reduces that overhead but means the
limiter needs a larger buffer (via the spike_limit) to safely absorb memory
growth between checks.
2. limit_mib vs limit_percentage
The hard memory limit can be configured using either limit_mib or
limit_percentage, but not both.
The limit_mib option sets a fixed memory cap in mebibytes (MiB) and is best
suited for environments with consistent memory allocation, such as virtual
machines or physical servers.
In contrast, limit_percentage defines the limit as a percentage of available
system memory and is only supported on Linux systems that use cgroups, such as
containers. This makes it ideal for Kubernetes or Docker deployments where
memory limits may change dynamically.
For instance, if a container is assigned 2 GiB of memory and limit_percentage
is set to 80, the memory limiter will automatically calculate a hard limit of
1638 MiB.
3. spike_limit_mib vs spike_limit_percentage
These options define the size of the buffer between the soft and hard limits.
You can specify this buffer either as a fixed value in MiB (spike_limit_mib)
or as a percentage of total memory (spike_limit_percentage).
In general, the buffer should be large enough to absorb expected surges in memory usage between checks. A good starting point is about 20 percent of your hard limit.
If your workload involves sharp traffic spikes or unpredictable load patterns, increasing this buffer can give the limiter more time to respond effectively and prevent an out-of-memory crash.
Integrating GOMEMLIMIT with the memory limiter
For a truly robust production deployment, the memory limiter processor should be
used in tandem with the GOMEMLIMIT environment variable as they provide two
complementary layers of defense.
GOMEMLIMIT is a feature of the Go runtime,
not the OpenTelemetry Collector itself. It acts as a soft cap on memory usage,
guiding the garbage collector (GC) to free memory more aggressively as usage
approaches the specified limit. This helps smooth out memory growth and reduces
the chance of sudden spikes. In effect, it’s a proactive measure that keeps
memory consumption in check before it becomes a problem.
The memory limiter, on the other hand, operates at the application level. It serves as a circuit breaker that steps in when memory usage has already exceeded a defined threshold. If garbage collection alone isn't enough to rein in memory growth, the memory limiter provides a safety net by throttling data and triggering additional GC cycles. This makes it a reactive safeguard that kicks in only when needed.
Using both together creates a strong defense. GOMEMLIMIT reduces the
likelihood of ever hitting the memory limiter’s threshold, while the limiter
ensures the Collector remains stable if memory usage suddenly spikes beyond what
the Go runtime can handle on its own.
As a best practice, set GOMEMLIMIT to about 80 to 90 percent of the memory
limiter’s hard limit. This gives the runtime enough room to manage memory before
the limiter has to take action.
In a Kubernetes deployment, for example, if you allocate 2 GiB of memory to the
Collector container, you can set GOMEMLIMIT to approximately 1843 MiB (90
percent of 2 GiB). The memory limiter’s configuration would then use a hard
limit slightly above that, such as 1900 MiB.
Here's what that might look like in practice:
123456789101112131415161718192021apiVersion: apps/v1kind: Deploymentmetadata:name: otel-collectorspec:template:spec:containers:- name: otel-collector# Request and limit memory for the containerresources:requests:memory: "1Gi"limits:memory: "2Gi"env:# Set GOMEMLIMIT to 90% of the 2Gi limit (approx 1843MiB)- name: GOMEMLIMITvalue: "1843MiB"# The Collector config would then use limit_percentage# or a corresponding limit_mib (e.g., 1900MiB)
Verifying and monitoring the limiter
To ensure the memory limiter is working as intended, you can monitor both the Collector's logs and its internal metrics.
Reviewing collector logs
When the memory limiter activates, it writes clear log messages that indicate when throttling starts, when a forced garbage collection is triggered, and when normal operation resumes. For example:
12345678# Throttling begins after crossing the soft limitinfo memorylimiter/memorylimiter.go:102 Memory usage is above soft limit, refusing data. {"kind": "processor", "name": "memory_limiter", "data_type": "traces", "memory_usage": "3052MiB", "soft_limit": "3000MiB"}# Garbage collection is forced after exceeding the hard limitinfo memorylimiter/memorylimiter.go:121 Memory usage is above hard limit, forcing GC. {"kind": "processor", "name": "memory_limiter", "memory_usage": "3515MiB", "hard_limit": "3500MiB"}# Throttling ends once memory drops below the soft limitinfo memorylimiter/memorylimiter.go:135 Memory usage is now below soft limit, resuming normal operation. {"kind": "processor", "name": "memory_limiter", "memory_usage": "2890MiB", "soft_limit": "3000MiB"}
These logs confirm that the limiter is actively monitoring memory and responding as designed. Watching for these messages is the most direct way to verify the limiter’s behavior.
Monitoring collector metrics
You should also monitor the Collector's internal metrics alongside its logs to see a real-time view of memory pressure. These metrics can be scraped using Prometheus or exported to an OTLP endpoint,
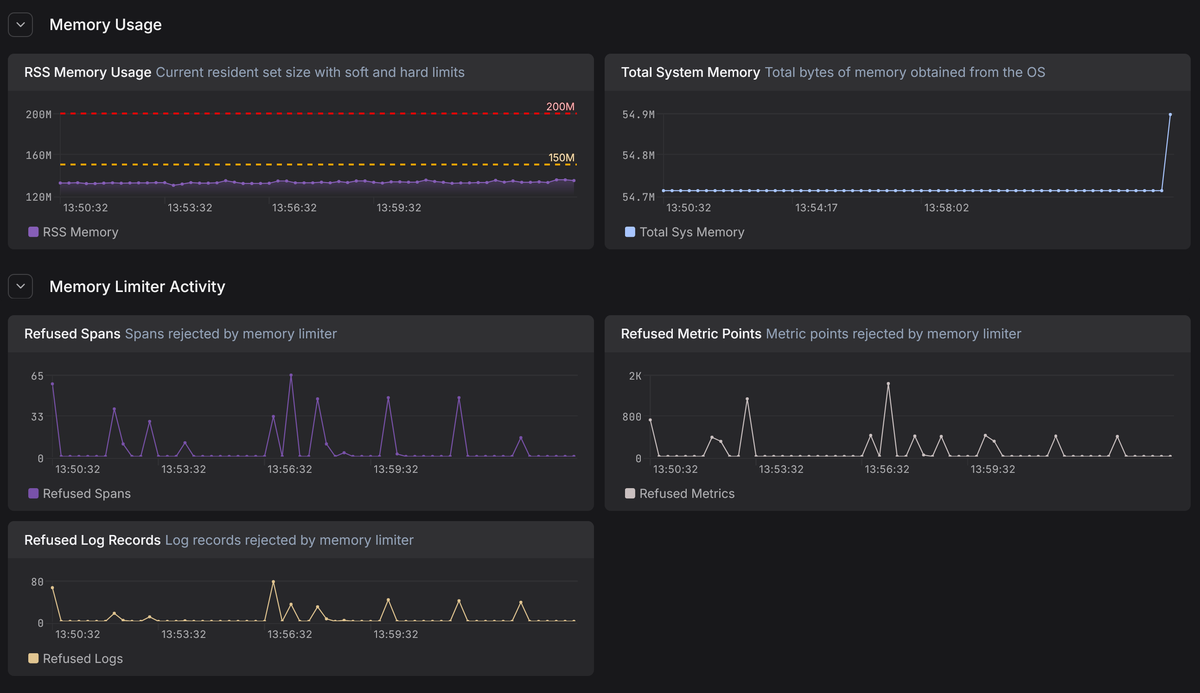
The key metrics to watch are:
otelcol_process_memory_rss: The current resident set size (RSS) memory usage of the Collector in bytes.otelcol_process_runtime_total_sys_memory_bytes: The total bytes of memory obtained from the operating system.otelcol_processor_refused_spans/otelcol_processor_refused_log_records/otelcol_processor_refused_metric_points: These counters track the volume of data blocked by the memory limiter. A rising count here confirms the limiter is actively shedding load to prevent a crash.
By plotting these metrics over time and drawing lines for your configured soft and hard limits, you can get a clear visual representation of how close the Collector is to its limits and how effectively the processor is capping memory usage.
In Dash0, these internal Collector metrics live alongside your application telemetry, making it easy to correlate memory pressure in the Collector with upstream traffic spikes, noisy services, or downstream exporter slowdowns. Instead of guessing why the memory limiter is firing, you can see the cause directly.
If you notice the "refused" metrics incrementing frequently, it means your Collector is constantly throttling ingestion to survive. This is a strong signal that your Collector cluster needs more capacity.
Key takeaways and best practices for production readiness
Before you lock in a Collector configuration and call it production-ready, keep these best practices is mind for the memory limiter processor:
-
Treat it as mandatory. Running a Collector without a memory limiter is a gamble with your data pipeline's stability. In production, this processor is the primary safeguard standing between a sudden traffic surge and an OOM crash that kills the entire process.
-
Position matters. The limiter must sit at the front of your processing pipeline to reject excess data before it consumes memory. If you place it after other processors, you are wasting resources processing data that the limiter might eventually drop anyway.
-
Pair it with GOMEMLIMIT to manage the Go runtime's garbage collection aggressively before the limiter ever needs to step in. This combination creates a safety net where the limiter only activates when the runtime is truly overwhelmed.
-
Match the config to the infrastructure. One size does not fit all. Use
limit_mibfor predictable, static environments like VMs , but switch tolimit_percentagefor containerized environments like Kubernetes so that safety thresholds scale automatically without manual reconfiguration. -
A working limiter prevents crashes, but frequent throttling means you're actively refusing telemetry data. If your metrics show constant refusals, don't just increase the limits—treat it as a capacity signal to scale your cluster or reduce upstream volume.
Final thoughts
Using the memory limiter processor effectively can be the difference between a fragile pipeline and a resilient observability stack.
By properly tuning these thresholds and verifying them with metrics, you'll ensure that your OpenTelemetry Collector acts as a stable foundation rather than a bottleneck, capable of handling unpredictable traffic spikes without crashing.
Try Dash0 today to observe your OpenTelemetry Collectors and catch memory pressure before it turns into data loss or downtime.
