Last updated: February 12, 2026
OpenTelemetry Signals Overview: Logs vs Metrics vs Traces
When an alert fires in the middle of the night, the first question is always “why?”. Answering that question quickly is often the difference between a minor incident and a major outage.
That's where observability comes in with its three major signals: logs, metrics, and traces. You can think of them as three complementary views into your system’s behavior:
- Metrics show how the system is behaving over time. They reveal saturation, error rates, latency shifts, and performance degradation before users complain.
- Traces explain where a request spent its time. They follow a single operation across services and dependencies, making bottlenecks and unexpected hops visible.
- Logs record what happened at specific moments. They provide the fine-grained detail needed to explain decisions, failures, and edge cases.
Collecting these signals in isolation is not enough. Observability comes from linking them through shared context so that you can ask “what’s happening?” and actually get a clear, actionable answer.
This article aims to be your definitive resource for solving the logs vs. metrics vs. traces puzzle by showing you how to use them together to understand failures quickly and act with confidence.
What are metrics?
Metrics are numerical values that represent the state or of a system at a given point in time.
Each data point is timestamped and usually annotated with attributes (also known as labels). These are key-value pairs that provide the context necessary allowing metrics to be sliced, grouped, and compared meaningfully.

Because metrics are numeric and structured, they are inherently aggregatable. You can sum them, average them, or roll them up across time windows and dimensions. This makes their storage footprint predictable and their queries fast, even over long time ranges.
That efficiency is why metrics sit at the core of dashboards. They're well suited for visualizing trends like traffic growth, rising latency, or increasing error rates without incurring the cost of storing every individual event.
Metrics also underpin traditional monitoring practices, where the goal is to detect known failure modes by triggering alerts when the system crosses predefined thresholds.
In infrastructure monitoring, this often involves tracking vital signs like resource utilization and saturation. For instance, sustained CPU usage above 90 percent or disk space falling below 10 percent could be a warning sign that something will break soon.
At the application level, metrics track the health of services through indicators such as request rate, error rate, throughput, and latency distributions. These are the signals most teams rely on to understand whether a service is meeting its performance and reliability goals.

Metrics do have limits. They tell you that something is wrong, but rarely explain why. A sudden spike in errors is easy to spot, but the metric alone usually cannot tell you which request failed, which code path was taken, or what downstream dependency caused the issue.
Labels can add some context, but metrics systems struggle with high-cardinality data. Tracking values like user IDs, request IDs, or payload-specific attributes quickly becomes expensive and slow, which means the most useful details are often left out.
Another constraint is that metrics must be defined ahead of time. If an incident exposes a behavior you were not measuring, you cannot retroactively analyze it. You have to add a new metric, redeploy, and hope the issue occurs again to collect relevant data.
And while metrics are excellent for visualizing high-level trends, they often miss edge cases. For instance, you might open your dashboard, see an average latency of 200ms and think everything is fine. But averages can lie, often hiding the painful truth that a small group of users are experiencing 3-second response times.
So, you get smarter and use percentiles (p95, p99). Now you can see the outliers, but you’re still left with a question: what makes those specific requests so slow?
To get that answer and follow one of those slow journeys from start to finish, you need more than an aggregate. You need a trace.
What are traces?
While metrics tell you how a system behaves in aggregate, traces describe the story of a single request from start to finish.
A trace follows one request from the moment it enters the system until it completes, crossing service boundaries, databases, caches, and message queues along the way. Instead of summarizing behavior, tracing preserves the full execution path so you can see exactly how that request was handled.
Each trace is made up of spans, which represent a single unit of work with a start time and duration, such as an incoming HTTP request, a database query, or a call to a downstream service.

Spans are linked together in a parent child structure that reflects causality. This hierarchy shows which operations triggered others and how time is distributed across them. When a request is slow, the trace makes it immediately obvious where the time went.
For example, if one service dominates the timeline or a dependency stalls, it stands out visually. That's why tracing is so effective for diagnosing latency issues and partial failures in distributed systems. You are no longer guessing which component might be responsible. You can see it immediately.
Unlike metrics, traces work well with high cardinality data. Spans can carry request specific attributes such as transaction IDs, user identifiers, query parameters, or structured events attached to a precise point in time. This context is often exactly what you need to understand why an outlier behaved differently from the rest.
Tracing also surfaces architectural inefficiencies. Repeated sequential calls, hidden fan out, or unnecessary round trips become visible when you look at real execution paths instead of averages. These patterns are difficult to infer from metrics alone.
But there are practical tradeoffs with traces. To produce a coherent end to end view, every service involved in handling a request must be instrumented to create spans and propagate context. If even one component is missing this instrumentation, the trace breaks, and the resulting picture can be incomplete or misleading.
Modern standards and tooling such as OpenTelemetry have reduced much of the toil around instrumentation and sampling, but distributed tracing still requires more deliberate integration effort across all parts of the system compared to logs and metrics.
Tracing also tends to generate a large volume of data because it records every step of a request in detail. Each hop across services, every database call, and each internal operation produces a span with timing and contextual metadata. In busy systems, this quickly multiplies into millions of spans per second.
Capturing every request end to end is therefore often too expensive, so most systems rely on sampling. Only a subset of requests is recorded, selected using predefined rules or dynamic conditions such as errors or unusually high latency. This keeps overhead and storage costs under control while still retaining enough representative detail to investigate real failures and performance issues when they matter.
A distributed trace can show which service or operation is failing, but to understand why, you may need to zoom in further. That’s where logs come in with detailed error messages, stack traces, and other runtime context.
What are logs?
Logs are the most traditional form of telemetry: timestamped records of discrete events that provide a detailed, chronological commentary on your system’s behavior
Each log entry captures the context of a specific event, ranging from critical errors to routine operational messages like service startups or configuration changes.
Modern observability practices strongly favor structured logging, where logs are emitted in machine-readable formats like JSON instead of free form text:
123456789{"level": "info","message": "incoming GET request to /","method": "GET","request_id": "0f914569-0e06-4ab0-ba48-0dc800ebfb1b","timestamp": "2025-05-28T09:25:37.582Z","url": "/","user_agent": "curl/8.5.0"}
The primary strength of logs is the depth of context they provide during troubleshooting. Metrics indicate that something is wrong, traces show where it occurred, and logs explain why by capturing the details behind a specific event or decision.
Since structured logs can capture highly cardinal values across a large number of dimensions (unique properties), they're immensely helpful for investigating rare failures, isolating a single user’s behavior, or understanding edge cases that disappear in aggregates.
However, that usefulness depends heavily on the quality of the logging instrumentation itself. Since logs only contain what you chose to record, it means you need to anticipate what information will matter when troubleshooting long before that failure happens.
This creates an ongoing tension between signal and noise. Sparse logging with little context leads to vague, unactionable messages, while excessive logging produces large volumes of low value data that increase costs and obscure the events that actually matter.
Logs also degrade over time. As systems evolve, logging statements can drift away from reality, become misleading, or lose relevance, and they need the same level of maintenance as any other part of the codebase.
These problems compound when logging is treated as an afterthought, but when treated as an engineering discipline, it becomes a high fidelity signal that completes the observability picture rather than cluttering it.
How OpenTelemetry unifies logs, metrics, and traces
Modern observability isn’t just about collecting these three signals in isolation. It’s about connecting them, enriching them with shared context, and building a cohesive picture of your system’s behavior.
A log entry on its own can tell you that something failed. That same log, automatically linked to the trace that triggered it, shows you the exact request and execution path involved. When the metrics produced by that request are also connected, you can see how often the problem occurs, how severe it is, and whether it is isolated or systemic.
This is precisely the problem OpenTelemetry (OTel) was designed to solve. Its main goal is to ensure telemetry data is consistent, connected, and portable across tools and vendors.
OpenTelemetry provides a shared data model, vendor neutral SDKs for all major languages, and automatic instrumentation for widely used frameworks. At the center is the OpenTelemetry Collector, which receives telemetry from your services, enriches it with context, and routes it to one or more backends.
The result is a unified observability pipeline that avoids vendor lock in and keeps your options open as your needs evolve.
Next, let’s look at a few concrete benefits of adopting OpenTelemetry as your observability framework.
1. Baseline coverage with automatic instrumentation
One of the biggest hurdles to observability is the instrumentation effort required to gather the signals in the first place. OpenTelemetry addresses this common challenge with automatic (or zero-code) instrumentation.
For widely used runtimes such as Java, Python, Node.js, and .NET, OpenTelemetry provides SDKs that can be enabled with little to no application code changes.
Once enabled, these SDKs automatically instrument common components like web frameworks, HTTP clients, database drivers, and messaging libraries:
12345# This is all that's needed to instrument any Node.js app for tracing and metricsnpm install --save @opentelemetry/apinpm install --save @opentelemetry/auto-instrumentations-nodeOTEL_SERVICE_NAME=myapp node--require @opentelemetry/auto-instrumentations-node/register index.js
The result is immediate visibility into request lifecycles and service interactions without requiring teams to manually add spans or metrics everywhere. You get traces that show how requests flow through your system, basic metrics for throughput and latency, and correlated logs where supported.
This automatic coverage establishes a strong baseline. From there, you can layer in manual instrumentation only where it adds real value, such as around critical business logic or domain-specific operations.
2. Automatic cross-signal correlation
With OpenTelemetry, correlation between logs, metrics, and traces is built in rather than bolted on later.
When a request enters an instrumented service, OpenTelemetry generates a trace ID. As the request moves across process and service boundaries, that trace ID and the active span ID are automatically propagated through request headers using standardized context propagation.
Any telemetry emitted while that context is active inherits it: traces link spans across services, metrics can be attributed to the same request path, and logs produced using an OpenTelemetry-aware logging library are automatically stamped with the correct trace and span identifiers.
This creates immediate, out of the box correlation where you can jump from a slow span directly to the logs emitted during that operation, or start from an error log and pivot straight to the distributed trace that triggered it:
Instead of treating logs, metrics, and traces as separate "pillars", OpenTelemetry ensures they describe the same behavior from different perspectives, using shared context as the connective tissue.
3. Consistent enrichment with resource attributes
Knowing a request failed is one thing; knowing it failed in the payment-service, running in the eu-west-1 region, on version v1.2.3 of your application provides actionable insight.
OpenTelemetry lets you define this kind of foundational metadata for your services using resource attributes. These attributes describe the environment the telemetry comes from, such as service name, deployment region, runtime, or application version.
Once defined, resource attributes are automatically attached to every signal emitted by the application, allowing you to focus only adding event-specific context at the point of instrumentation, knowing that the foundational metadata is already handled.

4. A unified pipeline with the SDK, Protocol, and Collector
OpenTelemetry aims not only to standardize individual signals, but to unify the entire telemetry pipeline, from data generation inside your services to delivery into an observability backend,
Applications use a single, vendor neutral SDK to emit logs, metrics, and traces using a shared data model and a common wire format, OTLP, without embedding any assumptions about the destination backend.
The data is then received by the OpenTelemetry Collector, which runs outside the application and acts as the control point for processing, enriching, sampling, filtering, and routing data to one or more backends.

This separation allows backend choices to change over time without requiring long migration phases, turning telemetry delivery into a configuration concern rather than an application level dependency.
The Collector also supports incremental adoption by ingesting legacy formats such as Prometheus metrics, Jaeger traces, and unstructured logs alongside native OpenTelemetry data.
Together, the SDK, protocol, and Collector form a unified pipeline where telemetry is emitted once, remains correlated across signals, and can be delivered flexibly as observability needs evolve.
5. Semantic conventions for shared meaning
Standardizing formats and transport is only part of the problem; telemetry also needs shared meaning. A latency metric called duration, request_time, or latency_ms might all represent the same idea, but without agreement, they cannot be reliably queried, compared, or reused across tools and teams.
This is where semantic conventions come in. They're used to describe how common concepts should be represented across signals, including HTTP requests, database calls, messaging systems, cloud infrastructure, runtimes, and deployment metadata.
For example, an HTTP request span will consistently use attributes such as http.request.method, http.route, and http.response.status_code. A database span will use standardized attributes for system type, statement, and operation. Metrics derived from these operations follow the same naming and labeling conventions.
This consistency has several practical benefits:
- Dashboards, alerts, and queries can be reused across services and languages without changes,
- Tooling can apply smart defaults because it inherently understands what a field represents,
- Teams can reason about telemetry from unfamiliar services without first decoding bespoke naming schemes.
How logs, metrics, and traces work together
Understanding logs vs. metrics vs. traces is not about picking a winner. It's about using each signal for what it does best and letting them guide you from symptom to cause.
A typical investigation starts with an alert derived from your metrics.
Imagine you operate an e commerce platform and receive an alert stating that the error rate for the /api/recommendations endpoint has exceeded five percent over the last five minutes. You open your metrics dashboard and immediately see two things: latency has climbed sharply and errors are spiking for the recommendations service.
At this point, metrics have done their job. They tell you what is wrong and when it started, but they do not explain how or why.

The next question is where the slowdown is happening. To answer that, you turn to traces and focus on requests captured during the incident window.

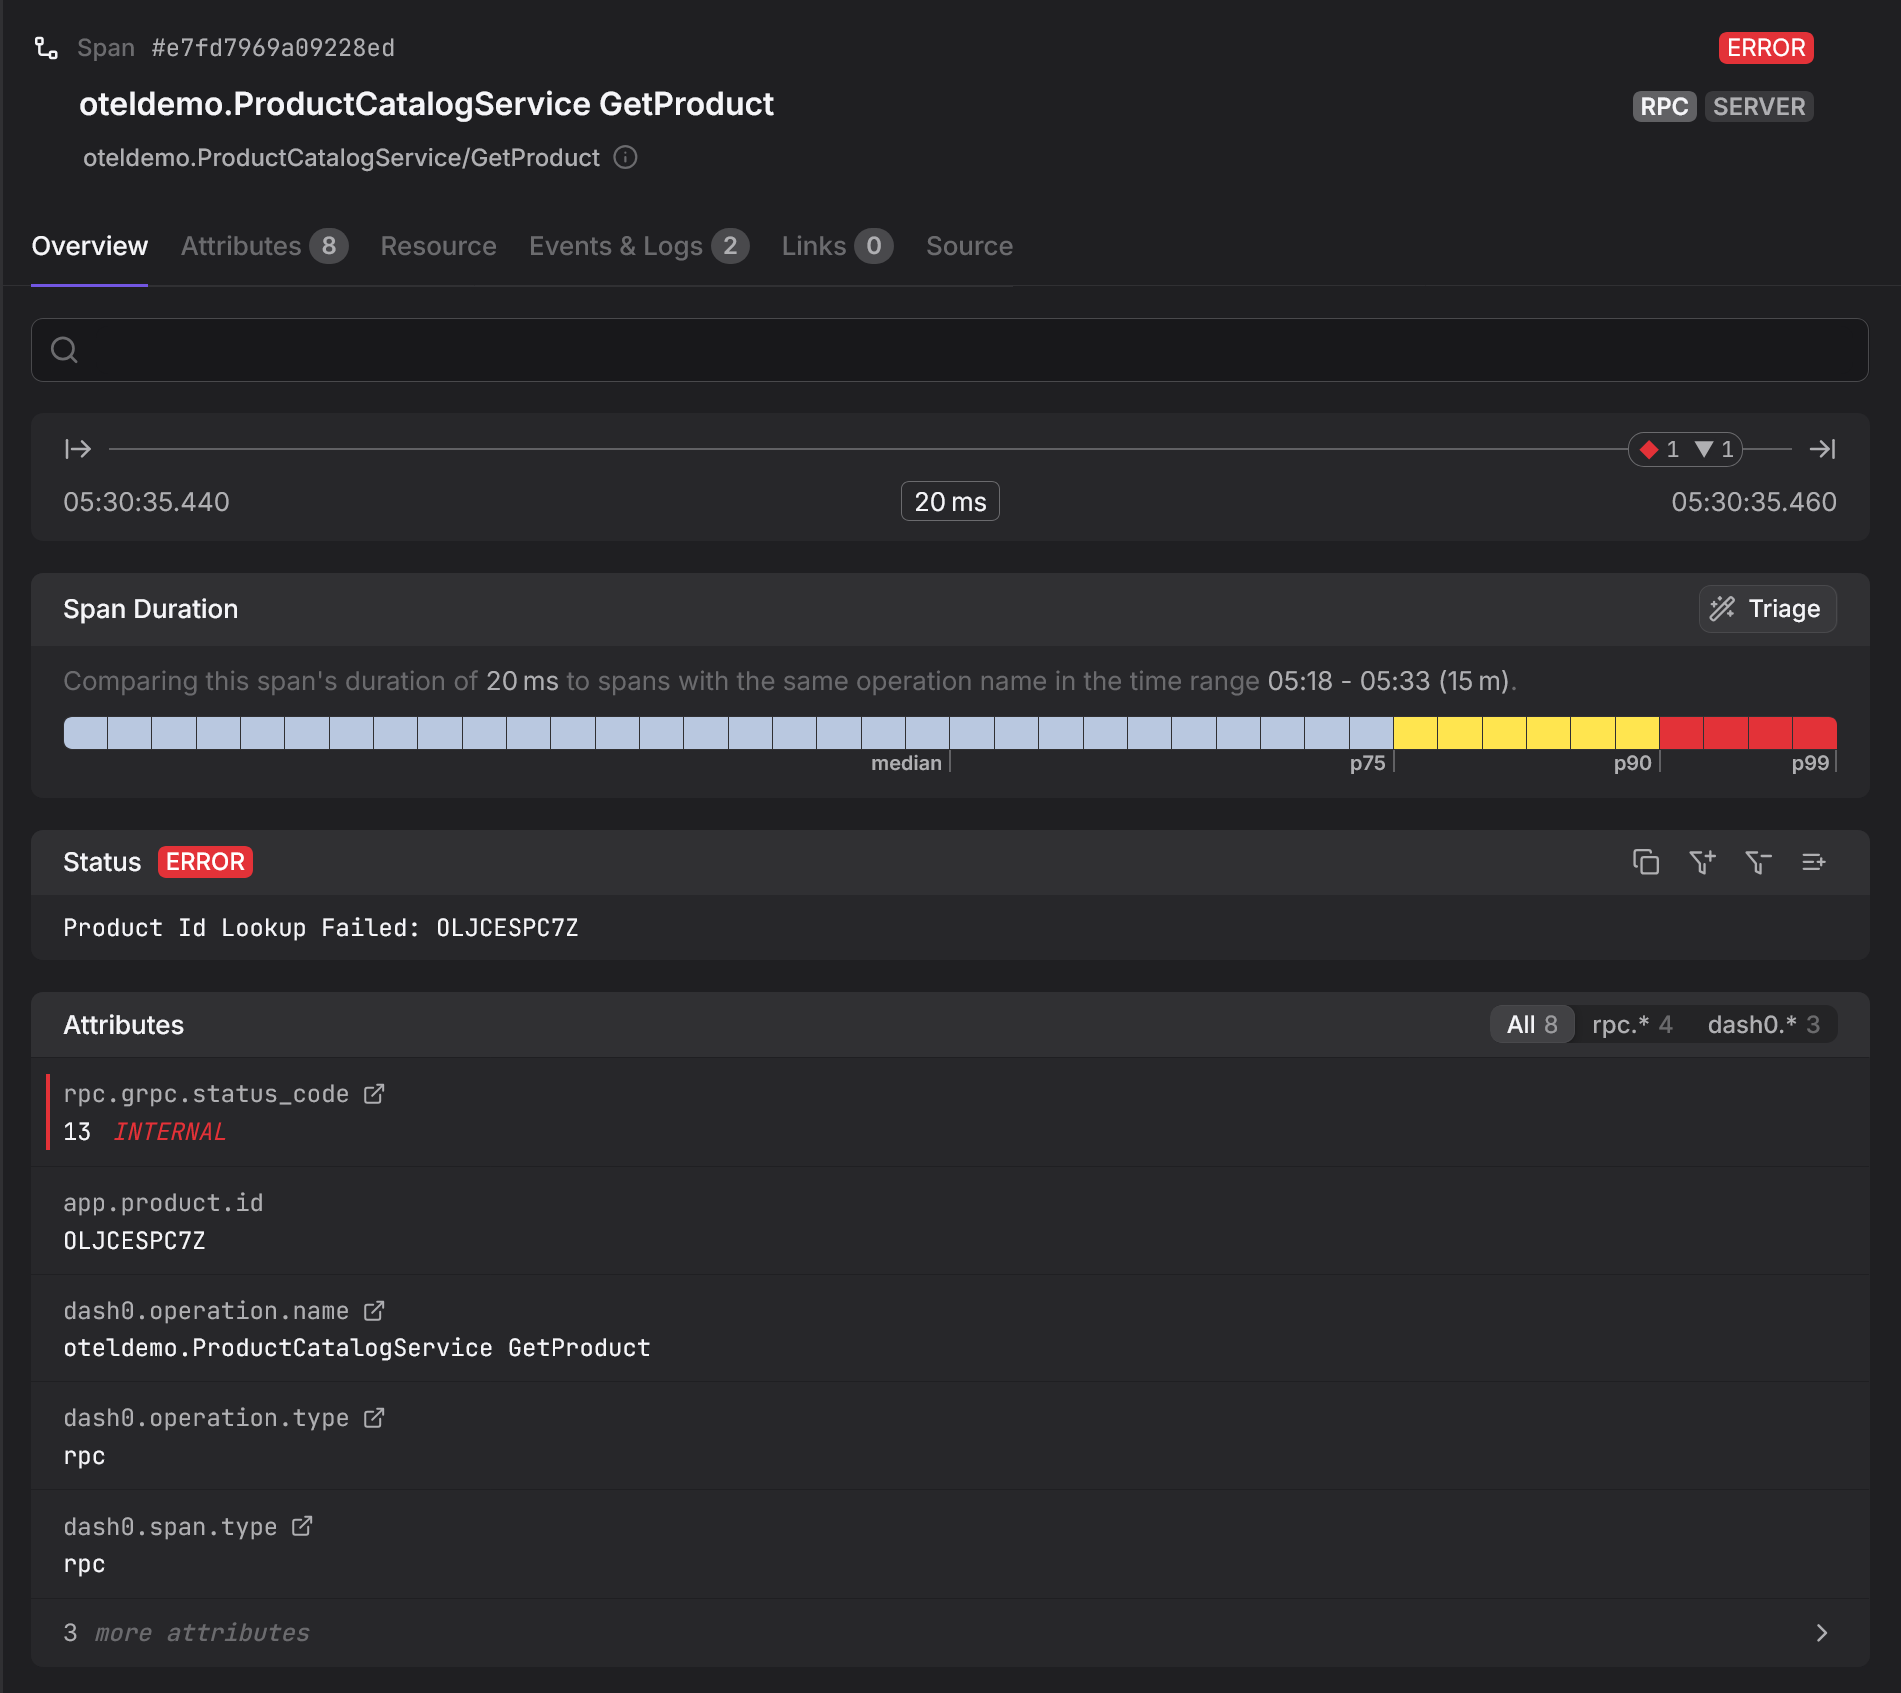
The trace view shows a growing number of slow and failing requests flowing through /api/recommendations. Looking at the span breakdown makes the issue clearer. The ListRecommendations operation stands out as the dominant contributor to latency and failures. Traces have now shown you where the problem sits in the request flow.

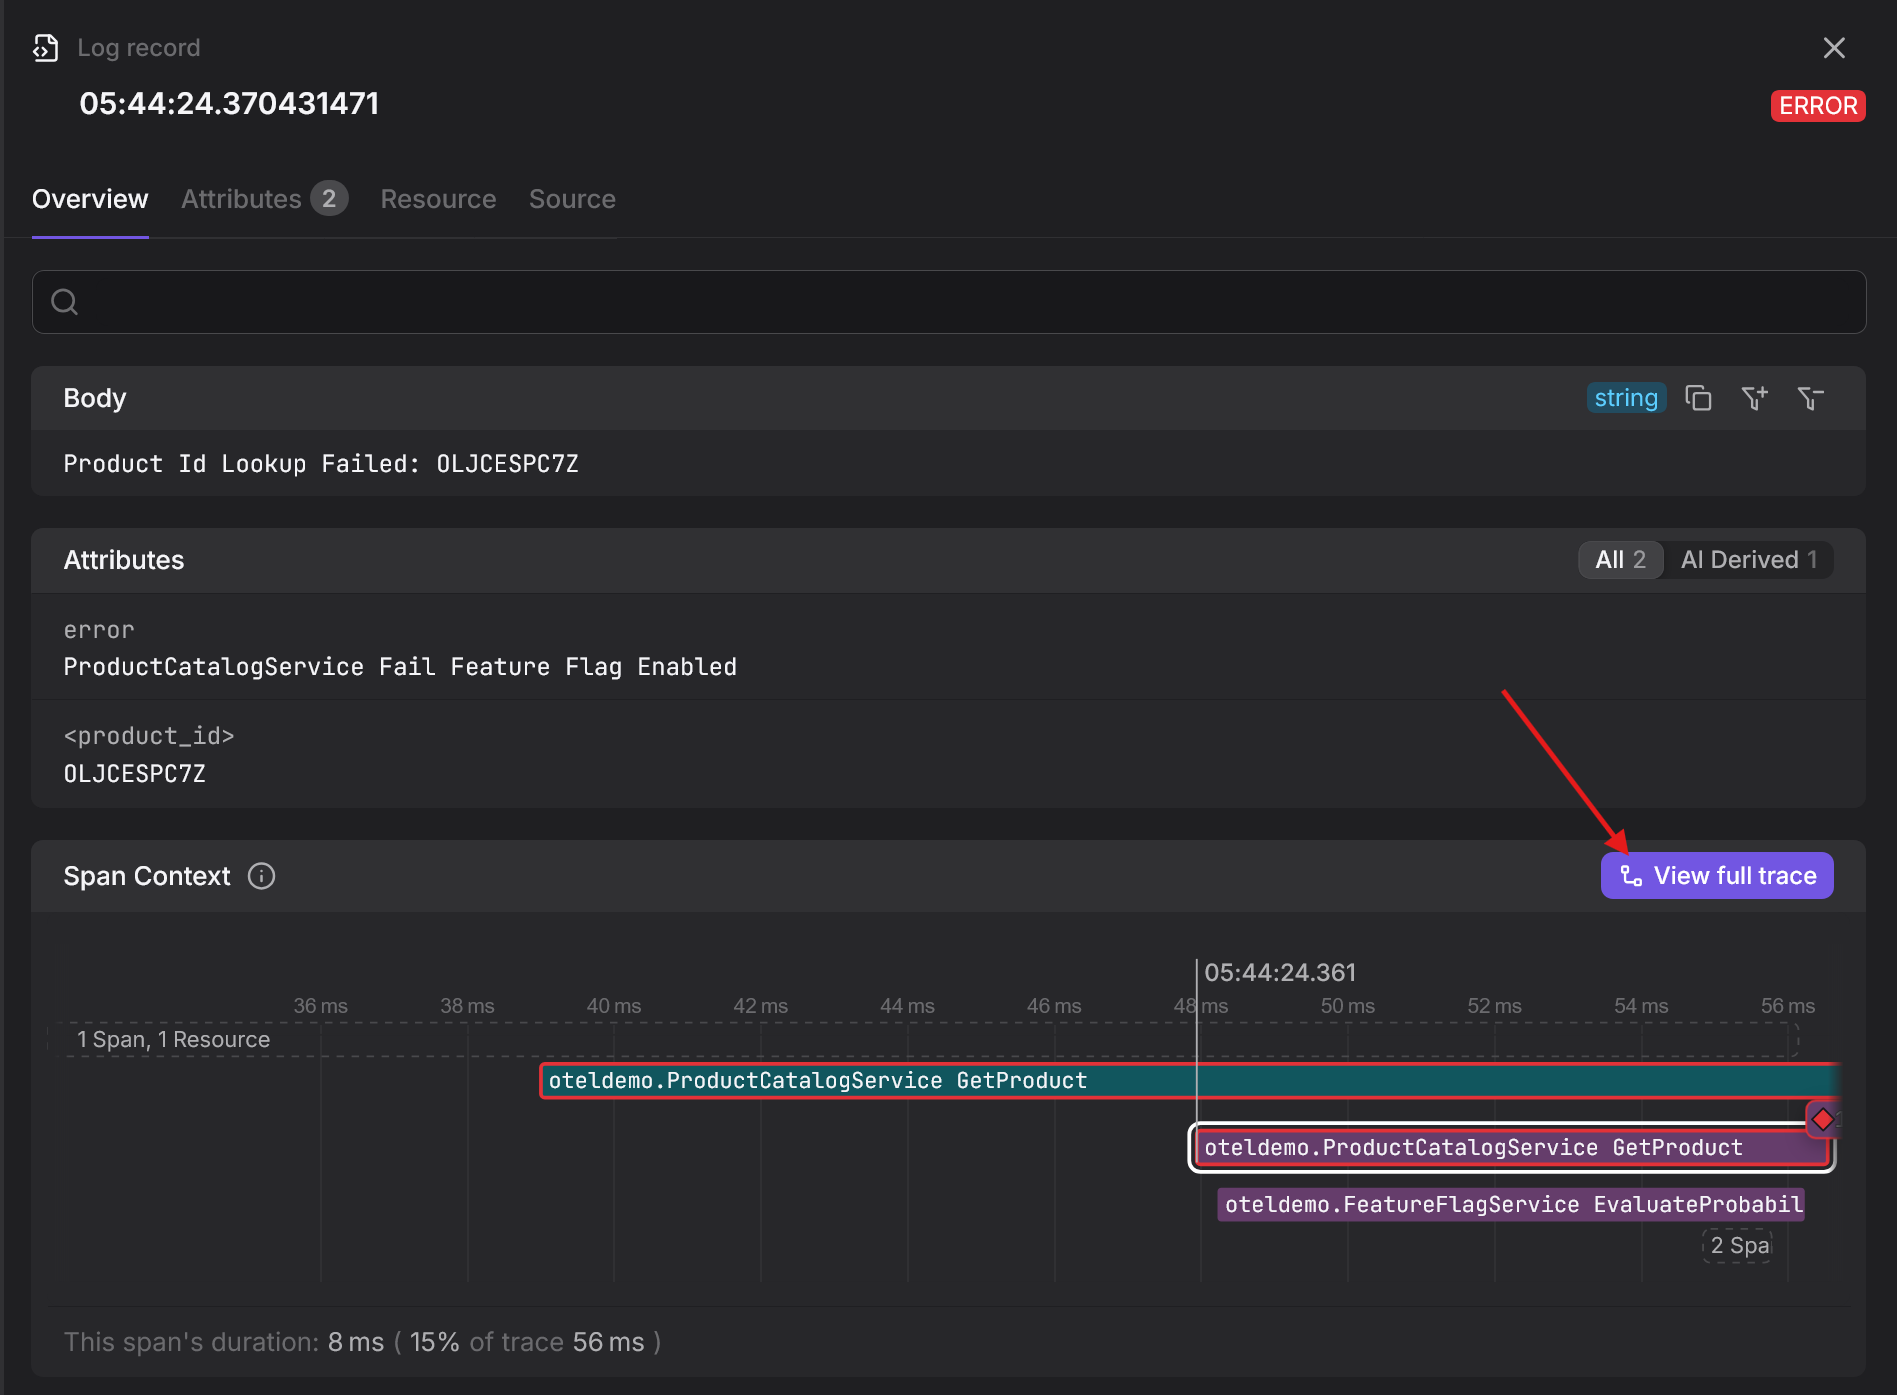
With the failing operation identified, you need to understand why it behaves this way. Because your traces are correlated with logs through shared context, you can jump directly from the problematic spans to the logs emitted during those executions.
There, the cause becomes obvious. Warning logs show repeated retries when calling an external dependency, followed by error logs reporting request timeouts. The pattern explains both the rising latency and the eventual failures.

Metrics surfaced the symptom. Traces narrowed it down to a specific operation. Logs provided the explanation.
This progression from what, to where, to why is what makes logs, metrics, and traces effective together. When they are properly correlated, troubleshooting becomes a guided process instead of a guessing game, allowing issues to be understood and resolved quickly.
Final thoughts
The path to observability is paved with (at least) three signals.
A successful strategy doesn’t treat these signals as separate "pillars" standing on their own. Instead, it focuses on correlating them, which is what allows you to move seamlessly from a high-level view of your system’s health to the on-the-ground reality of a single transaction.
This philosophy is at the core of Dash0. As an OpenTelemetry-native platform, we automatically connect these signals to provide a seamless troubleshooting experience from a single UI.
If you’re ready to see what a truly unified observability platform can do, try Dash0 for free today.
