

An OKR for reliability
A target the business can rally around
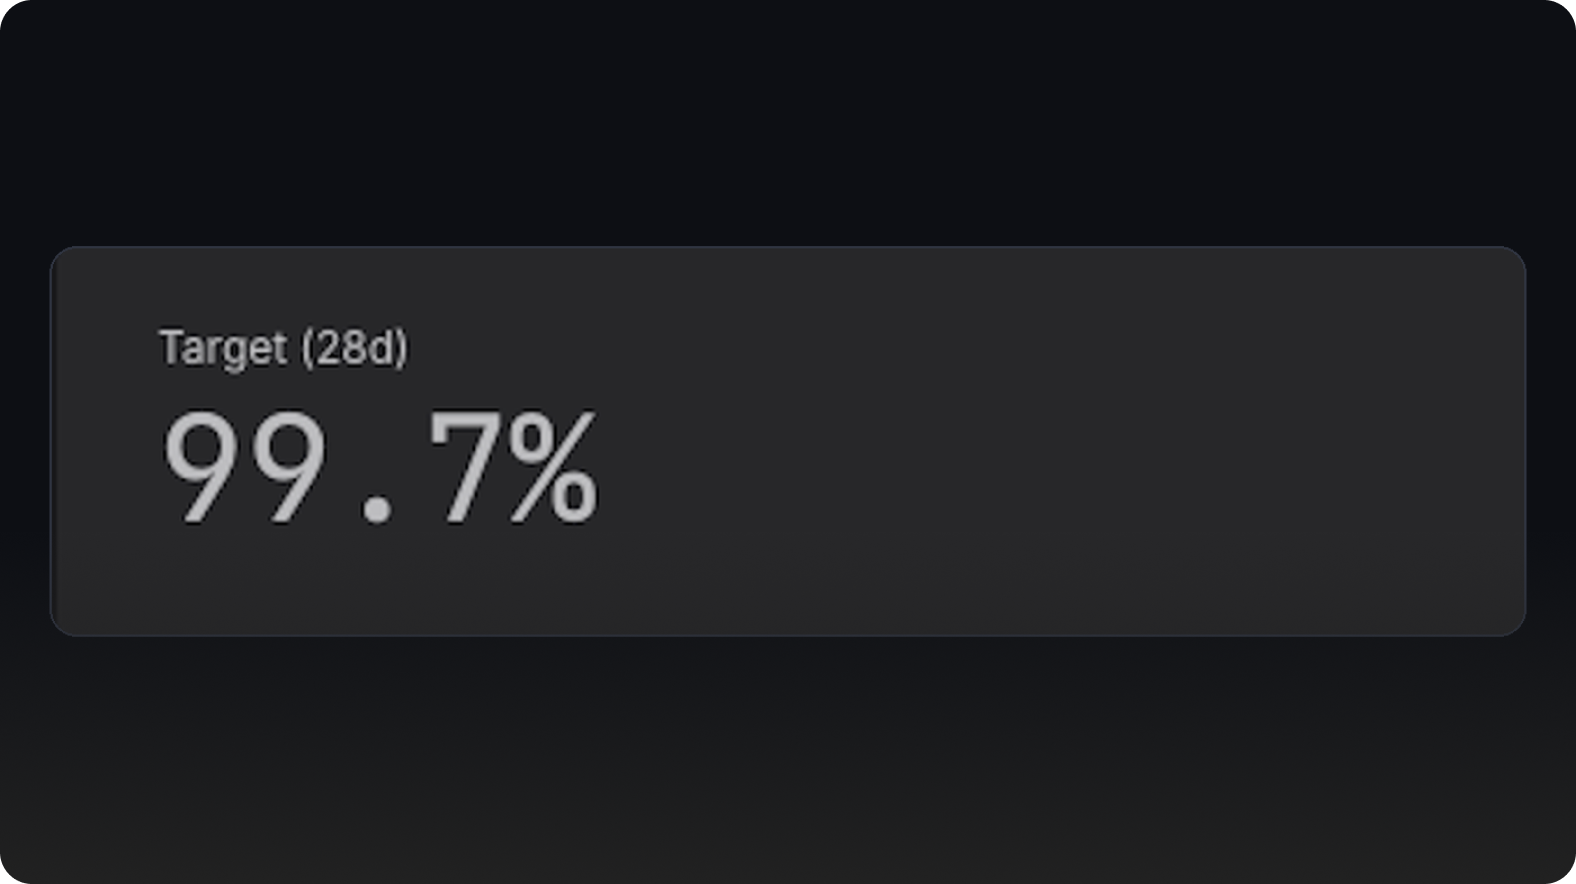
Set a target like 99.7% for a service and everyone works toward the same figure, so technical work ladders up to a business outcome.
Dash0 acquires Polar Signals

Set a target for how reliable a service should be, then watch your error budget and burn rate in real time. See which deploy introduced bad events, and get alerted before users feel it.
Start for free or Book a demo

Teams align around reliability as a common standard, treating it with the same shared commitment as an OKR
Set a target like 99.7% for a service and everyone works toward the same figure, so technical work ladders up to a business outcome.
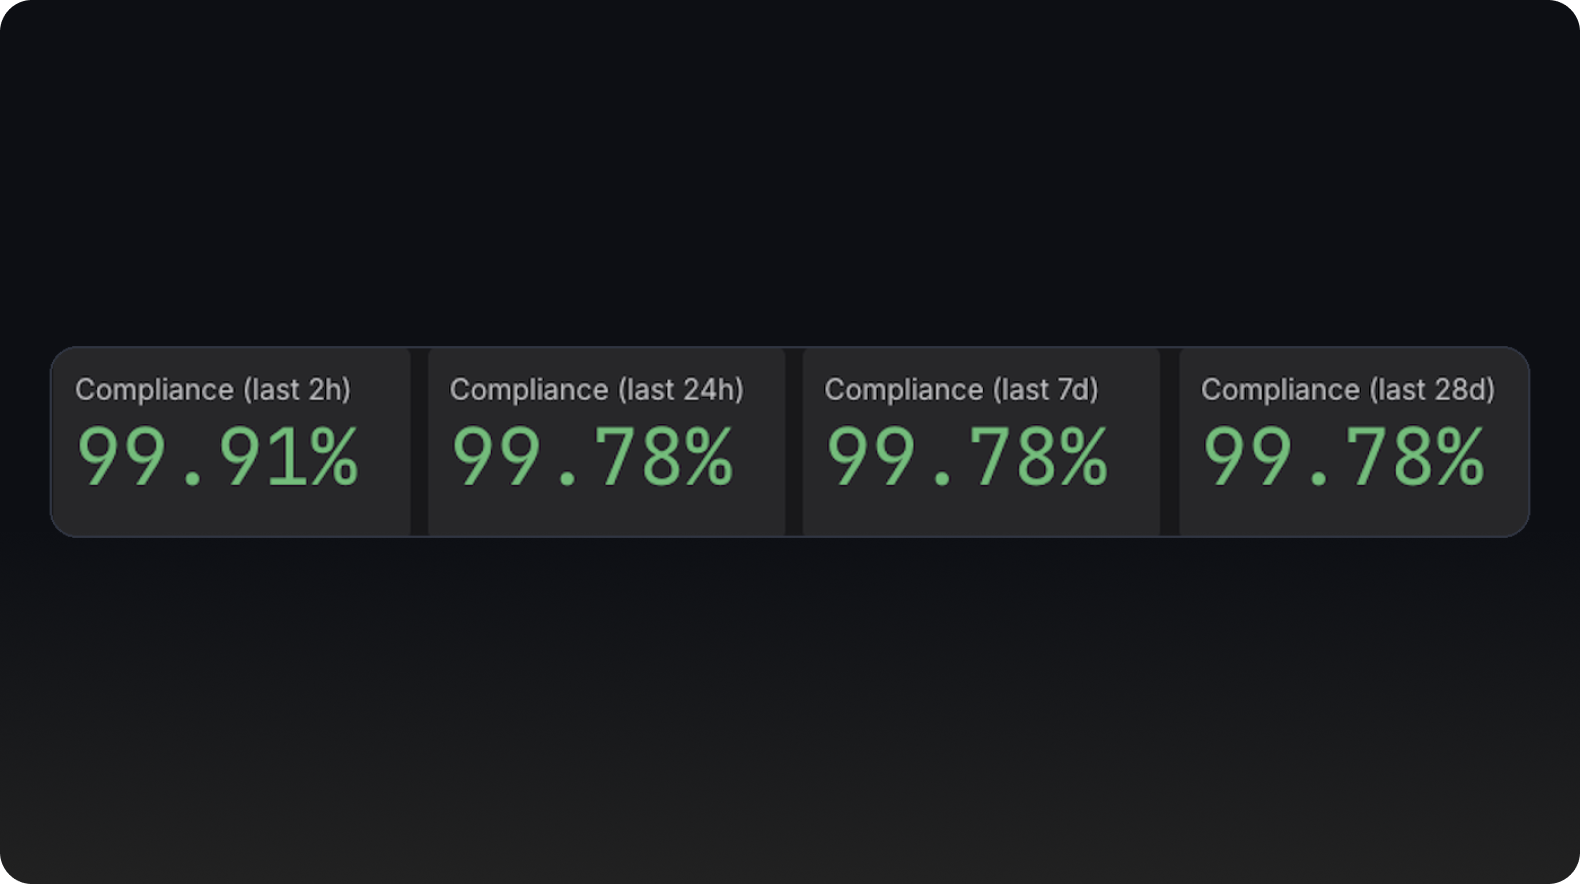
Leadership sees whether the service is meeting the bar. Engineering sees which step is failing. Neither has to translate for the other.
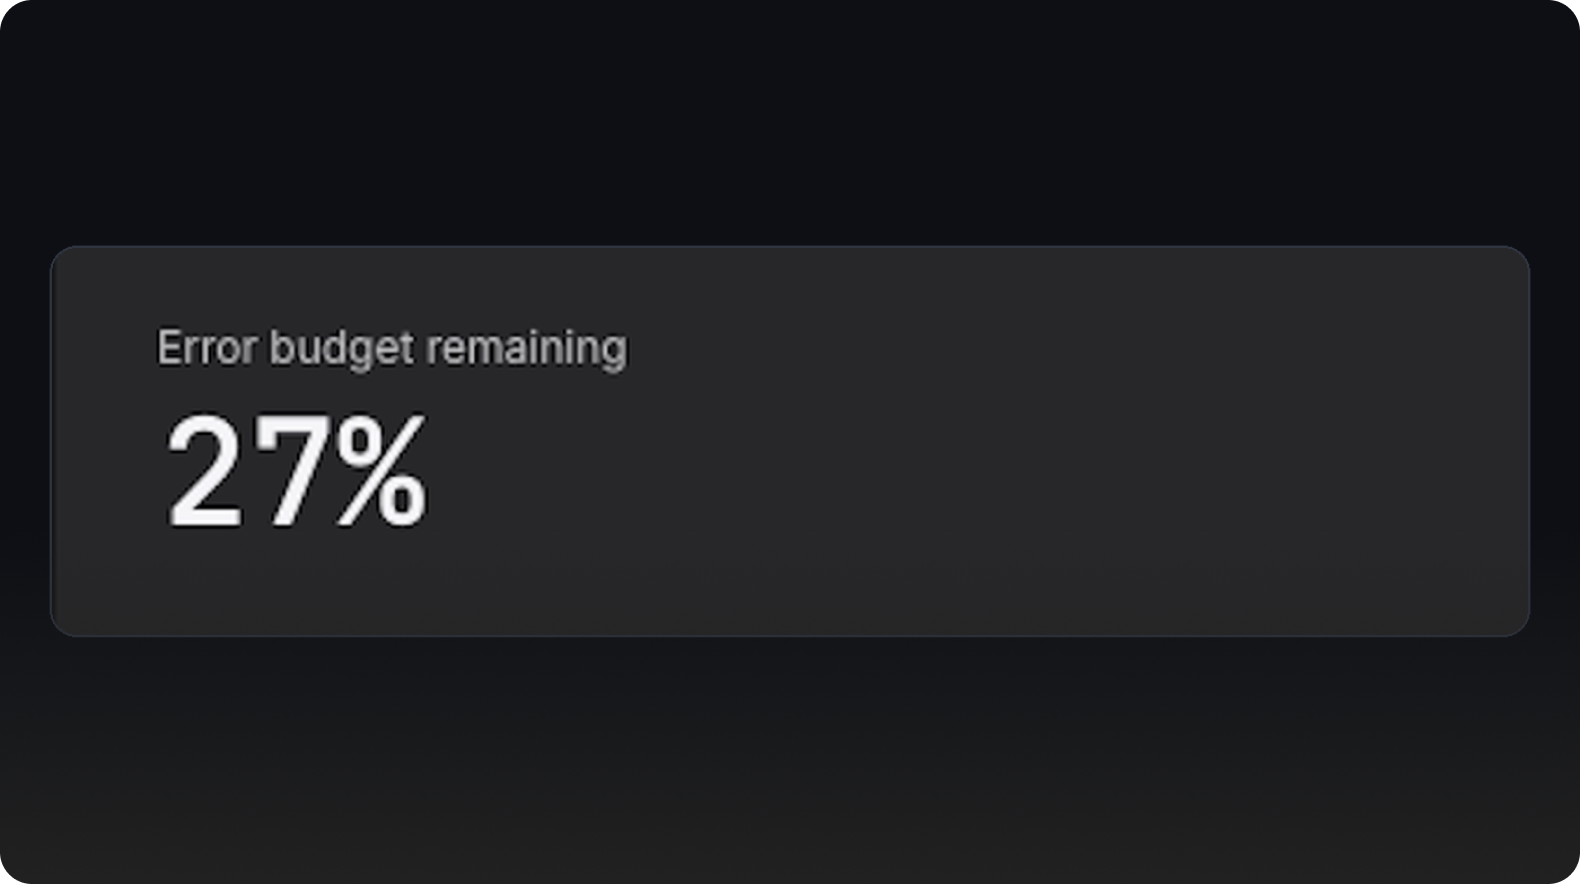
Stop arguing about whether things are "fine." The error budget says what is actually happening, and prioritization follows the number.
Define your SLI in PromQL, your way. Dash0 does the rest.
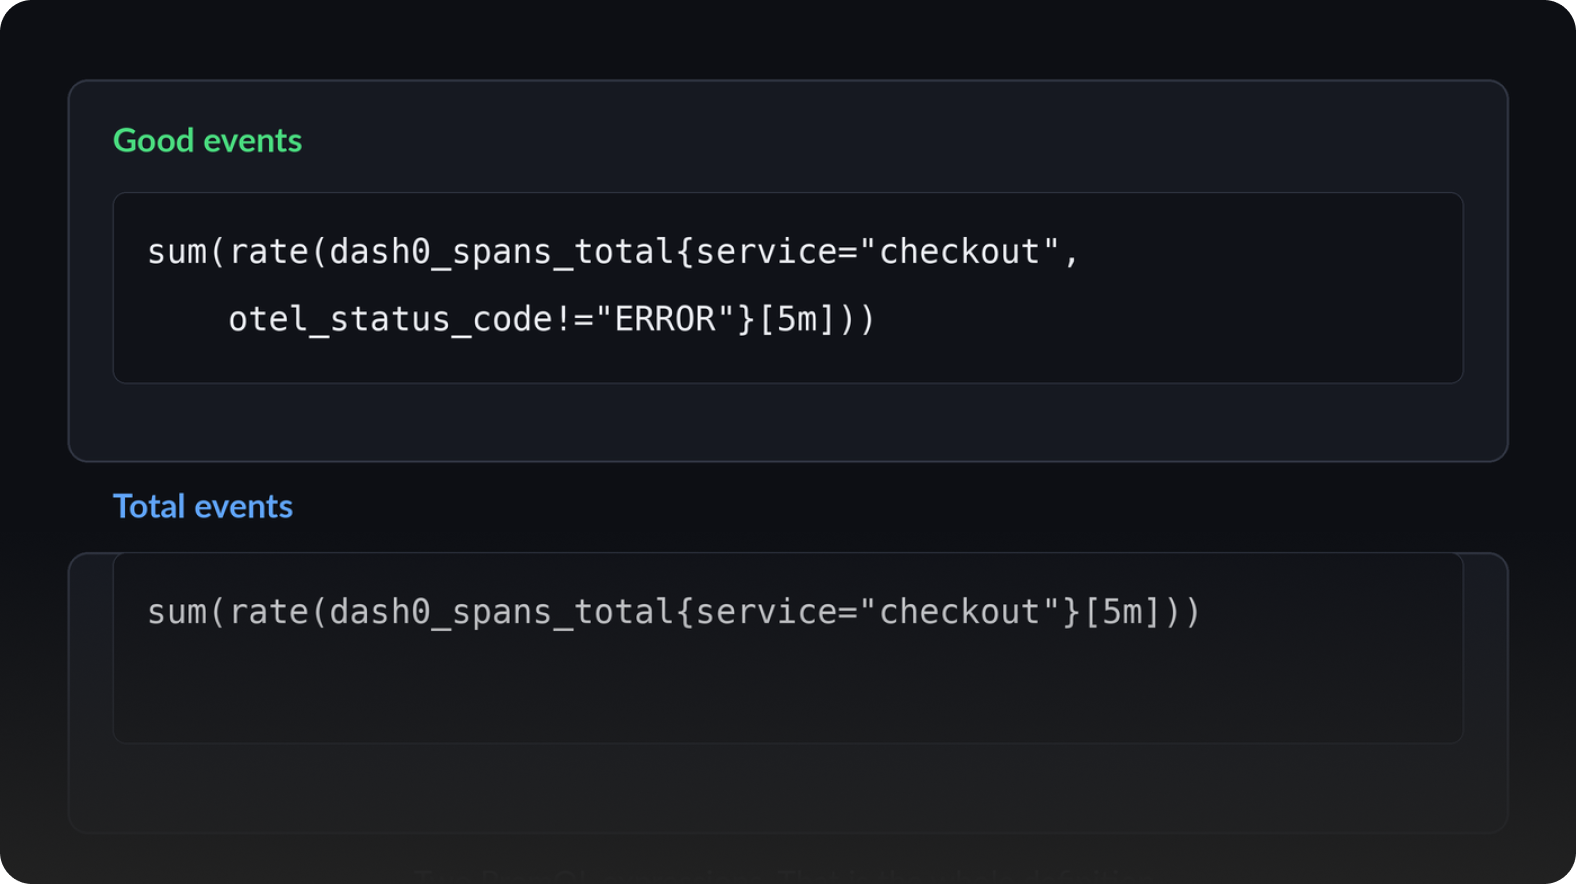
Describe your indicator with PromQL over telemetry you already send. Count good events against total, count bad events against total, or write a single raw expression that returns the ratio directly, such as the share of requests under a latency threshold. Dash0 computes the SLI from whichever you choose.
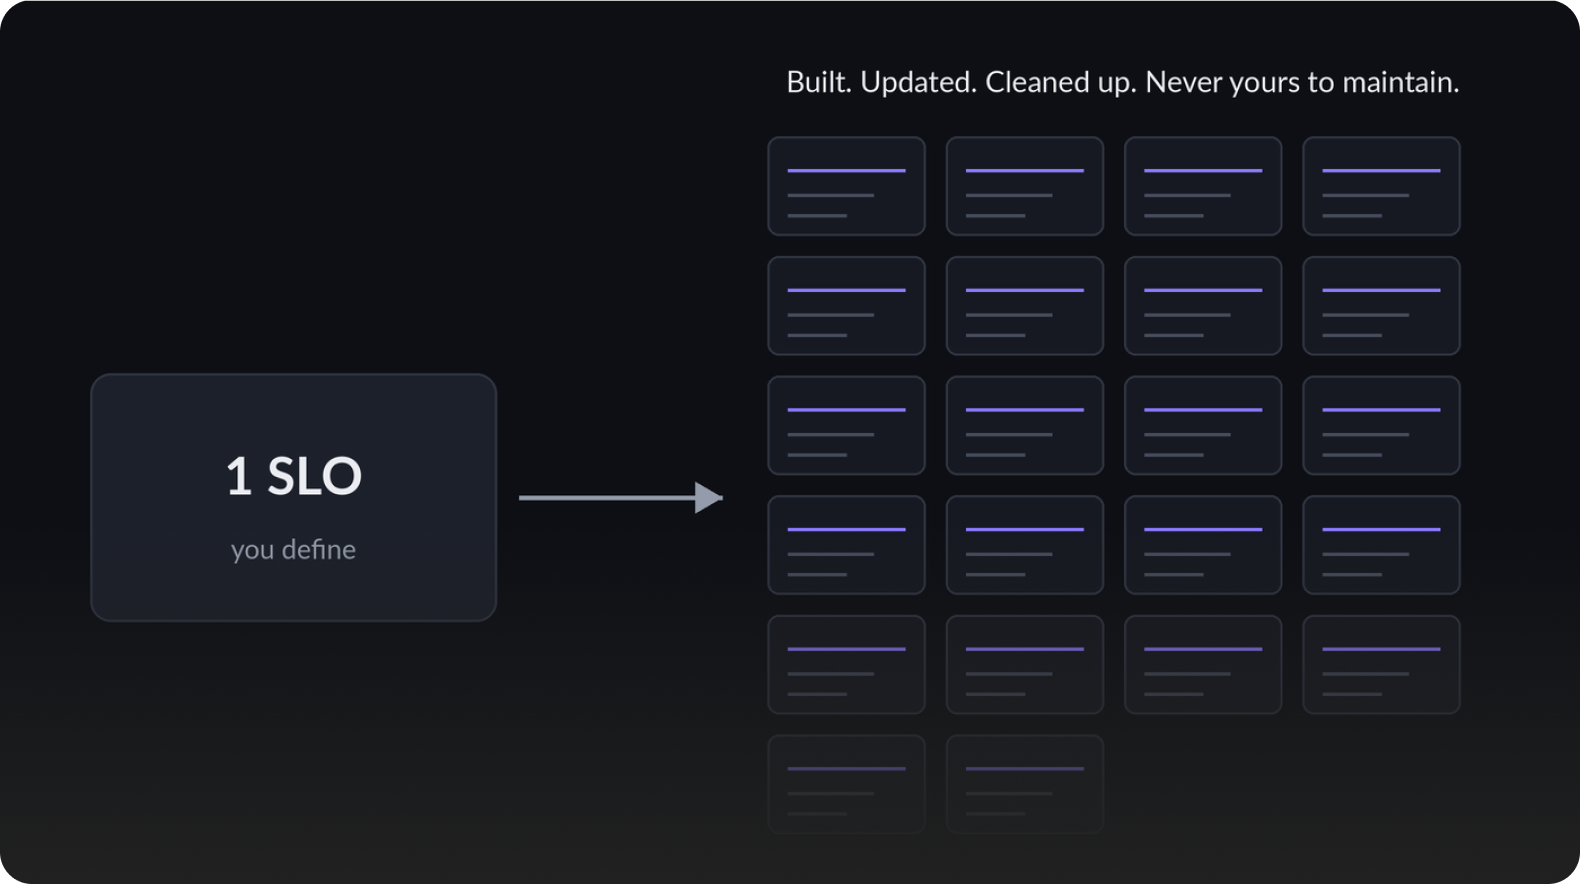
Dash0 creates and manages the recording rules that materialize the metrics behind your SLO, so there is nothing for your team to hand-build or maintain.
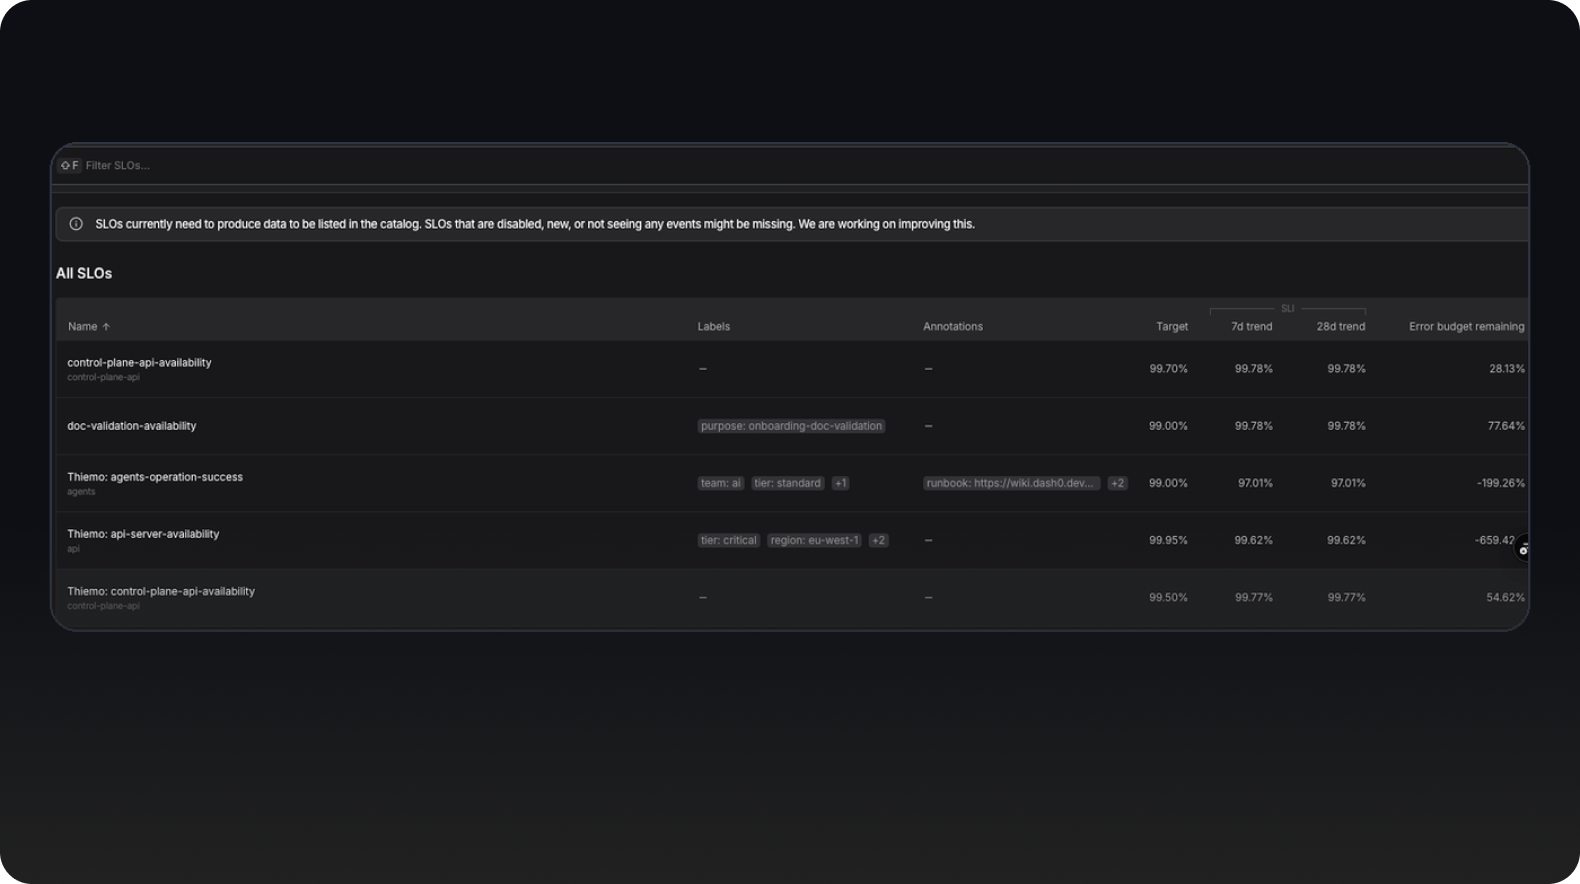
Create and manage SLOs in the UI, or as code through the control-plane API, Terraform provider, Kubernetes Operator, or CLI. Or ask Agent0 to set it up for you.
Every SLO gets a live view of its target, remaining budget, and how fast that budget is going.
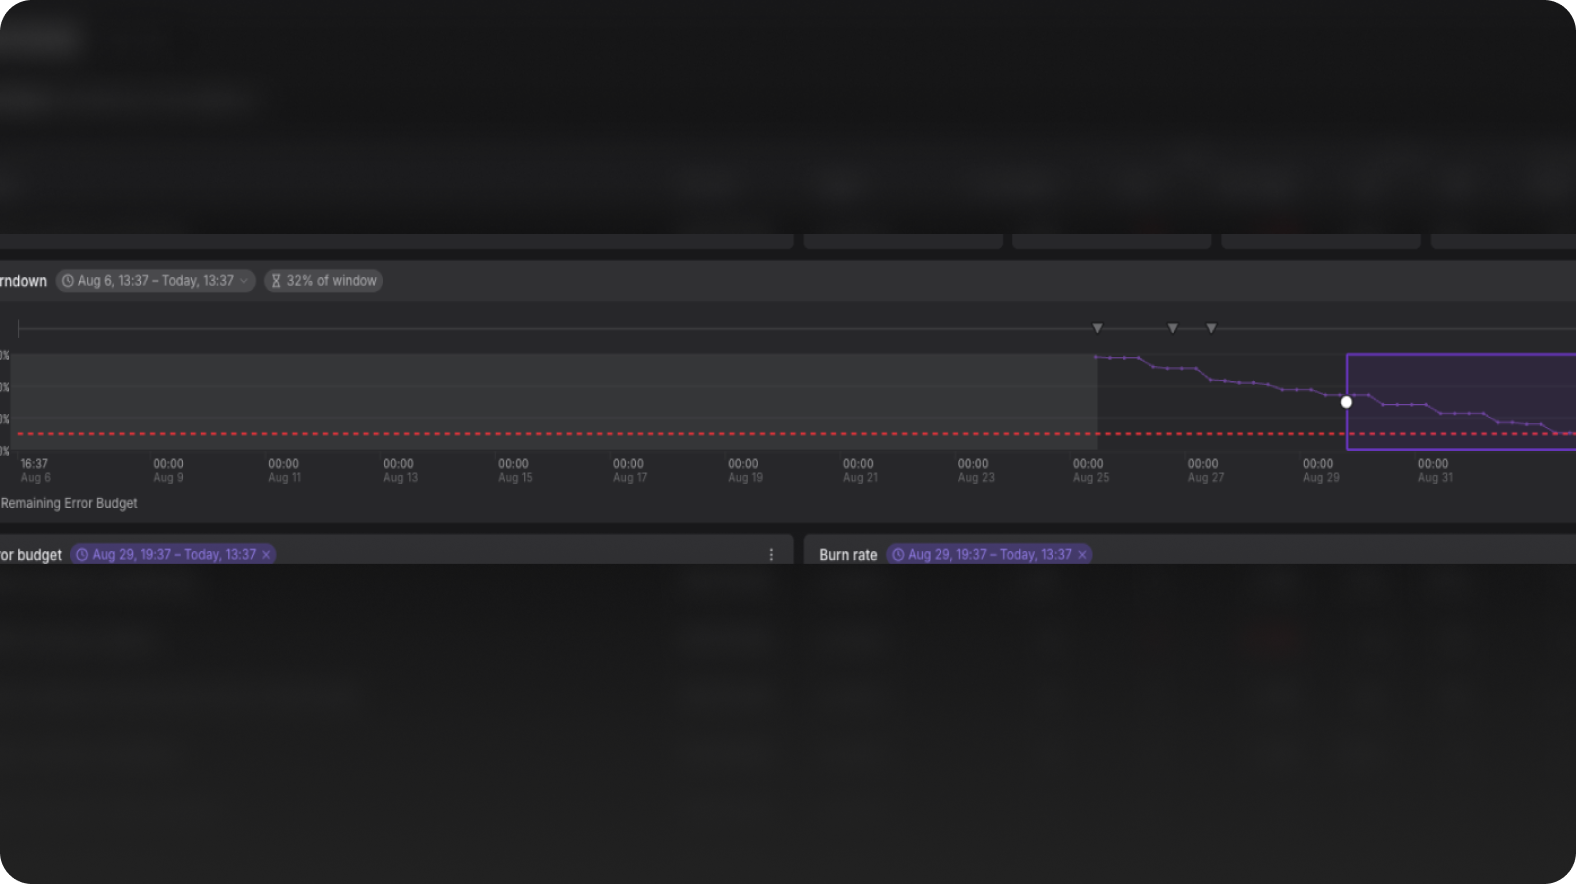
The detail view shows the target, error budget remaining, and the burndown across your window, continuously evaluated.
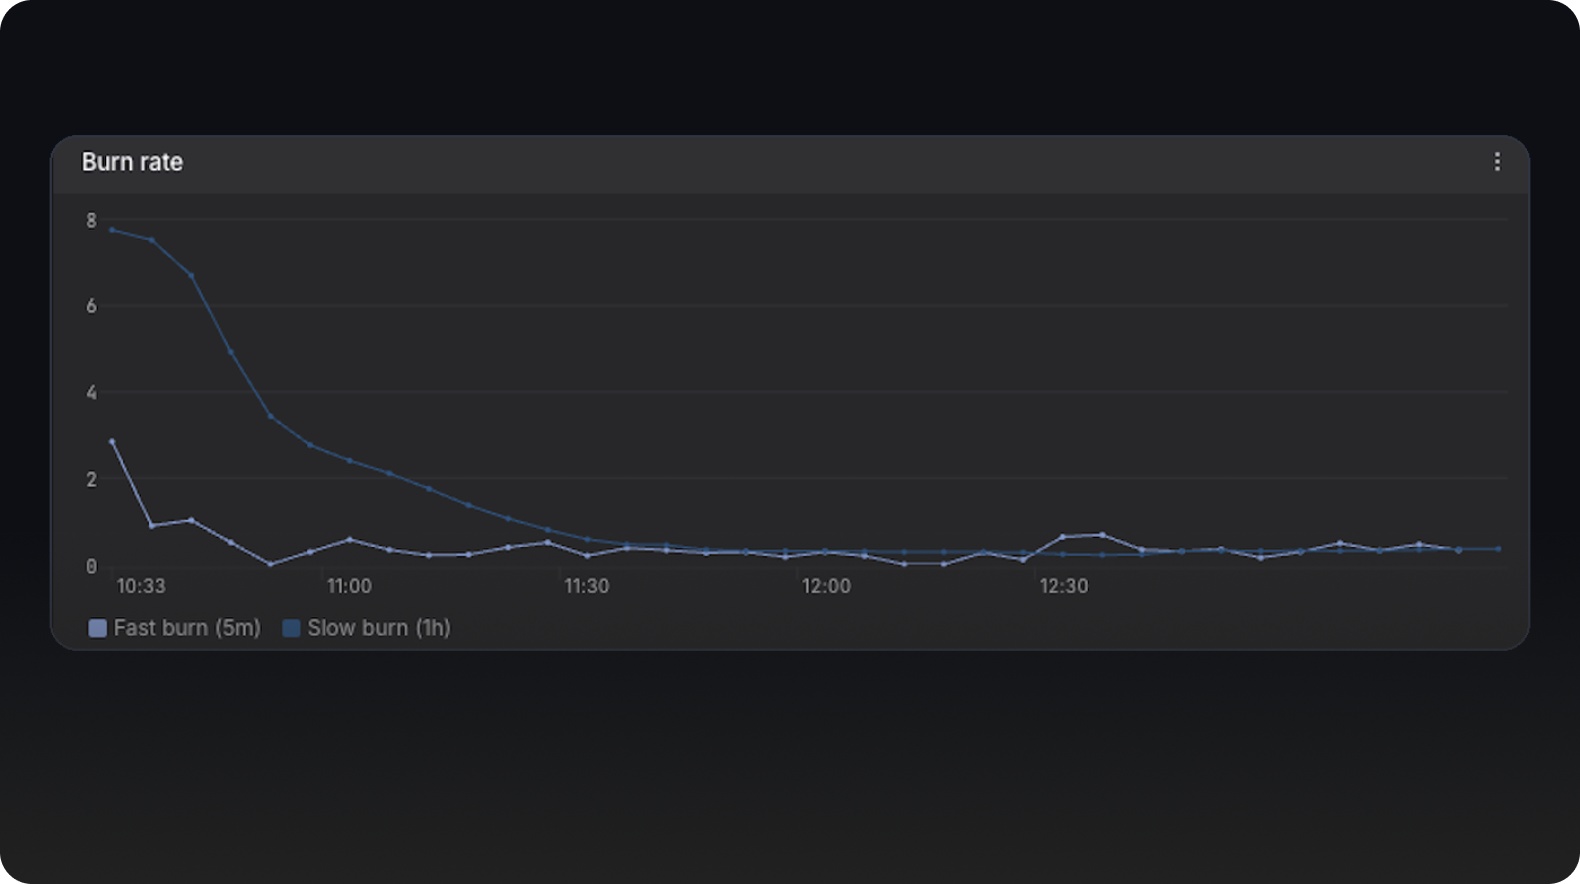
A slow burn drains the budget over days. A fast burn is spending it many times faster than sustainable. You can tell which one you are in at a glance.
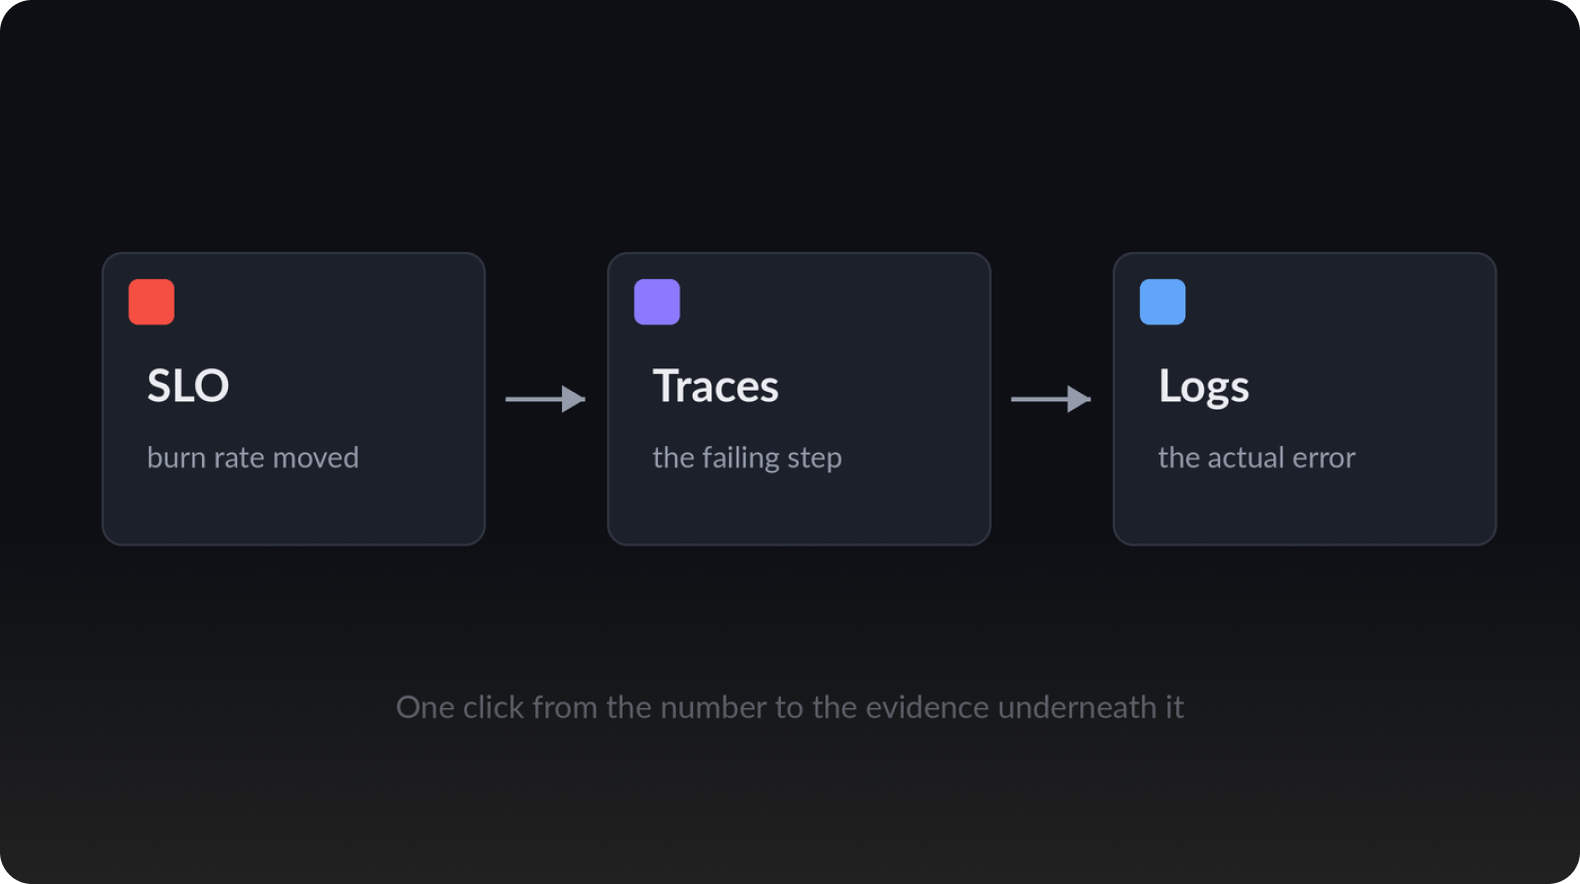
Drill from any SLO straight into the underlying logs and traces, so the number always leads back to the evidence.
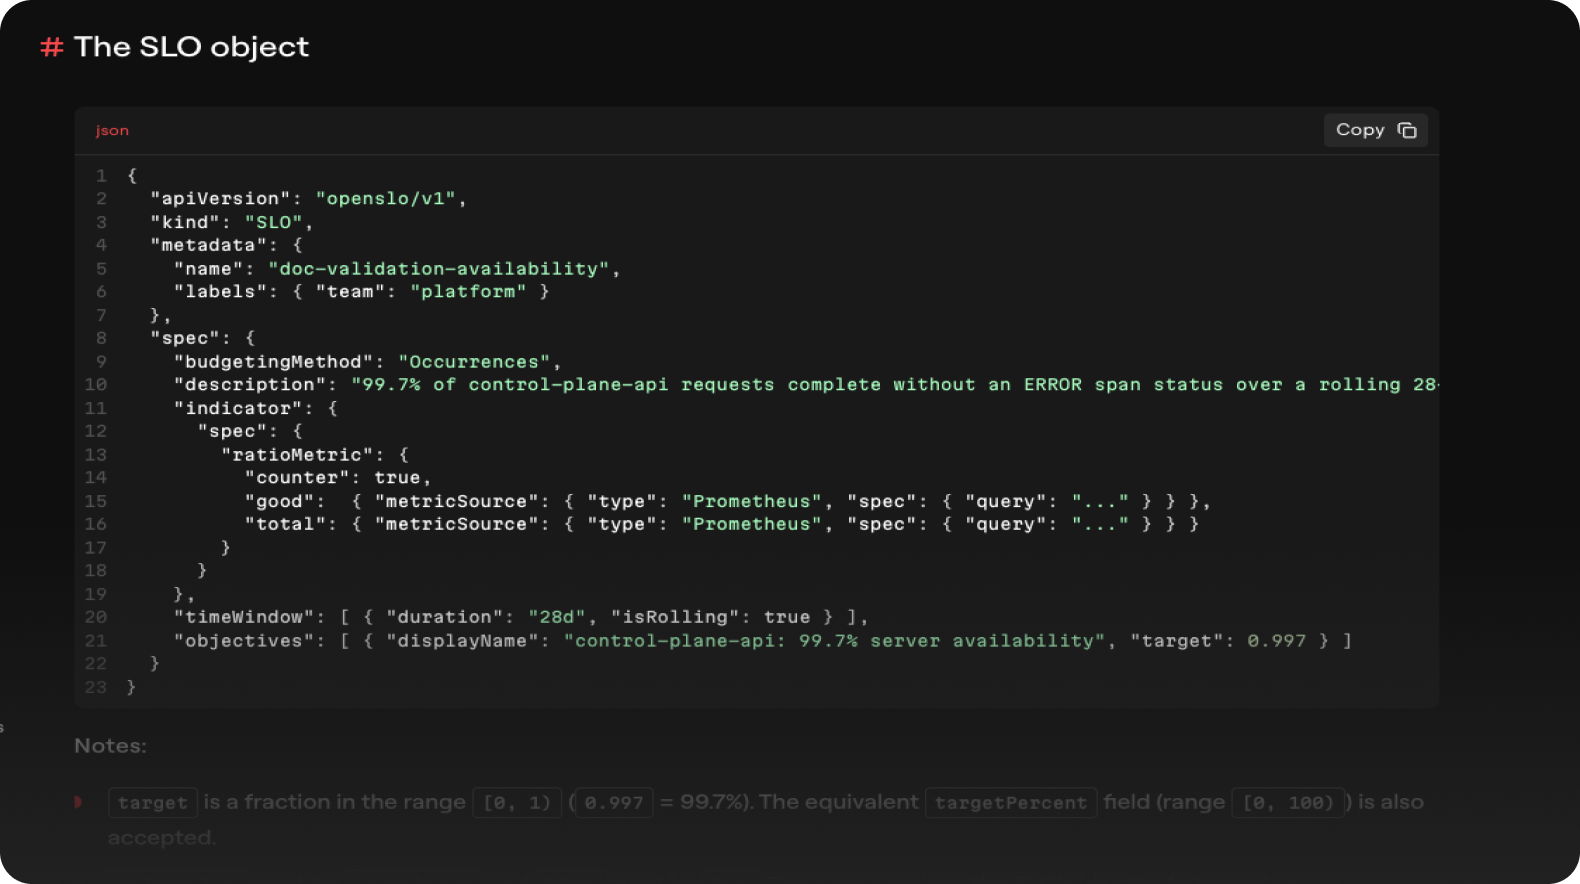
SLO definitions use the OpenSLO format, live in your own infrastructure-as-code, and export whenever you want them. Access control and folders keep edit rights with the team that owns the service.
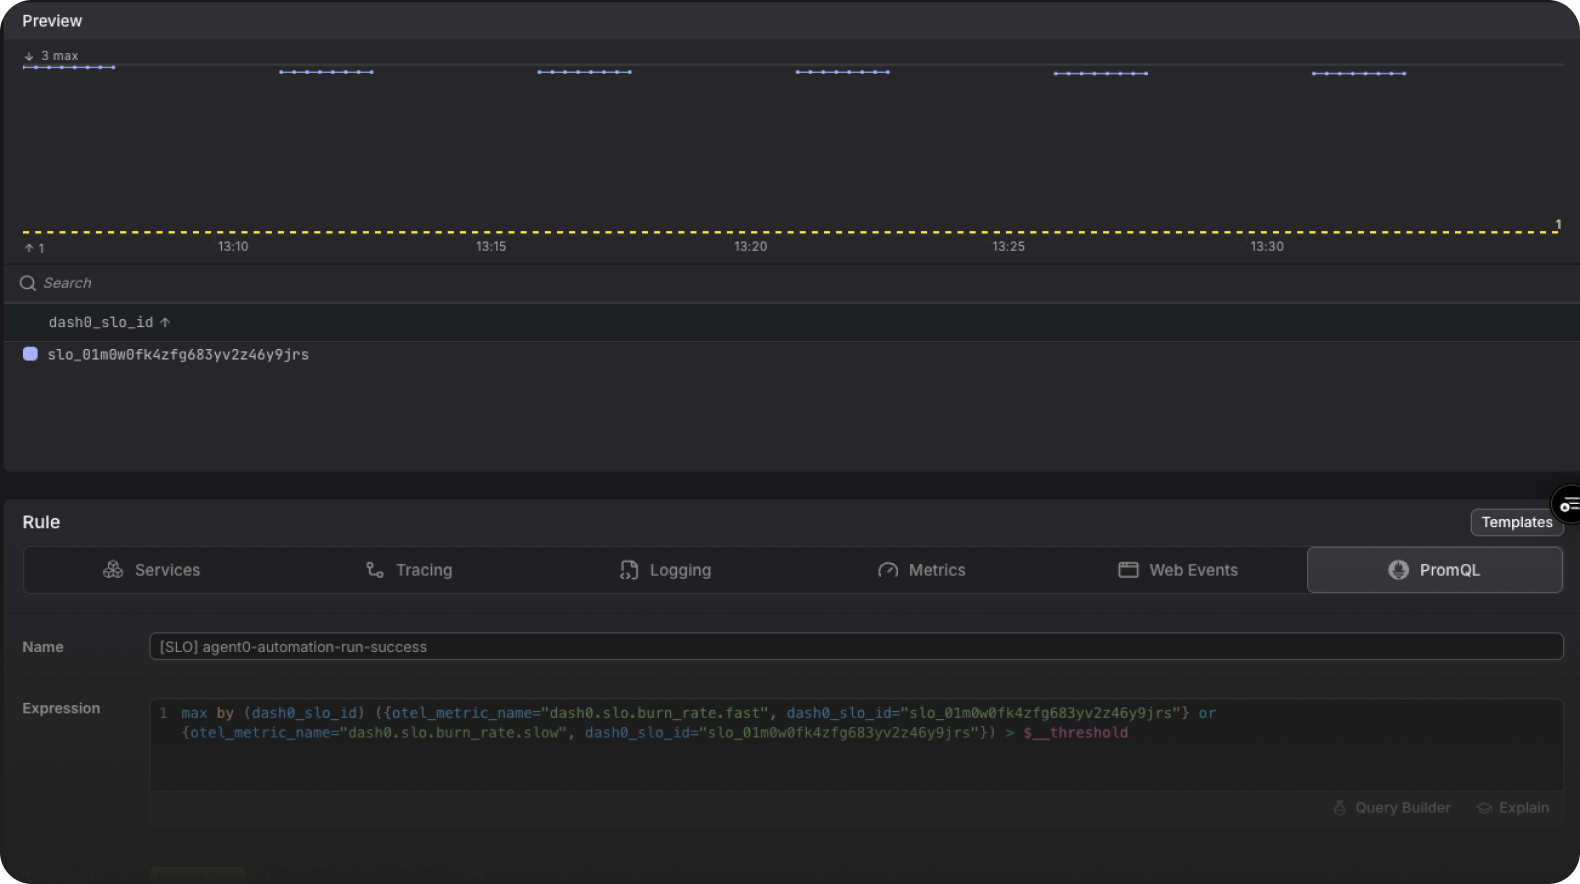
Alerts fire on how fast the budget is burning across multiple windows, so a slow leak and a sudden fire get the different responses they deserve.
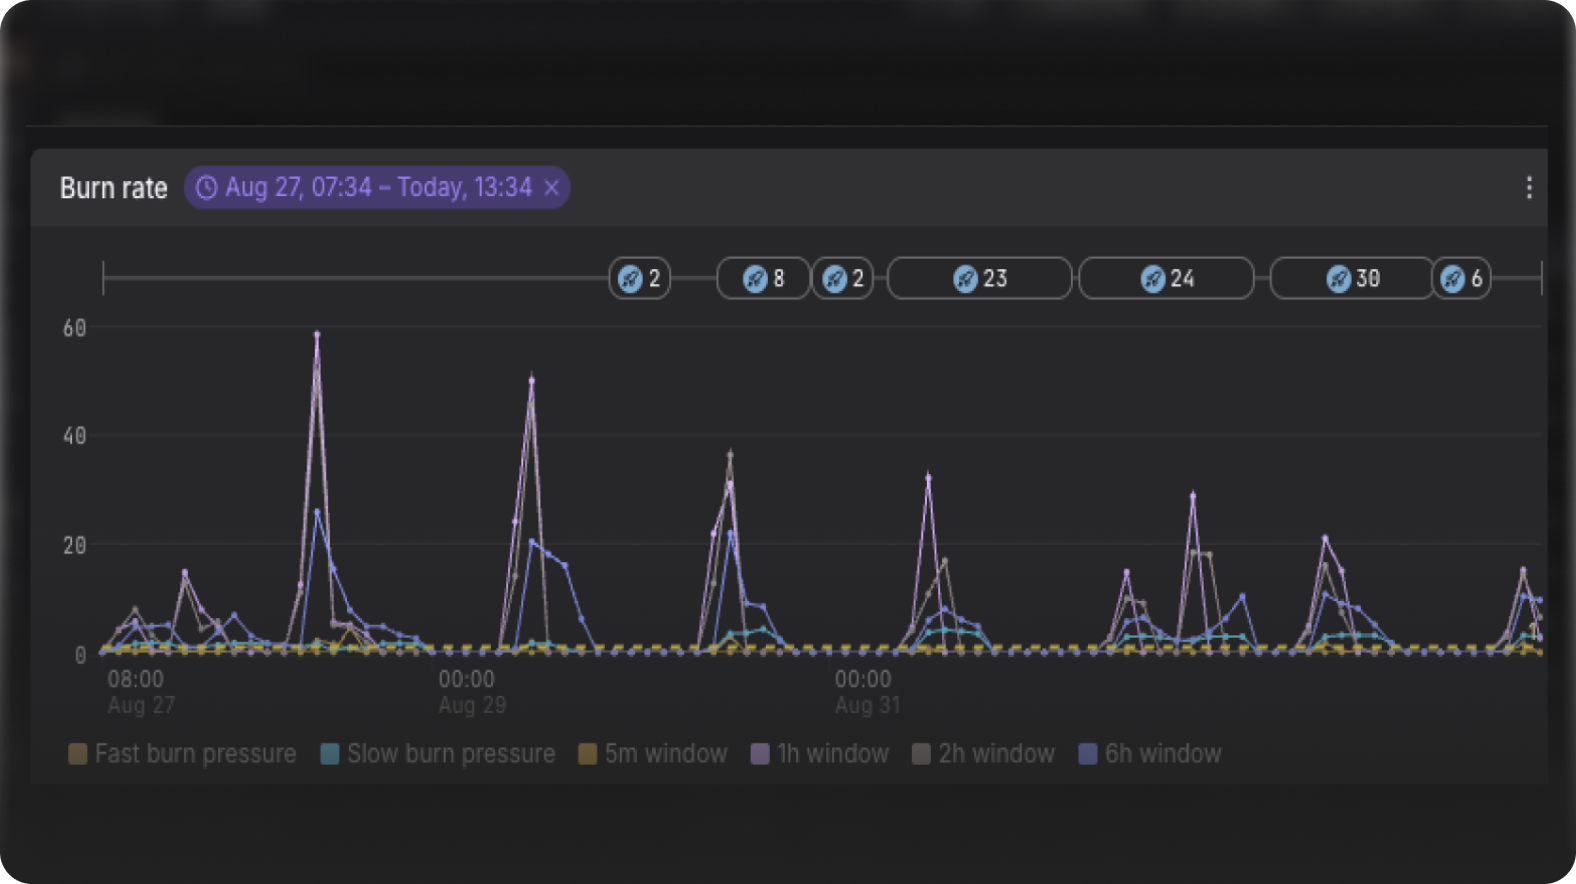
Deployment events overlay the SLO view, so a release that introduces bad events shows up the moment the burn rate moves. Observability-first development: ship AI-written code and see its impact immediately.