Last updated: March 2, 2026
Mastering NGINX Logs with JSON and OpenTelemetry
NGINX sits at the front door of countless applications, acting as a web server, reverse proxy, or load balancer. Every request that passes through it generates logs, and those records are often the most immediate and reliable source of truth when something goes wrong.
But most existing guides only teach you the basics: turning on the log files and
showing how to tail them. That level of knowledge hasn't kept pace with modern
practices, where logs need to be structured, machine-readable, and integrated
with observability frameworks like OpenTelemetry.
This guide bridges that gap. You'll move from basic log files to a pipeline covering:
- Structured JSON logging for reliable parsing.
- Log sampling to cut down on log noise and cost.
- Robust error log parsing.
- Full integration with the OpenTelemetry ecosystem.
Let's begin!
Understanding NGINX logging fundamentals
Before you can configure advanced features or integrate with observability tools, you need a clear understanding of what logs NGINX creates and where they live.
Types of NGINX logs
NGINX categorizes its log output into two files, each serving a distinct purpose:
-
Access log (
access.log): This records every request that NGINX processes. For each request, it notes who made it (IP address), when it happened, what resource was requested (URI), how the server responded (HTTP status code), and the size of the response. These logs are what you need for analyzing traffic or user behavior. -
Error log (
error.log): This is NGINX's diary of problems and significant events. When something goes wrong, the details are recorded here. They are your primary tool for troubleshooting and diagnostics, but they don't just contain outright errors; they also record warnings and other notices that can help you understand server behavior.
Where to find NGINX logs
Understanding the types of logs is only half the picture. To make use of them, you need to know where they're written, and this depends on how NGINX was installed and the environment it runs in. Let's look at a few common scenarios below.
Standard Linux distributions (Ubuntu, Debian, CentOS)
For most installations from a package manager on Linux, the default location for
NGINX logs is the /var/log/nginx/ directory:
1ls -l /var/log/nginx/
This should output the following log files:
123total 8-rw-r--r-- 1 root adm 2134 Oct 05 10:20 access.log-rw-r--r-- 1 root adm 1789 Oct 05 11:15 error.log
If you can't find your logs there, the definitive source of truth is your NGINX
configuration file. You can find its location by running nginx -t, which tests
the configuration and reports the path to the main nginx.conf file.
1sudo nginx -t
This outputs:
12nginx: the configuration file /etc/nginx/nginx.conf syntax is oknginx: configuration file /etc/nginx/nginx.conf test is successful
Inside this file (or its included sub-configurations), the access_log and
error_log directives will specify the exact paths:
1234567# /etc/nginx/nginx.conferror_log /var/log/nginx/error.loghttp {access_log /var/log/nginx/access.log;}
A closer look at these directives is coming up shortly.
Containerized environments like Docker
In the world of containers, writing logs to a file inside the ephemeral
container filesystem is a bad practice. When the container is destroyed, the
logs are gone forever. The standard pattern is to forward logs to the
container's standard output (stdout) and standard error (stderr) streams.
The official NGINX Docker image
is configured to do this by default.
It creates symbolic links from the traditional log file paths to the special
device files for stdout and stderr:
/var/log/nginx/access.log->/dev/stdout/var/log/nginx/error.log->/dev/stderr
123# forward request and error logs to docker log collector&& ln -sf /dev/stdout /var/log/nginx/access.log \&& ln -sf /dev/stderr /var/log/nginx/error.log \
This setup lets
Docker capture the logs,
and you can then use the docker logs command to view NGINX logs for any
container produced by that image. It's the standard approach in containerized
environments since it cleanly separates log generation from log collection.
Setting up a lab environment with Docker Compose
To experiment with NGINX logs, it helps to have a clean and repeatable setup. Docker Compose makes this easy by letting us define and run the whole environment with a single configuration file.
Start by creating a new project directory. Inside it, add a file named
docker-compose.yml:
123456789# docker-compose.ymlservices:nginx:image: nginx:1.29.1container_name: nginx-serverports:- "8000:80"volumes:- ./nginx.conf:/etc/nginx/nginx.conf:ro
Next, execute the command below to grab the default NGINX configuration file
from the nginx image and save it locally as nginx.conf:
1docker run --rm --entrypoint=cat nginx /etc/nginx/nginx.conf > nginx.conf
This provides a starting point you can customize for logging experiments. Here's what the file looks like:
1234567891011121314151617181920212223242526272829303132# nginx.confuser nginx;worker_processes auto;error_log /var/log/nginx/error.log notice;pid /run/nginx.pid;events {worker_connections 1024;}http {include /etc/nginx/mime.types;default_type application/octet-stream;log_format main '$remote_addr - $remote_user [$time_local] "$request" ''$status $body_bytes_sent "$http_referer" ''"$http_user_agent" "$http_x_forwarded_for"';access_log /var/log/nginx/access.log main;sendfile on;#tcp_nopush on;keepalive_timeout 65;#gzip on;include /etc/nginx/conf.d/*.conf;}
This configuration shows how NGINX sets up its workers, handles basic HTTP
behavior, and defines both access and error logging. The important parts for us
are the access_log, error_log, and the log_format directive, which
controls what gets logged and how.
In the project directory, run the command below to start the nginx-server
service:
1docker compose up -d
123[+] Running 2/2✔ Network nginx-logging-tutorial_default Created 0.1s✔ Container nginx-server Started 0.4s
You now have a running NGINX server accessible at http://localhost:8000:
To see NGINX logs in real-time, you can stream them directly from the container:
1docker compose logs -f nginx
As you access http://localhost:8000 in your browser, you'll see access log
entries appear in the terminal:
1172.19.0.1 - - [05/Oct/2025:12:49:47 +0000] "GET / HTTP/1.1" 200 615 "-" "Mozilla/5.0 (Windows NT 10.0; Win64; x64; rv:143.0) Gecko/20100101 Firefox/143.0" "-"
If you try to access a non-existent page like http://localhost:8000/notfound,
you'll see both an access log entry for the 404 and a corresponding error log
entry:
12172.19.0.1 - - [05/Oct/2025:12:56:23 +0000] "GET /notfound HTTP/1.1" 404 153 "-" "Mozilla/5.0 (Windows NT 10.0; Win64; x64; rv:143.0) Gecko/20100101 Firefox/143.0" "-"2025/10/05 12:56:23 [error] 33#33: *5 open() "/usr/share/nginx/html/notfound" failed (2: No such file or directory), client: 172.19.0.1, server: localhost, request: "GET /notfound HTTP/1.1", host: "localhost:8000"
This simple setup will be our laboratory for the rest of this guide.
Configuring NGINX access logs: from plain text to JSON
NGINX ships with a default access log format that works well enough for quick inspection and can be parsed by most log processing tools. The problem is that it's fragile, since any change in the format can break downstream parsing.
To build a reliable logging pipeline, it's best to move beyond the default and define a structured format from the start. Logging in JSON is the answer, as it's a universal format that is trivial for any programming language or logging tool to parse.
The access_log directive defines both where logs are written and the format
they use:
1access_log <path> [format];
To enable structured logging, let's create a custom log_format that outputs
JSON. This can be done by placing the following code before the
log_format main <format> line in your NGINX config file:
12345678910111213141516log_format json escape=json'{''"timestamp": "$time_iso8601",''"pid": "$pid",''"client_ip": "$remote_addr",''"request_id": "$request_id",''"http_method": "$request_method",''"http_path": "$uri",''"protocol": "$server_protocol",''"host": "$host",''"user_agent": "$http_user_agent",''"referer": "$http_referer",''"status_code": $status,''"bytes_sent": $body_bytes_sent,''"request_time_secs": $request_time''}';
Then apply the json format in your access_log directive:
1access_log /var/log/nginx/access.log json;
With this in place, every request will be written as structured JSON instead of
the default main format. In the log_format directive, any static text you
wrap in quotes is written literally, and any $variable is replaced with its
current value at runtime.
Note that request headers can be logged with the $http_<headername> variables
(for example $http_user_agent or $http_x_forwarded_for), and response
headers use $sent_http_<headername>.
If you're wondering about other variables you can include, NGINX exposes a long list through its core and module configuration. The NGINX variable index is the authoritative list, and specific modules may provide even more.
After updating your NGINX config once more, restart the nginx service:
1docker compose restart nginx
Incoming requests to the server will now be logged in a clean, flat JSON format:
123456789101112131415{"timestamp": "2025-10-05T13:33:14+00:00","pid": "30","client_ip": "172.19.0.1","request_id": "72e5a0eeb44b6608d161254a5eaf1662","http_method": "GET","http_path": "/","protocol": "HTTP/1.1","host": "localhost","user_agent": "curl/8.5.0","referer": "","status_code": 200,"bytes_sent": 615,"request_time_secs": 0.01}
Setting up NGINX access log levels
Access logs in NGINX don't have a built-in concept of log levels. By default, every entry is treated the same, whether it represents a successful request or a server error. But it's often useful to attach a severity level so that downstream tools can prioritize or filter events more effectively.
The most common way to introduce log levels into access logs is by using the
map directive. This allows you to define a variable whose value depends on
another field, such as the response status code. You can then insert this
variable into your log_format.
Here's an example that maps HTTP status codes to log levels:
123456789101112131415161718# nginx.confhttp {map $status $log_level {~^1 "info";~^2 "info";~^3 "info";~^4 "warn";~^5 "error";default "info";}log_format json escape=json'{''"timestamp":"$time_iso8601",''"level":"$log_level",' # add this line# [...]'}';}
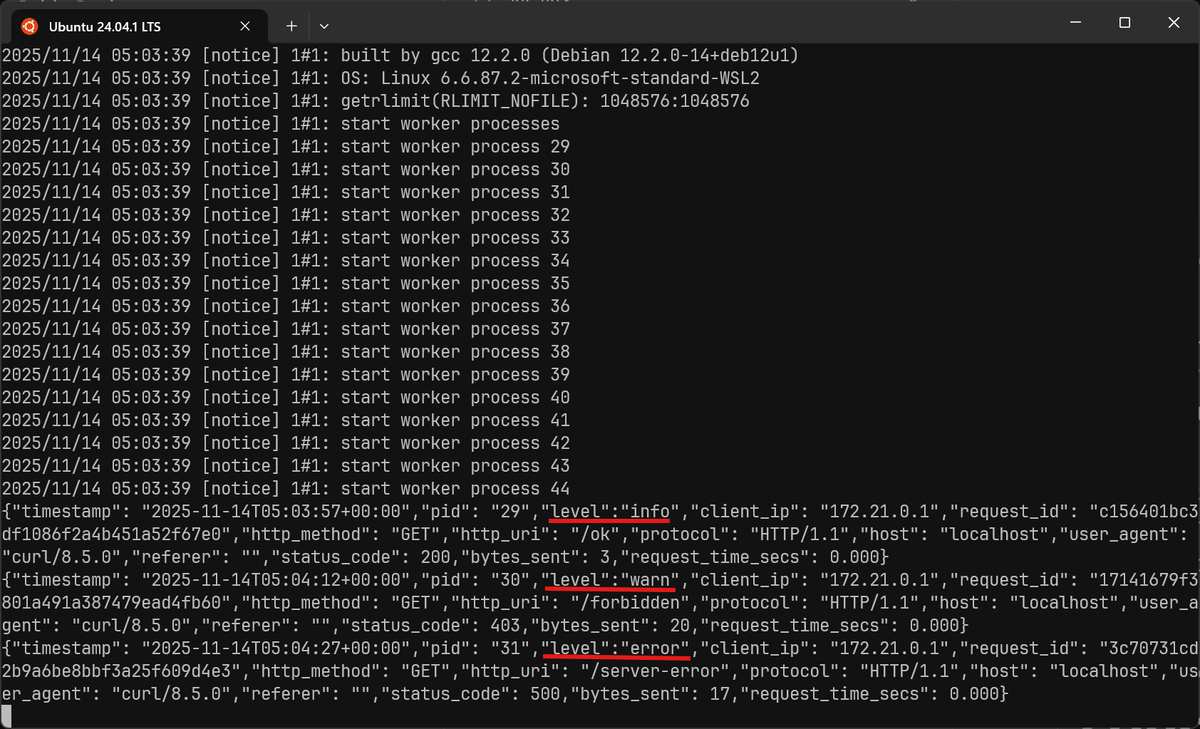
With this configuration:
- Successful and redirection responses are mapped to
info. - Client errors are mapped to
warn. - Server errors are mapped to
error.
Reducing noise with conditional logging
In busy production systems, logging every request is usually unnecessary. For example, writing thousands of lines for successful 200 OK responses to static assets can have you paying for logs that don't add much value.
In NGINX, you can disable such logs through the if= parameter on the
access_log directive. You need to set a variable (the condition) that
evaluates to empty or zero for false, and non-empty for true. You can assign
the variable in several ways, but a common pattern is using the map directive.
Here's an example that suppresses all 2xx logs, but records everything else:
1234567891011# Define a map that sets $should_log to 0 for 2xx responses, and 1 for othersmap $status $should_log {~^[2] 0;default 1;}# Define your JSON format (as before)log_format json ...;# Use the 'if' condition on the access_log directiveaccess_log /var/log/nginx/access.log json if=$should_log;
Such a configuration will drastically reduce your log volume while ensuring you
capture all redirections (3xx), client-side (4xx) and server-side (5xx)
errors.
Disabling NGINX access logs by location
You can also completely disable the access log using the special off value:
1access_log off;
The most common use case is turning off logging completely for high-volume,
low-value endpoints. Health checks (/healthz, /livez) and metrics scraping
(/metrics) are often some of the biggest offenders.
You do this by setting access_log off; inside a location block:
1234# Don't log metrics scrapeslocation /metrics {access_log off;}
This approach keeps your logs focused on meaningful traffic while cutting noise from predictable or low-value endpoints.
Sampling NGINX access logs
If you'd like visibility into all traffic without logging every single request, you can employ sampling. This means recording a subset of successful request logs while always keeping errors.
NGINX supports sampling through the split_clients directive. You can pair it
with a request identifier to randomly select what requests get logged.
Here's an example that samples and logs only 5% of all traffic to the server:
1234567# Randomly sample 5% of requests based on the request_idsplit_clients $request_id $sample {5% 1;* 0;}access_log /var/log/nginx/access.log json if=$sample;
In this setup, NGINX evaluates each request's $request_id to determine whether
it falls within the 5% sample. You can also combine sampling with conditional
logging for finer control:
1234567891011121314151617181920# Log only non-2xx responsesmap $status $log_non_2xx {~^[2] 0;default 1;}# Randomly sample 5% of all requestssplit_clients $request_id $sample {5% 1;* 0;}# Log if request is an error OR selected in the samplemap "$log_non_2xx:$sample" $should_log {"1:0" 1;"0:1" 1;default 0;}access_log /var/log/nginx/access.log json if=$should_log;
With this configuration:
- All non-2xx responses (errors and redirects) are always logged.
- 5% of all other requests are logged at random.
Note that you're not limited to using the $request_id for sampling. You can
base sampling on any variable that helps you segment traffic in a way that's
meaningful to you.
Sampling is a practical compromise between visibility, efficiency, and cost. By tuning your sample rate and combining it with conditional logging, you'll maintain meaningful observability while keeping storage and ingestion costs under control.
Configuring NGINX error logs
The error_log directive configures where and how NGINX reports problems. Its
syntax is straightforward:
1error_log <path> [level];
The path defines where the log file is stored, and the level sets the
minimum severity of messages to include.
Error logs can be tuned to capture only what you care about. Levels range from most to least severe:
emerg: Emergency situations where the system is unusable.alert: A serious issue requiring immediate action.crit: Critical conditions that need to be addressed.error: A standard error occurred during request processing. This is the default level.warn: A warning about an unusual event that is not necessarily an error but should be investigated.notice: A noteworthy, normal event.info: Informational messages about processing.debug: Highly detailed debugging information.
When you choose a level, NGINX logs messages at that level and all levels above
it. For example, setting warn will also log error, crit, alert, and
emerg messages.
A common configuration looks like this:
1error_log /var/log/nginx/error.log warn;
This keeps logs concise in production, while still recording warnings and errors that may require attention.
Understanding the default error log format
NGINX error logs are plain text, with each line following a consistent structure:
122025/10/05 13:42:23 [notice] 1#1: start worker process 432025/10/05 14:32:10 [error] 12345#12345: *7 open() "/usr/share/nginx/html/missing.html" failed (2: No such file or directory), client: 172.19.0.1, server: localhost, request: "GET /missing.html HTTP/1.1", host: "localhost:8000"
A typical entry contains:
- When the error occurred,
- The log level in square brackets (
[error],[warn]), - Process and thread ID (
12345#12345), - The connection ID,
- And the actual issue, with some contextual details.
This format is easy to read for humans and generally good enough for troubleshooting, but it isn't designed to be customizable. You can only configure what gets logged (via severity levels), not how the line is structured.
This means that the only way to customize the error log format is through downstream log processors rather than modifying the format in NGINX itself. You'll see how to implement this later in this article.
Integrating NGINX logs with OpenTelemetry
NGINX logs are valuable on their own, but they become much more valuable when correlated with other telemetry from your systems. The industry standard way to achieve this unified view is OpenTelemetry (OTel).
OpenTelemetry is an open, vendor-neutral standard for instrumenting, collecting, and processing metrics, traces, and logs. When you align NGINX logs with the OpenTelemetry data model and semantic conventions, they are transformed from isolated text or JSON strings into a useful signal for observability.
The remainder of this guide will focus entirely on showing how to build this modern, scalable pipeline by configuring Docker, NGINX, and the OpenTelemetry Collector to work in harmony.
Bringing NGINX logs into an OpenTelemetry pipeline
The first step is ingesting your NGINX logs into an OTel pipeline through the
OpenTelemetry Collector. To do this, you must move away from Docker's default
json-file logging driver which writes collected logs to files on the host at
/var/lib/docker/containers/.
It's best to configure Docker to use a different logging driver for the service to stream the logs from relevant containers directly to the OTel Collector.
For this guide, let's use the fluentd driver, which pairs perfectly with the Collector's fluentforward receiver.
To set this up, modify your nginx service as follows:
123456789101112131415161718# docker-compose.ymlservices:nginx:image: nginx:1.29.1container_name: nginx-serverports:- 8000:80volumes:- ./nginx.conf:/etc/nginx/nginx.conf:ro# add the following lineslogging:driver: fluentdoptions:fluentd-address: localhost:8006tag: nginx.myappdepends_on: [otelcol]# [...]
This configuration instructs the Docker daemon to stop using the default
json-file logging driver for the nginx container.
Instead, it activates the fluentd logging driver so that Docker wraps each log
in the Fluentd Forward protocol, and sends it to the specified
fluentd-address. Every log message sent will also be tagged with
nginx.myapp, so that the Collector can easily identify the log stream.
Follow that up by adding an otelcol service to your Docker Compose
configuration as shown below. It needs to expose the 8006 port as that's where
the Fluentd Forward receiver will be listening for events:
123456789101112# docker-compose.ymlservices:# [...]otelcol:image: otel/opentelemetry-collector-contrib:0.139.0container_name: otelcolvolumes:- ./otelcol.yaml:/etc/otelcol-contrib/config.yamlrestart: unless-stoppedports:- 8006:8006
You'll then need to create your Collector configuration file at the project root and populate it as follows:
123456789101112131415161718# otelcol.yamlreceivers:fluentforward:endpoint: 0.0.0.0:8006processors:batch:exporters:debug:verbosity: detailedservice:pipelines:logs:receivers: [fluentforward]processors: [batch]exporters: [debug]
The fluentforward receiver sets up a TCP server at port 8006 that accepts
events via the
Fluentd Forward protocol
and they are subsequently batched and dispatched to the Collector's stdout
using the
debug exporter.
If you're reading NGINX logs from files on the local filesystem (such as
/var/log/nginx/*.log), then the
filelog receiver
is the right Collector component to use instead:
1234567# otelcol.yamlreceivers:filelog:include:- /var/log/nginx/*.logstart_at: beginning# [...]
Once you're all set, start the services once again with:
1docker compose up -d
Once they're up and running, you can tail the Collector logs to see the NGINX logs:
1docker compose logs -f --no-log-prefix otelcol
A typical access and error log entry will look like this:
12345678910111213141516171819202122232425262728293031LogRecord #0ObservedTimestamp: 1970-01-01 00:00:00 +0000 UTCTimestamp: 2025-11-12 10:22:47 +0000 UTCSeverityText:SeverityNumber: Unspecified(0)Body: Str({"timestamp": "2025-11-12T10:22:47+00:00","level":"INFO","client_ip": "172.22.0.1","request_id": "9b9ab84d6b1481812379e79cb51eb227","http_method": "GET","http_path": "/","protocol": "HTTP/1.1","host": "localhost","user_agent": "Mozilla/5.0 (Windows NT 10.0; Win64; x64; rv:144.0) Gecko/20100101 Firefox/144.0","referer": "","status_code": 304,"bytes_sent": 0,"request_time_secs": 0.000})Attributes:-> fluent.tag: Str(nginx.myapp)-> container_id: Str(f4d72b5e4bce143b165819e6dc225db8237fffb0e12311ecada9b66b563b8b32)-> container_name: Str(/nginx-server)-> source: Str(stdout)Trace ID:Span ID:Flags: 0. . .LogRecord #0ObservedTimestamp: 1970-01-01 00:00:00 +0000 UTCTimestamp: 2025-11-13 19:19:55 +0000 UTCSeverityText:SeverityNumber: Unspecified(0)Body: Str(2025/11/13 19:19:55 [notice] 1#1: start worker process 44)Attributes:-> fluent.tag: Str(nginx.myapp)-> container_name: Str(/nginx-server)-> source: Str(stderr)-> container_id: Str(f4d72b5e4bce143b165819e6dc225db8237fffb0e12311ecada9b66b563b8b32)Trace ID:Span ID:Flags: 0
This output shows OpenTelemetry's representation of each log record, and it immediately highlights a central challenge: you are receiving two completely different log formats in the same pipeline.
- In the access log entry, the
Bodyis a JSON string that just needs to be parsed to extract the structured data. - The error log is a plain-text string that needs to be structured from scratch.
In both cases, the only attributes present are the external metadata provided by
the fluentforward receiver (like container_name and fluent.tag), not the
actual data from NGINX.
Therefore, the next step is to build a processing pipeline that can intelligently:
- Parse both formats (JSON for access logs, Regex for error logs).
- Extract their data into the
Attributesmap. - Promote key fields (like the timestamp and log level) to the top-level OTel record.
- Normalize the fields to conform with OpenTelemetry's semantic conventions.
The most powerful component for modifying telemetry data in an OpenTelemetry pipeline is the transform processor which uses the OpenTelemetry Transform Language (OTTL), and it's what you'll use for all the tasks above.
Let's proceed with the access logs first.
Parsing NGINX access logs
Here's how to configure the transform processor to parse the JSON-string
access logs and extract their fields into the Attributes map:
123456789101112131415161718# otelcol.yaml# [...]processors:transform/parse_nginx_logs:log_statements:- context: logconditions:- body != nil and Substring(body, 0, 2) == "{\""statements:- merge_maps(attributes, ParseJSON(body), "upsert")# [...]service:pipelines:logs:receivers: [fluentforward]processors: [batch, transform/parse_nginx_logs] # <-- Make sure it's hereexporters: [debug]
The conditions block ensures that each line in statements only runs on the
JSON access logs, skipping the plain-text error logs.
The statements block then executes ParseJSON(body) to convert the JSON
string into a structured map. This map is immediately merged into the log
record's attributes using merge_maps().
The upsert flag ensures all fields from your JSON log are added to the
attributes, overwriting any pre-existing attributes with the same name.
This produces the following result once you restart the otelcol service and
send a request to the NGINX server:
123456789101112131415161718192021222324252627LogRecord #0ObservedTimestamp: 1970-01-01 00:00:00 +0000 UTCTimestamp: 2025-11-12 12:56:35 +0000 UTCSeverityText:SeverityNumber: Unspecified(0)Body: Str({"timestamp": "2025-11-12T12:56:35+00:00","level":"INFO","client_ip": "172.22.0.1","request_id": "01424471f02e34f9f1549bbe0c70f640","http_method": "GET","http_path": "/","protocol": "HTTP/1.1","host": "localhost","user_agent": "Mozilla/5.0 (Windows NT 10.0; Win64; x64; rv:144.0) Gecko/20100101 Firefox/144.0","referer": "","status_code": 304,"bytes_sent": 0,"request_time_secs": 0.000})Attributes:-> fluent.tag: Str(nginx.myapp)-> container_id: Str(e71da5c46649453a07e75a244ace89dd838182c6ec87234741a384880b445123)-> container_name: Str(/nginx-server)-> source: Str(stdout)-> http_path: Str(/)-> status_code: Double(304)-> timestamp: Str(2025-11-12T12:56:35+00:00)-> protocol: Str(HTTP/1.1)-> host: Str(localhost)-> user_agent: Str(Mozilla/5.0 (Windows NT 10.0; Win64; x64; rv:144.0) Gecko/20100101 Firefox/144.0)-> referer: Str()-> bytes_sent: Double(0)-> request_time_secs: Double(0)-> level: Str(INFO)-> client_ip: Str(172.22.0.1)-> request_id: Str(01424471f02e34f9f1549bbe0c70f640)-> http_method: Str(GET)Trace ID:Span ID:Flags: 0
Next, you'll want to promote the level attribute to OpenTelemetry's standard
SeverityText and SeverityNumber fields. This is necessary for allowing
observability backends to correctly
color-code, filter, and alert on log severity.
Let's define these promotion rules in a new, separate statement group so that they are also applied to the error logs later, so that both log streams are normalized consistently:
123456789101112131415161718192021222324# otelcol.yamlprocessors:batch:transform/parse_nginx_logs:log_statements:- context: logconditions:- body != nil and Substring(body, 0, 2) == "{\""statements:- merge_maps(attributes, ParseJSON(body), "upsert")# No conditions, so applies to both access and error logs- context: logstatements:- set(severity_text, ToUpperCase(attributes["level"])) whereattributes["level"] != nil- set(severity_number, 5) where attributes["level"] == "debug"- set(severity_number, 9) where attributes["level"] == "info"- set(severity_number, 9) where attributes["level"] == "notice"- set(severity_number, 13) where attributes["level"] == "warn"- set(severity_number, 17) where attributes["level"] == "error"- set(severity_number, 21) where attributes["level"] == "crit"- set(severity_number, 23) where attributes["level"] == "alert"- set(severity_number, 24) where attributes["level"] == "emerg"
This produces the following output (when level is info):
12SeverityText: INFOSeverityNumber: Info(9)
You'll also want to ensure that the Timestamp and ObservedTimestamp are
sourced from the log record.
You can add this logic, along with the cleanup for the now-redundant level and
timestamp attributes, to the following statements block:
1234567891011121314# otelcol.yamlprocessors:transform/parse_nginx_logs:log_statements:- context: logconditions:- body != nil and Substring(body, 0, 2) == "{\""statements:# [...]- set(time, Time(attributes["timestamp"], "%Y-%m-%dT%H:%M:%S%j"))where attributes["timestamp"] != nil- set(observed_time, time)- delete_key(attributes, "timestamp")- delete_key(attributes, "level")
This yields the correct timestamp designation:
12ObservedTimestamp: 2025-11-12 13:31:51 +0000 UTCTimestamp: 2025-11-12 13:31:51 +0000 UTC
With these rules in place, your log records are now correctly timed and leveled. The next step is to align the rest of your attributes with the OpenTelemetry semantic conventions so that your logs use consistent field names across different services and components.
Mapping attributes to semantic conventions
Semantic conventions are the shared language of OpenTelemetry. They are predefined attribute names designed to make telemetry data consistent, portable, and automatically understood by observability backends.
Instead of each service inventing its own field names, OpenTelemetry defines a
single, shared key. For example, if all services map their client IP to the
standard
client.address attribute,
your observability platform can recognize it as the same piece of data which
enables seamless correlation.
While you could use the transform processor to rename all these fields, the
far better approach is to use the correct names at the source. This is more
efficient, as it avoids extra processing, and it simplifies your collector
configuration.
Here's an updated json log format that adheres to OpenTelemetry semantic
conventions for each included field:
12345678910111213141516171819# nginx.conflog_format json escape=json'{''"timestamp": "$time_iso8601",''"level": "$log_level",''"client.address": "$remote_addr",''"client.port": "$remote_port",''"url.path": "$uri",''"url.query": "$args",''"network.protocol.name": "$server_protocol",''"server.address": "$host",''"server.port": "$server_port",''"user_agent.original": "$http_user_agent",''"http.request.method": "$request_method",''"http.request.header.referer": "$http_referer",''"http.response.status_code": $status,''"http.response.body.size": $body_bytes_sent,''"http.server.request.duration": $request_time''}';
With this change, Attributes from access log entries will be almost perfect.
However, there are still some adjustments to make in the Collector to be fully
compliant:
container_nameandcontainer_idshould map to container.name and container.id and promoted to resource attributes.client.portandserver.portare strings but should be integers.- The
sourceattribute should be log.iostream. network.protocol.namehas the valueHTTP/1.1, but should behttp, with1.1split intonetwork.protocol.version.http.response.status_codeandhttp.response.body.sizeshould be integers.- The original JSON log record should be preserved in
log.record.original. - The
Bodyshould be a simple, human-readable string.
Here are the additional transform statements to achieve all of the above:
1234567891011121314151617181920212223242526272829303132# otelcol.yamlprocessors:transform/parse_nginx_logs:log_statements:- context: logconditions:- body != nil and substring(body, 0, 2) == "{\""statements:# [...]- set(attributes["client.port"], Int(attributes["client.port"]))- set(attributes["server.port"], Int(attributes["server.port"]))- set(attributes["network.protocol.version"], Split(attributes["network.protocol.name"], "/")[1])- set(attributes["network.protocol.name"], ToLower(Split(attributes["network.protocol.name"], "/")[0]))- set(attributes["http.response.status_code"], Int(attributes["http.response.status_code"]))- set(attributes["http.response.body.size"], Int(attributes["http.response.body.size"]))- set(attributes["log.record.original"], body)- set(body, Concat(["NGINX access log - ", attributes["http.request.method"], " ", attributes["url.path"], "?", attributes["url.query"], " -> ", attributes["http.response.status_code"]], ""))- context: logstatements:# [...existing severity statements]- set(attributes["log.iostream"], attributes["source"])- delete_key(attributes, "source")# Add a new group to set resource attributes- statements:- set(resource.attributes["container.id"], log.attributes["container_id"])- set(resource.attributes["container.name"], log.attributes["container_name"])- set(resource.attributes["fluent.tag"], log.attributes["fluent.tag"])- delete_key(log.attributes, "container_id")- delete_key(log.attributes, "container_name")- delete_key(log.attributes, "fluent.tag")
The updated OpenTelemetry access log record now looks like this:
12345678910111213141516171819202122232425262728293031323334ResourceLog #0Resource SchemaURL:Resource attributes:-> container.id: Str(de3905b50ebbace241de65d0020a4ac9a2f4cb8a330453434b0e08513d06b315)-> fluent.tag: Str(nginx.myapp)-> container.name: Str(/nginx-server)ScopeLogs #0ScopeLogs SchemaURL:InstrumentationScopeLogRecord #0ObservedTimestamp: 2025-11-13 07:31:07 +0000 UTCTimestamp: 2025-11-13 07:31:07 +0000 UTCSeverityText: INFOSeverityNumber: Info(9)Body: Str(NGINX access log - GET / -> 304)Attributes:-> log.iostream: Str(stdout)-> url.path: Str(/)-> network.protocol.name: Str(http)-> http.request.method: Str(GET)-> http.response.body.size: Int(0)-> http.server.request.duration: Double(0)-> client.port: Int(39464)-> url.query: Str()-> server.port: Int(80)-> http.request.header.referer: Str()-> server.address: Str(localhost)-> user_agent.original: Str(Mozilla/5.0 (Windows NT 10.0; Win64; x64; rv:144.0) Gecko/20100101 Firefox/144.0)-> http.response.status_code: Int(304)-> network.protocol.version: Str(1.1)-> client.address: Str(172.22.0.1)Trace ID:Span ID:Flags: 0
Correlating NGINX logs and traces
Logs become even more valuable when you can connect them to traces. A trace
represents the journey of a single request through your system, with each step
getting a unique span_id.
When your NGINX access log captures these IDs, you unlock a the ability to jump directly from a single log entry to the linked distributed trace that shows the request's entire lifecycle, including the exact point the log was emitted.
To support this, you need the ngx_otel_module, which adds native OpenTelemetry tracing to NGINX. In a Docker setup, this means using an image that includes the module:
1234# docker-compose.ymlservices:nginx:image: nginx:1.29.1-otel # use this OTel image
Next, in your nginx.conf, you need to load the module and tell it to propagate
trace context:
1234567891011121314151617# nginx.confuser nginx;worker_processes auto;error_log /var/log/nginx/error.log notice;pid /run/nginx.pid;# 1. Load the module at the top levelload_module modules/ngx_otel_module.so;. . .http {# 2. Enable W3C trace context propagationotel_trace_context propagate;. . .}
The otel_trace_context propagate directive ensures that if a request includes
trace context headers, NGINX reuses them. If no headers are present, NGINX
generates a new trace ID automatically.
Most importantly, this module makes the trace information available to NGINX as
variables (like $otel_trace_id and $otel_span_id), which you can now add to
your JSON log format.
Adding trace context fields to NGINX logs
To include trace identifiers in your access logs, extend your log_format with
the following $otel_* variables:
1234567log_format json escape=json'{'# [...]'"trace_id": "$otel_trace_id",''"span_id": "$otel_span_id",''"parent_sampled": $otel_parent_sampled''}';
With these variables now present, sending a request that includes a W3C
traceparent header will result in those IDs being recorded in the
corresponding log entries:
12curl 'http://localhost:8000?userID=1234' \-H 'traceparent: 00-4bf92f3577b34da6a3ce929d0e0e4736-00f067aa0ba902b7-01'
123456{[...],"trace_id": "4bf92f3577b34da6a3ce929d0e0e4736","span_id": "05a62836f6cc1b17","parent_sampled": 1}
While requests without the traceparent header generate new IDs:
1curl 'http://localhost:8000?userID=1234'
123456{[...],"trace_id": "eede940b121ead9ef3fd3b3d912b7596","span_id": "c0cd388d0f7d8cea","parent_sampled": 0}
Now that the trace context fields are present in your log attributes, the final
step is ensuring that they're promoted into the standard Trace ID, Span ID,
and Flags fields.
The following OTTL statements are what you need to include:
1234567891011121314151617# otelcol.yamlprocessors:transform/parse_nginx_logs:log_statements:- context: logconditions:- body != nil and substring(body, 0, 2) == "{\""statements:# [...]# set trace context fields- set(trace_id.string, attributes["trace_id"]) where attributes["trace_id"] != nil and Len(attributes["trace_id"]) == 32- set(span_id.string, attributes["span_id"]) where attributes["span_id"] != nil and Len(attributes["span_id"]) == 16- set(flags, attributes["parent_sampled"]) where attributes["parent_sampled"] != nil# delete the now redundant attributes- delete_key(attributes, "trace_id")- delete_key(attributes, "span_id")- delete_key(attributes, "parent_sampled")
The result is a perfectly compliant OpenTelemetry access log record with
Trace ID, Span ID, and Flags now set:
1234567891011LogRecord #0ObservedTimestamp: 2025-10-05 22:52:23.784085403 +0000 UTCTimestamp: 2025-10-05 22:34:38 +0000 UTCSeverityText: INFOSeverityNumber: Info(9)Body: Str(...)Attributes:. . .Trace ID: eede940b121ead9ef3fd3b3d912b7596Span ID: c0cd388d0f7d8ceaFlags: 1
Parsing NGINX error logs
You've successfully handled the NGINX access logs, but now face a different
challenge: structuring the plain-text error logs. This means making the
transform processor smart enough to handle both formats.
Since error logs cannot be formatted as JSON at the source, you'll need to use regular expressions to extract relevant fields and align them with the OpenTelemetry log data model. For example:
- The
[error]token should map directly toSeverityNumberandSeverityText. - The timestamp at the start of the line should be used to populate the timestamp fields.
- The trailing diagnostic string (e.g.
"open() ... failed") maps toBody. - Key-value pairs like
client: 172.19.0.1should be pulled intoAttributes.
To achieve this, you need to create a new group of OTTL statements that only targets non-JSON logs and use a regular expression to parse the text:
1234567891011121314processors:batch:transform/parse_nginx_logs:log_statements:# [...]# Add a new block for plain-text error logs- context: logconditions:- body != nil and IsMatch(body, "^[0-9]{4}/[0-9]{2}/[0-9]{2} ")statements:- merge_maps(attributes, ExtractPatterns(body, "^(?P<timestamp>\\d{4}/\\d{2}/\\d{2} \\d{2}:\\d{2}:\\d{2}) \\[(?P<level>[a-z]+)\\] (?P<pid>\\d+)#(?P<tid>\\d+):(?:\\ \\*(?P<cid>\\d+))? (?P<message>[^,]+)(?:, )?(?:(?P<raw_attrs>.+)?)?$"), "upsert")- replace_pattern(attributes["raw_attrs"], "\"", "") where attributes["raw_attrs"] != nil- merge_maps(attributes, ParseKeyValue(attributes["raw_attrs"], ":", ", "), "upsert") where attributes["raw_attrs"] != nil and attributes["raw_attrs"] != ""- delete_key(attributes, "raw_attrs")
This block starts by making sure the log line isn't JSON by matching only lines
beginning with YYYY/MM/DD.
Then ExtractPatterns() is used to pull out the standard NGINX error prefix
through named capture groups. It's also designed to capture the clean message
and intelligently group the rest of the messy key-value pairs into a single
temporary attribute called raw_attrs.
The next lines focus only on raw_attrs. After a quick cleanup, ParseKeyValue()
finishes the job by splitting the string into proper key-value attributes (like
client, server, etc.).
The result looks like this:
123456789101112131415161718192021LogRecord #0ObservedTimestamp: 1970-01-01 00:00:00 +0000 UTCTimestamp: 2025-11-13 13:43:25 +0000 UTCSeverityText: ERRORSeverityNumber: Error(17)Body: Str(2025/11/13 13:43:25 [error] 29#29: *1 open() "/usr/share/nginx/html/missing" failed (2: No such file or directory), client: 172.21.0.1, server: localhost, request: "GET /missing HTTP/1.1", host: "localhost:8000")Attributes:-> client: Str(172.21.0.1)-> server: Str(localhost)-> log.iostream: Str(stderr)-> request: Str(GET /missing HTTP/1.1)-> timestamp: Str(2025/11/13 13:43:25)-> level: Str(error)-> pid: Str(29)-> tid: Str(29)-> cid: Str(1)-> message: Str(open() "/usr/share/nginx/html/missing" failed (2: No such file or directory))-> host: Str(localhost:8000)Trace ID:Span ID:Flags: 0
The next step is to update the newly structured fields to follow semantic conventions:
123456789101112131415161718192021222324252627282930313233343536373839404142# otelcol.yamlprocessors:transform/parse_nginx_logs:log_statements:# [...]- context: logconditions:- body != nil and IsMatch(body, "^[0-9]{4}/[0-9]{2}/[0-9]{2} ")statements:# [...]- set(attributes["client.address"], attributes["client"]) where attributes["client"] != nil- set(attributes["http.request.header.host"], attributes["host"]) where attributes["host"] != nil- set(attributes["server.address"], Split(attributes["host"], ":")[0]) where attributes["host"] != nil- set(attributes["server.port"], Int(Split(attributes["host"], ":")[1])) where attributes["host"] != nil- set(attributes["http.request.method"], Split(attributes["request"], " ")[0]) where attributes["request"] != nil- set(attributes["url.path"], Split(attributes["request"], " ")[1]) where attributes["request"] != nil- set(attributes["network.protocol.name"], ToLowerCase(Split(Split(attributes["request"], " ")[2], "/")[0])) where attributes["request"] != nil- set(attributes["network.protocol.version"], Split(Split(attributes["request"], " ")[2], "/")[1]) where attributes["request"] != nil- set(attributes["log.record.original"], body)- set(body, attributes["message"])- set(attributes["network.connection.id"], Int(attributes["cid"])) where attributes["cid"] != nil- set(attributes["thread.id"], Int(attributes["tid"])) where attributes["tid"] != nil- set(time, Time(attributes["timestamp"], "%Y/%m/%d %H:%M:%S")) where attributes["timestamp"] != nil- set(observed_time, time) where attributes["timestamp"] != nil delete_key(attributes, "timestamp")- delete_key(attributes, "tid")- delete_key(attributes, "message")- delete_key(attributes, "client")- delete_key(attributes, "server")- delete_key(attributes, "host")- delete_key(attributes, "request")- delete_key(attributes, "cid")# [...]- statements:# [...]- set(resource.attributes["process.id"], Int(log.attributes["pid"]))where log.attributes["pid"] != nil- delete_key(log.attributes, "pid")
This final set of transformations produces a clean, structured, and semantically
compliant log record. The Body is now the simple error message, and all the
associated context has been mapped into compliant attributes:
12345678910111213141516171819202122LogRecord #0ObservedTimestamp: 2025-11-13 18:31:51 +0000 UTCTimestamp: 2025-11-13 18:31:51 +0000 UTCSeverityText: ERRORSeverityNumber: Error(17)Body: Str(open() "/usr/share/nginx/html/missing" failed (2: No such file or directory))Attributes:-> url.path: Str(/missing)-> client.address: Str(172.21.0.1)-> log.iostream: Str(stderr)-> http.request.header.host: Str(localhost:8000)-> thread.id: Int(29)-> server.address: Str(localhost)-> http.request.method: Str(GET)-> network.connection.id: Int(1)-> server.port: Int(8000)-> log.record.original: Str(2025/11/13 18:31:51 [error] 29#29: *1 open() "/usr/share/nginx/html/missing" failed (2: No such file or directory), client: 172.21.0.1, server: localhost, request: "GET /missing HTTP/1.1", host: "localhost:8000")-> network.protocol.version: Str(1.1)-> network.protocol.name: Str(http)Trace ID:Span ID:Flags: 0
The only thing missing now is the trace context. Since the error logging
mechanism is separate from request processing, it doesn't have access to
request-level variables like $otel_trace_id.
At the time of writing, this means there is no straightforward way to get a perfect, 1:1 correlation between a failed request's access log and its corresponding error log.
Sending NGINX logs to an observability platform
So far, you've built a local-only pipeline where logs are dumped to
the console using the debug exporter.
This is perfect for a lab, but the entire goal of this process is to get these valuable logs into an observability platform they can be used to investigate your systems.
Dash0 is one such solution that's designed to automatically recognize the semantic conventions and correlated trace IDs you just configured, giving you a great out-of-the-box experience for your NGINX logs.
This final step is simple. After
retrieving your Dash0 credentials,
you only need to swap the debug exporter with the
otlp exporter (or
otlphttp),
which is the standard, vendor-neutral way to send telemetry:
1234567891011121314151617# otelcol.yaml# [...]exporters:debug:verbosity: detailedotlphttp/dash0:endpoint: <your_dash0_endpoint>headers:Authorization: Bearer <your_dash0_token>Dash0-Dataset: <your_dash0_dataset>service:pipelines:logs:receivers: [fluentforward]processors: [batch, transform/parse_nginx_logs]exporters: [otlphttp/dash0] # <- update to this
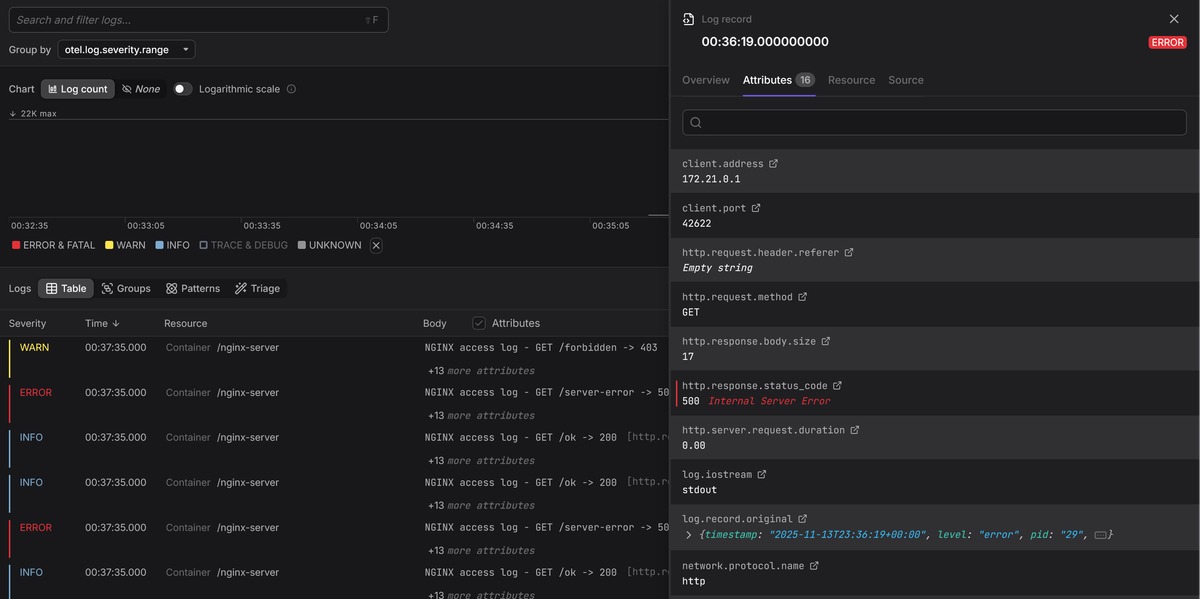
Within moments, your NGINX logs will begin appearing in the Dash0 interface, where you can inspect, filter, and correlate them as needed:
Before you point this pipeline at a production environment, ensure to:
- Scrub sensitive data like authorization headers, passwords, and personal information from your logs with the transform processor.
- Filter noise at the source by using the
access_log off;directive in yournginx.conffor high-volume, low-value endpoints. - Sample successful requests using the
split_clientsdirective to log 100% of errors but only a small percentage of 2xx traffic to save costs.
Final thoughts
With these practices in place, NGINX stops being just an entry point for traffic and becomes a fully-integrated entry point for insight.
Instead of grepping and tailing unstructured log files, you now have a complete pipeline that transforms raw, mixed-format logs into structured, queryable data.
Logging doesn't have to be an afterthought. Get it right, as you've done here, and it becomes one of your most powerful tools for understanding and improving your systems.
See the full example on GitHub.
