Last updated: June 29, 2026
Dozzle: How to View Docker Container Logs in Real Time
Docker makes it easy to start services, but not always easy to follow what they
are doing. The built-in docker logs command works well for a single container,
especially when you already know where to look. It becomes less convenient when
you want to compare several services, filter noisy output, share access with a
teammate, or keep an eye on logs without staying attached to a terminal.
Dozzle solves that narrow problem with a focused web interface for live container logs. It streams stdout and stderr from your containers into the browser, gives you search and filtering controls, and lets you inspect logs across a running Docker host without building a full logging platform first.
This guide walks through what it takes to make Dozzle useful in practice: installation with Docker Compose, the main configuration options, authentication and security, multi-host monitoring with agents, SQL log queries through DuckDB, and the point where a real-time log viewer stops being enough.
It also covers the line where Dozzle stops being the right fit. Dozzle is a real-time viewer, not a long-term log management or observability platform, and that distinction matters once you need retention, correlation, alerting, or analysis over time.
For broader context on how Docker collects and exposes container logs, start with our docker logs guide first.
Prerequisites
You need a recent version of Docker Engine and Docker Compose installed on your machine to follow along. You'll also want at least one running container that's producing logs so you have something to look at once Dozzle is up and running.
What is Dozzle?
Dozzle is a stateless, browser-based log tail for Docker
containers. It reads from the Docker API, the same source that powers
docker logs, and streams that output to a web UI.
If a container crashes, Dozzle shows you whatever Docker still has in its log
buffer (controlled by your logging driver's --log-opt max-size setting). It
doesn't maintain its own history on top of that, so searching last week's logs
or building dashboards over time isn't possible. The upside is that the image is
about 7 MB compressed, it barely touches CPU or memory, and there's nothing to
configure before logs start showing up.
Dozzle fits well in a few specific scenarios. For local development, it's great for watching logs from your Compose stack in one tab while you work. In staging and CI environments, it gives you a quick visual check of what's happening during deploys or test runs. For homelab and self-hosted setups, it lets you monitor a handful of services without any infrastructure overhead.
It doesn't fit where you need historical search beyond what Docker can retain on disk, log retention for compliance, or team-scale access controls. I'll cover what to reach for when you outgrow it by the end of this guide.
Dozzle and log driver compatibility
Dozzle reads logs through the Docker API, the same endpoint behind
docker logs. On any Docker Engine from 20.10 onward, this works with every
logging driver out of the box.
If you're shipping logs to a remote destination via splunk, fluentd, or
awslogs, Docker automatically caches a local copy using its
dual logging feature,
and Dozzle reads from that cache.
The cache defaults to 5 rotated files of 20 MB each per container (before
compression), which is plenty for live tailing. You can tune those limits with
the cache-max-size and cache-max-file options in your daemon configuration.
If Dozzle shows an empty log stream for a container that's definitely producing output, check the container's log config:
123docker inspect \--format='{{json .HostConfig.LogConfig}}' \<container_name>
If the Type is json-file, local, or journald, those drivers support
docker logs natively and Dozzle will always work. You'll typically see
something like {"Type":"json-file","Config":{}}, which is fine.
If the Type is a remote driver like splunk, fluentd, or awslogs, look
for cache-disabled in the Config object. When it's absent or "false", the
dual logging cache is active and Dozzle works normally.
If it's "true", that's what's blocking Dozzle. Check /etc/docker/daemon.json
too, since it can set cache-disabled as a daemon-wide default. Our
Mastering Docker Logs
guide has the full breakdown of driver behavior and cache configuration.
Installing and running Dozzle
The fastest way to get Dozzle running is a single docker run command:
123456docker run -d \--name dozzle \--volume=/var/run/docker.sock:/var/run/docker.sock:ro \-p 8080:8080 \amir20/dozzle:latest \--no-analytics
A few things worth noting about those flags:
- The
--volumeflag mounts the Docker socket into the container so Dozzle can talk to the Docker API. The:rosuffix makes it a read-only mount, which is a basic security measure. - The
-p 8080:8080maps port 8080 on your host to port 8080 inside the container (Dozzle's default). - Finally,
--no-analyticsdisables the anonymous usage analytics that Dozzle collects by default via Google Analytics.
Confirm it's running:
1docker ps --filter name=dozzle
You should see output showing the dozzle container in a running state with
port 8080 mapped:
12CONTAINER ID IMAGE COMMAND CREATED STATUS PORTS NAMESd9d1dcf07f96 amir20/dozzle:latest "/dozzle --no-analyt…" About a minute ago Up About a minute 0.0.0.0:8080->8080/tcp, [::]:8080->8080/tcp dozzle
For anything beyond a quick test, use a Compose file to run it alongside your services. Here's a complete setup with sensible defaults:
1234567891011121314services:dozzle:image: amir20/dozzle:latestcontainer_name: dozzlerestart: unless-stoppedvolumes:- /var/run/docker.sock:/var/run/docker.sock:roports:- "8080:8080"environment:DOZZLE_NO_ANALYTICS: "true"DOZZLE_LEVEL: infoDOZZLE_TAILSIZE: 300DOZZLE_FILTER: "status=running"
DOZZLE_LEVELcontrols Dozzle's own log verbosity, not the logs it displays.DOZZLE_TAILSIZEsets how many lines Dozzle fetches when you first open a container's log stream (300 is a good balance between context and load time).DOZZLE_FILTERset tostatus=runningprevents stopped containers from cluttering the sidebar, which gets noisy fast on hosts with containers that start and stop frequently.
Once configured, start it with:
1docker compose up -d
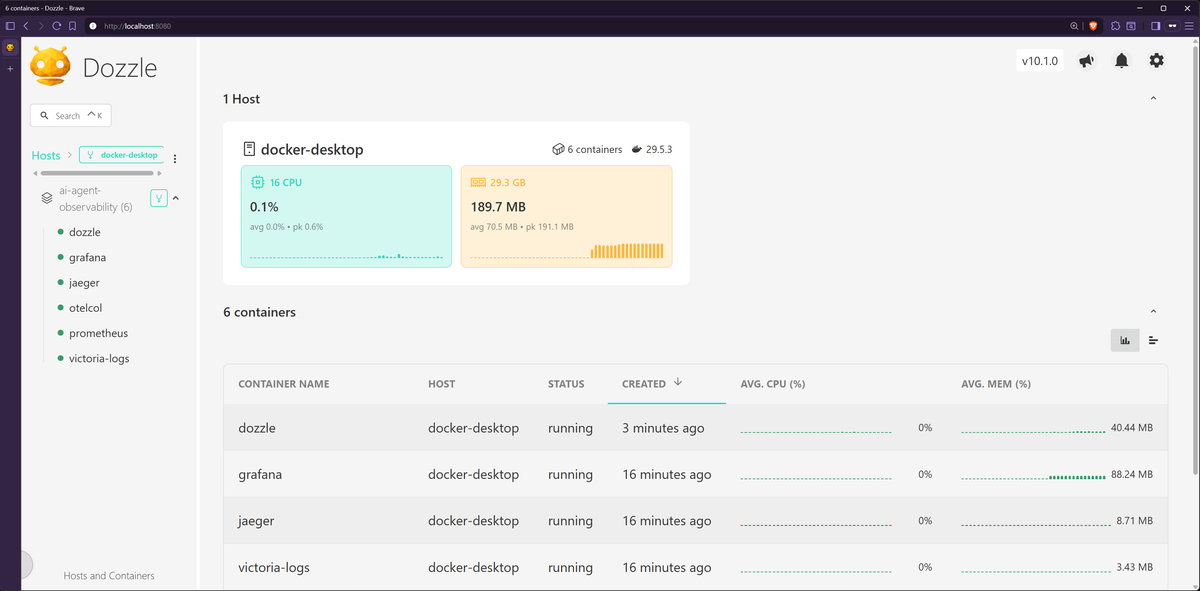
To verify that Dozzle is up and running, open http://localhost:8080 in your
browser. You should see the Dozzle interface with a sidebar listing your running
containers:
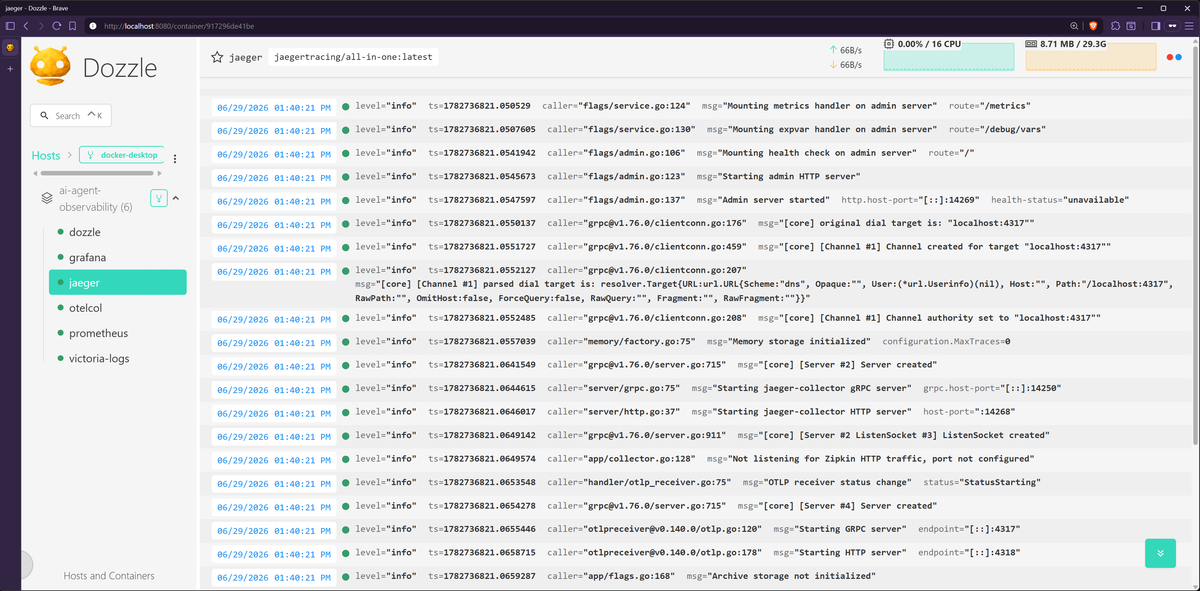
Click on any container on the list to see its logs streaming in real time:
Navigating the Dozzle interface
Rather than walking through every button, here are the workflows that matter most.
The container sidebar on the left lists all running containers, filterable by name. If you're using Docker Compose, containers from the same project automatically group together under their stack name, which keeps things organized when you're running multiple Compose stacks on one host.
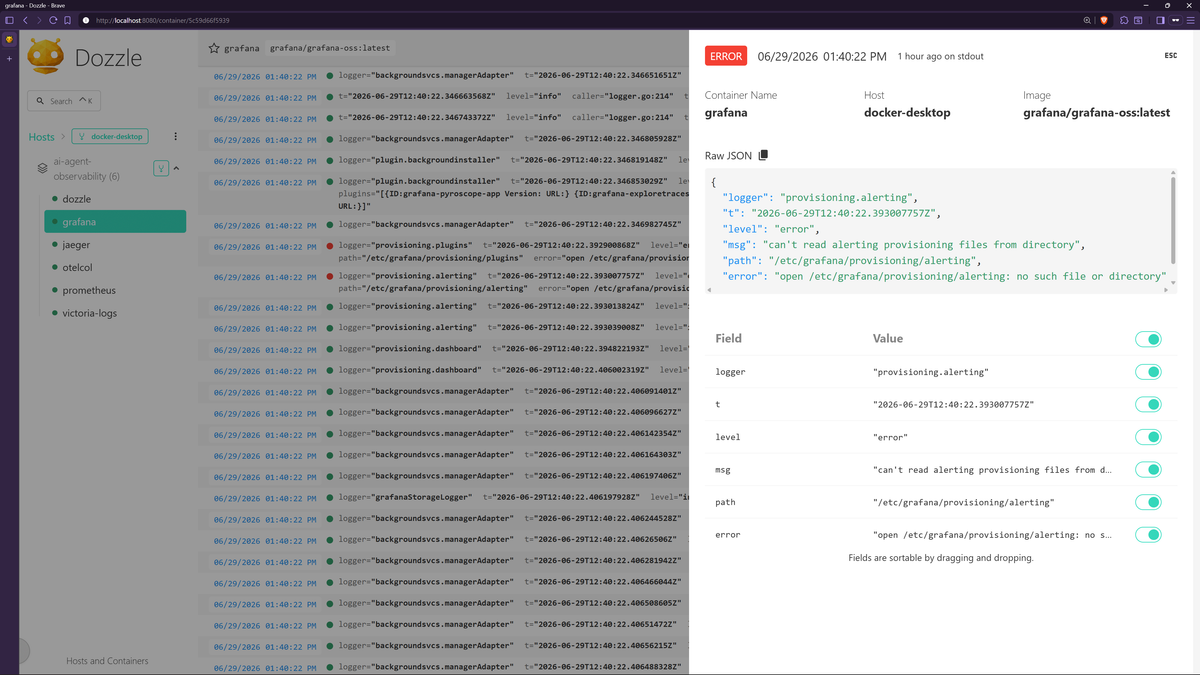
The log stream itself auto-scrolls as new lines come in. Dozzle auto-detects
JSON-formatted logs and pretty-prints them with syntax highlighting. If your
logs include a level field (like most structured logging libraries produce),
Dozzle color-codes entries by severity. This makes it easy to spot errors
without reading every line.
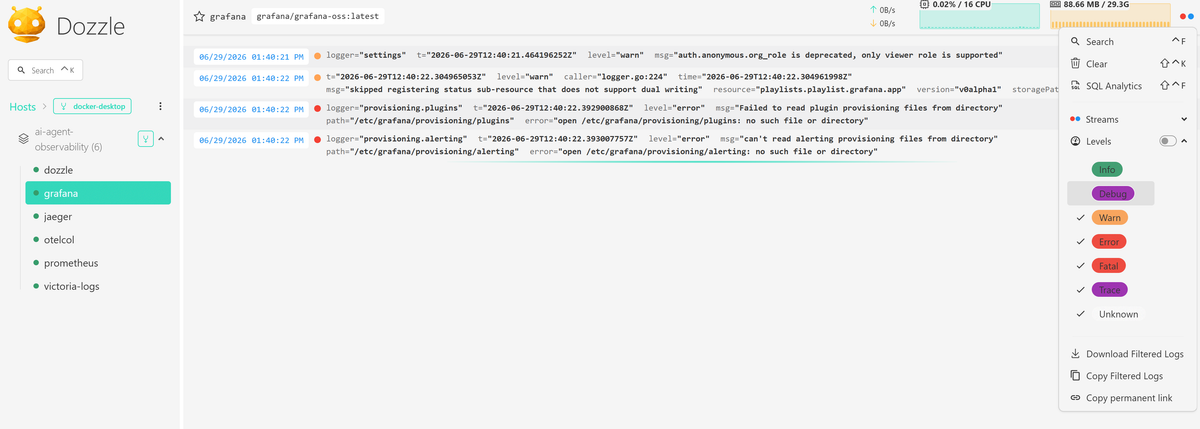
If you're actively debugging an issue and only care about errors and warnings, you can hide the info and debug noise with a click rather than scanning through everything visually.
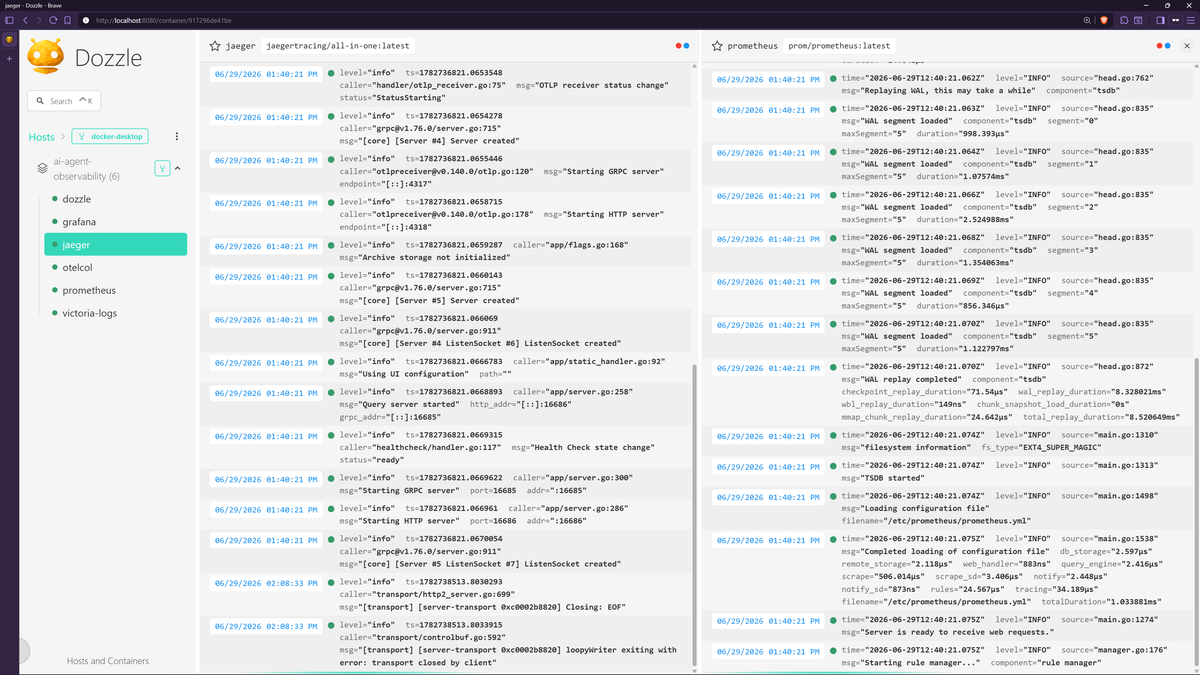
Split view lets you watch two or more containers side-by-side. When you observe a 500 error and you need to see what happened in the API server, the database, and the cache layer at the same moment, you can open all three in split panes and scroll to the same timestamp.
The search bar filters containers by name, which helps when you're running dozens of them and need to find a specific service quickly. There's no built-in search across log content itself, so if you need to query logs by text, the SQL feature covered later in this guide is the way to go.
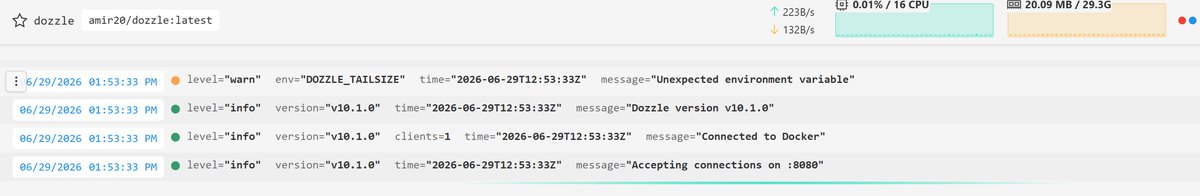
Each container view also shows lightweight CPU, memory, and network charts. These aren't a replacement for proper monitoring, but they're useful for a quick check when you suspect a container is consuming more resources than it should. Our docker stats guide goes deeper on container resource monitoring.
Setting up authentication and access control in Dozzle
If you're only using Dozzle on your local machine for development, you can skip this section for now. But if Dozzle is accessible over a network, even an internal one, read this before doing anything else.
The Docker socket (/var/run/docker.sock) gives any container that mounts it
what amounts to root access on the host. Even with the :ro flag, the Docker
API still exposes container listings, log content, image details, and network
configuration. An exposed, unauthenticated Dozzle instance is a reconnaissance
goldmine for anyone who finds it, so always put Dozzle behind authentication if
it's reachable from the public internet.
The simplest approach is Dozzle's built-in file-based authentication. Generate a
credentials file using Dozzle's generate command:
1234docker run -it --rm amir20/dozzle generate admin \--password <your-secure-password> \--email admin@example.com \--name "Admin" > users.yml
This produces a users.yml file with a bcrypt-hashed password:
12345678# users.ymlusers:admin:email: admin@example.comname: Adminpassword: $2a$11$FIpatJvtzq/z8Rm/kQeGBOFk0DFQlMycobbtfRg0Ad/7CrNXHLqBmfilter: ""roles: ""
Then mount the directory containing that file and enable the simple auth
provider:
123456789101112services:dozzle:image: amir20/dozzle:latestcontainer_name: dozzlerestart: unless-stoppedvolumes:- /var/run/docker.sock:/var/run/docker.sock:ro- ./data:/dataports:- "8080:8080"environment:DOZZLE_AUTH_PROVIDER: simple
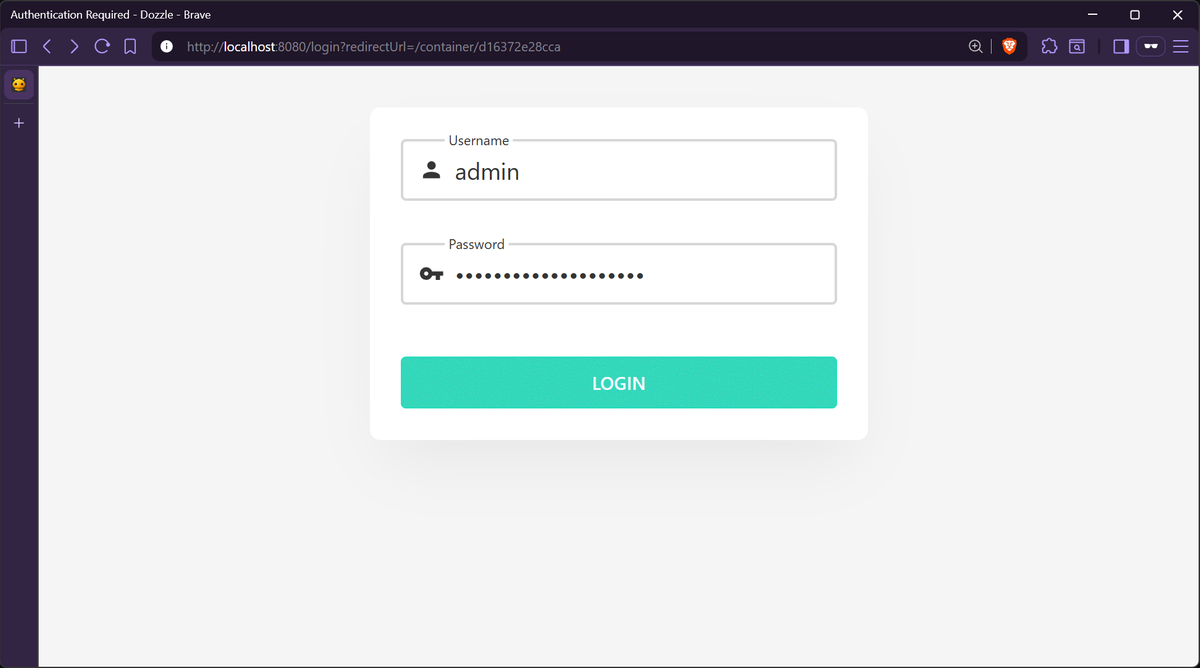
Place your users.yml inside the ./data directory. Dozzle also writes user
settings and notification state to /data, so mounting the directory (rather
than just the file) lets those persist across restarts. After bringing the stack
up, you'll see a login screen.
One thing to watch out for is that many older tutorials still reference
DOZZLE_USERNAME and DOZZLE_PASSWORD environment variables for single-user
auth. That approach was deprecated in v5 and removed in v6. If you try to use
those variables with a current version of Dozzle, it won't start.
The users.yml file also supports per-user filter and roles fields. Filters
restrict which containers a user can see (using Docker label syntax like
label=com.example.app), and roles control whether a user can access shell or
container actions. See
Dozzle's authentication docs for the
full reference.
For production deployments, Dozzle also supports forward proxy authentication
with tools like Authelia, Authentik, or Cloudflare Access. This is the better
option when you need centralized auth with multi-factor authentication. Dozzle
reads user identity from headers like X-Forwarded-User and X-Forwarded-Email
set by the proxy.
If you're putting Dozzle behind a reverse proxy (and you should for any non-local deployment), make sure WebSocket connections are handled properly. Dozzle uses WebSockets for its live log stream, and without the right proxy headers the stream fails silently. Here's a minimal Nginx config:
12345678910111213141516server {listen 443 ssl;server_name logs.example.com;ssl_certificate /path/to/cert.pem;ssl_certificate_key /path/to/key.pem;location / {proxy_pass http://127.0.0.1:8080;proxy_http_version 1.1;proxy_set_header Upgrade $http_upgrade;proxy_set_header Connection "upgrade";proxy_set_header Host $host;proxy_read_timeout 86400s;}}
The Upgrade and Connection headers enable WebSocket passthrough. The
proxy_read_timeout prevents Nginx from closing long-lived connections. See
Dozzle's reverse proxy guide for
Traefik and Caddy examples.
One last thing: Dozzle can start, stop, and restart containers from the UI (via
DOZZLE_ENABLE_ACTIONS) and open a shell into running containers (via
DOZZLE_ENABLE_SHELL). Both are off by default. If you enable either,
authentication is non-negotiable as these give the UI the same power as
docker stop or docker exec on the command line.
Monitoring multiple Docker hosts with Dozzle agents
If you run containers across more than one machine, Dozzle's agent mode lets you view logs from all of them in one place. You deploy a lightweight agent on each remote host, then point your central Dozzle instance at those agents. Communication happens over gRPC on port 7007, secured with TLS by default.
On each remote machine, deploy Dozzle with the agent subcommand:
12345678910# docker-compose.yml on the remote hostservices:dozzle-agent:image: amir20/dozzle:latestcommand: agentrestart: unless-stoppedvolumes:- /var/run/docker.sock:/var/run/docker.sock:roports:- "7007:7007"
On your central host, point Dozzle at the agents using DOZZLE_REMOTE_AGENT.
The connection string format is endpoint|name|group, where name and group are
optional:
123456789101112131415# docker-compose.yml on the central hostservices:dozzle:image: amir20/dozzle:latestrestart: unless-stoppedvolumes:- /var/run/docker.sock:/var/run/docker.sock:ro- ./data:/dataports:- "8080:8080"environment:DOZZLE_REMOTE_AGENT: >-10.0.1.10:7007|web-1|Production, 10.0.1.11:7007|web-2|ProductionDOZZLE_AUTH_PROVIDER: simpleDOZZLE_NO_ANALYTICS: "true"
The groups show up as collapsible sections in the sidebar, which is useful once
you're managing more than a few hosts. If you only want to see containers from
remote agents and not from the central host itself, you can skip the
docker.sock mount on the central Compose file.
You don't need to expose port 7007 publicly. If the agent and hub are on the same Docker network, the agent is reachable by container name without any port mapping. For hosts on separate networks, restrict port 7007 with firewall rules so only the central Dozzle host can reach it. See the Dozzle agent documentation for the full reference.
Querying logs with Dozzle's SQL engine
Dozzle includes a SQL engine powered by DuckDB compiled to WebAssembly
(introduced in v8.5, still labeled beta). It runs entirely in your browser, so
your data never leaves your machine and there's no server-side processing.
Dozzle reads the loaded JSON logs, creates a virtual logs table in DuckDB, and
you query against that.
The key requirement: this only works with JSON-structured logs. If your
containers output plain text, the SQL engine won't have structured fields to
query. Open it from the dropdown menu ("SQL Analytics") or with Ctrl+Shift+F
(Cmd+Shift+F on macOS).
Because Dozzle unnests JSON fields into columns, you can query structured fields directly rather than doing text matching. A few practical examples:
Filter by log level and status code:
12345SELECT time, level, messageFROM logsWHERE level = 'error'ORDER BY time DESCLIMIT 50;
Count logs grouped by level:
123SELECT level, COUNT(*) AS countFROM logsGROUP BY level;
Aggregate errors by minute to spot spikes:
1234567SELECTdate_trunc('minute', timestamp) AS minute,COUNT(*) AS error_countFROM logsWHERE level = 'error'GROUP BY minuteORDER BY minute DESC;
Query nested JSON fields (if your logs contain objects):
12345SELECT message.path, message.status,message.durationFROM logsWHERE message.status >= 400ORDER BY message.duration DESC;
You're querying what's loaded in the browser, not Docker's full log history, so this is best suited for ad-hoc debugging rather than historical analysis.
Setting up Dozzle alerts with webhooks
Dozzle v10 introduced webhook-based alerts, and subsequent releases added metric and container event triggers on top of the original log pattern matching.
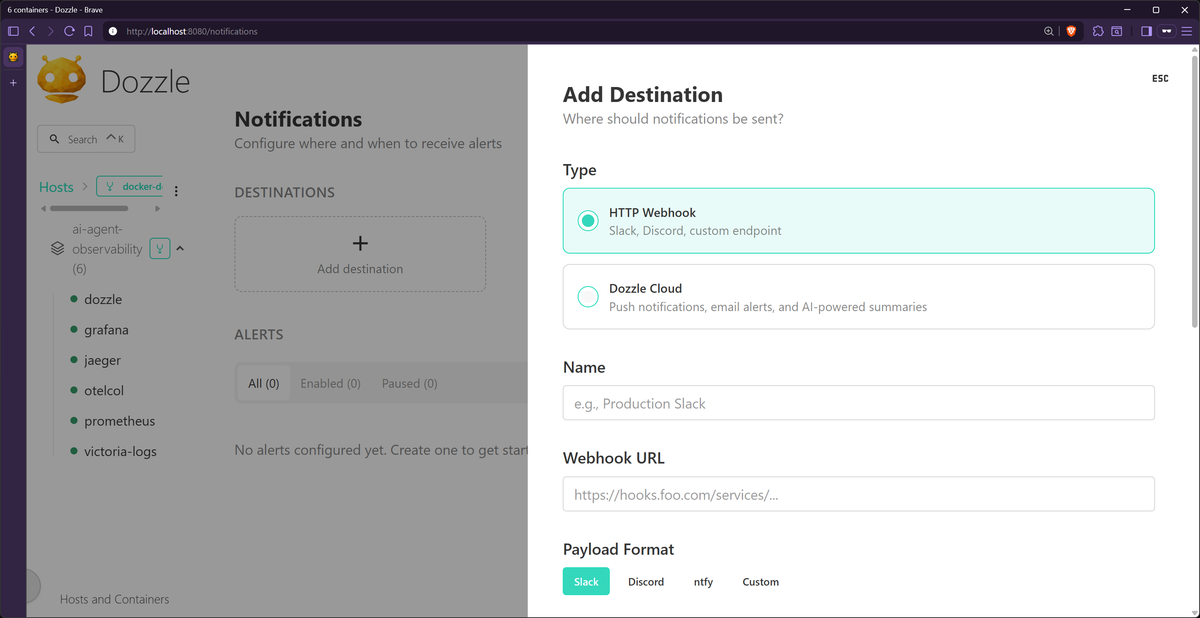
The setup starts on the Notifications page. You first add a destination, which
is a webhook URL that receives an HTTP POST when an alert fires. Dozzle ships
with built-in payload templates for Slack, Discord, and ntfy, and you can write
custom templates using Go's text/template syntax for anything else.
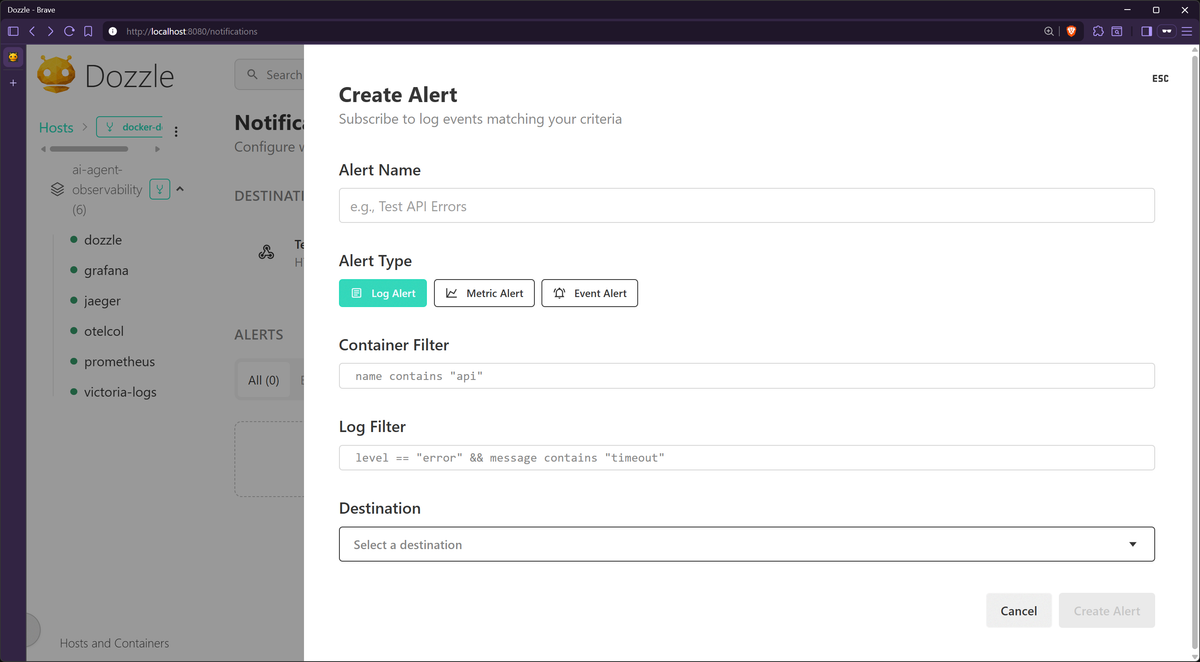
Each alert combines a container expression (filtering by name, label, or image)
with a trigger. Log triggers fire when a line matches your pattern, while metric
triggers fire when CPU or memory exceeds a threshold over a smoothed rolling
average, with configurable sample windows and cooldown periods to avoid false
alarms from short spikes. Event triggers fire on Docker lifecycle events like
die, oom, or health_status. Common exit codes like 0, 130 (SIGINT), 143
(SIGTERM), and 137 (SIGKILL) are excluded by default so you don't get alerts
every time a container stops normally.
Dozzle alerts work well for catching crashes and threshold breaches in staging or homelab environments. They don't have escalation policies or SLO-based thresholds, so production alerting still needs a dedicated platform.
When Dozzle stops being enough
Dozzle is great when you need to look at container logs in the moment. It gives you a fast, simple way to see what a container is saying right now, without setting up a larger logging or monitoring stack.
The moment you need to understand what happened before you opened the Dozzle UI, or how one log line relates to the rest of your system, live log viewing usually isn't enough. You need observability. The difference becomes clear as soon as production asks harder questions:
- Which deploy introduced this spike in 500 responses?
- Did the error rate stay above 5% last night, or was it a brief burst?
- Which service handled this request before it timed out?
- What were the CPU, memory, and database metrics when the error happened?
- Can you search and audit the relevant logs months from now?
Dozzle isn't designed to answer those, and that's not a flaw. It's a focused real-time log viewer. For production operations, you need a system that keeps context over time and connects the telemetry signals.
That's where OpenTelemetry fits in. It gives you a vendor-neutral way to collect logs, metrics, and traces from your applications and infrastructure. Instead of treating container logs as isolated lines of text, you send them through the same telemetry pipeline as the rest of your system.
Dash0 is an observability platform built around OpenTelemetry from the ground up. It stores telemetry as OTLP data directly, without proprietary agents or vendor-specific translation. Dash0 supports PromQL and SQL for querying, and Perses-based dashboards for visualization, so your telemetry pipeline stays aligned with the broader cloud native ecosystem rather than locked into a single vendor's conventions.
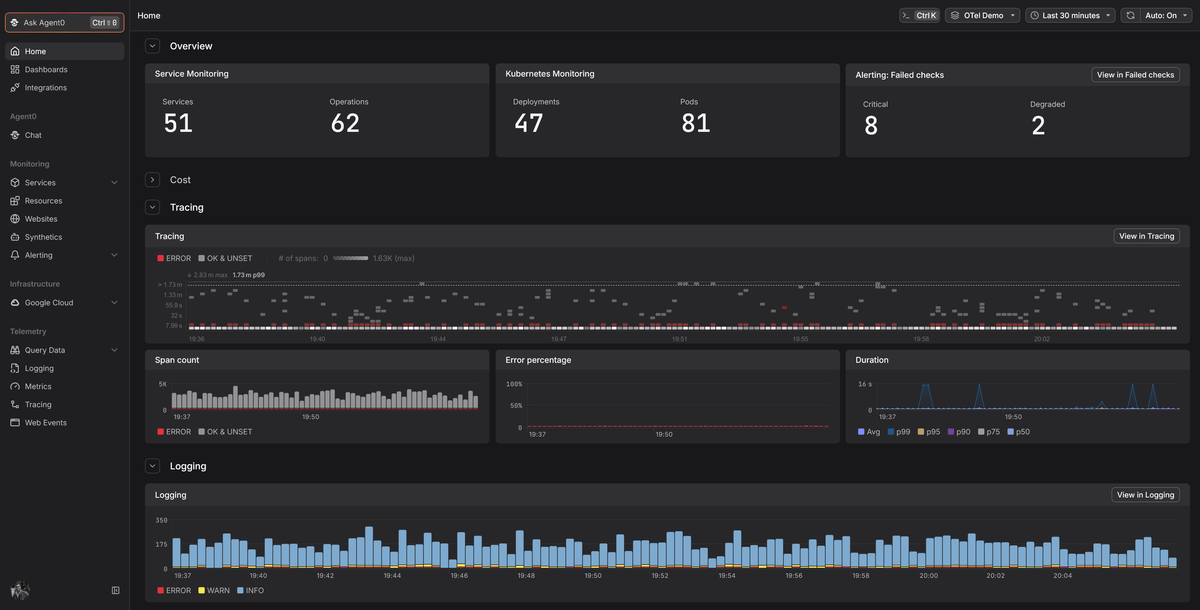
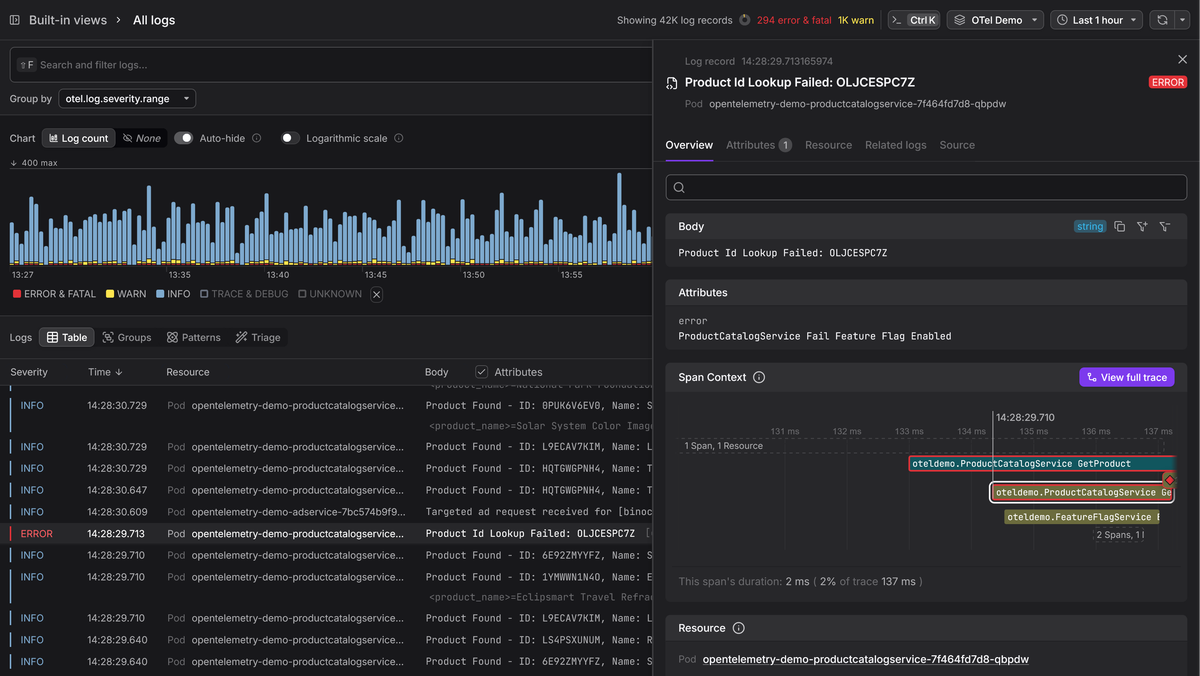
Once the data is in Dash0, you can start from a log entry, move to the trace behind the request, and inspect the surrounding infrastructure metrics without switching tools. Instead of asking someone to reproduce an issue while you watch Dozzle, you investigate what already happened.
For Kubernetes environments, the Dash0 Kubernetes Operator handles instrumentation and collection with minimal manual work. For standalone Docker hosts, the Docker logs with OpenTelemetry guide shows how to move container stdout into an OpenTelemetry pipeline and send it to Dash0.
