

Measure the productivity of Agentic Coding
Your team writes more code with AI agents every week, and the process behind it is invisible. AI SDLC Insights connects token spend to what it actually produced: cost, adoption, and productivity in one view.
Start for free or Book a demo
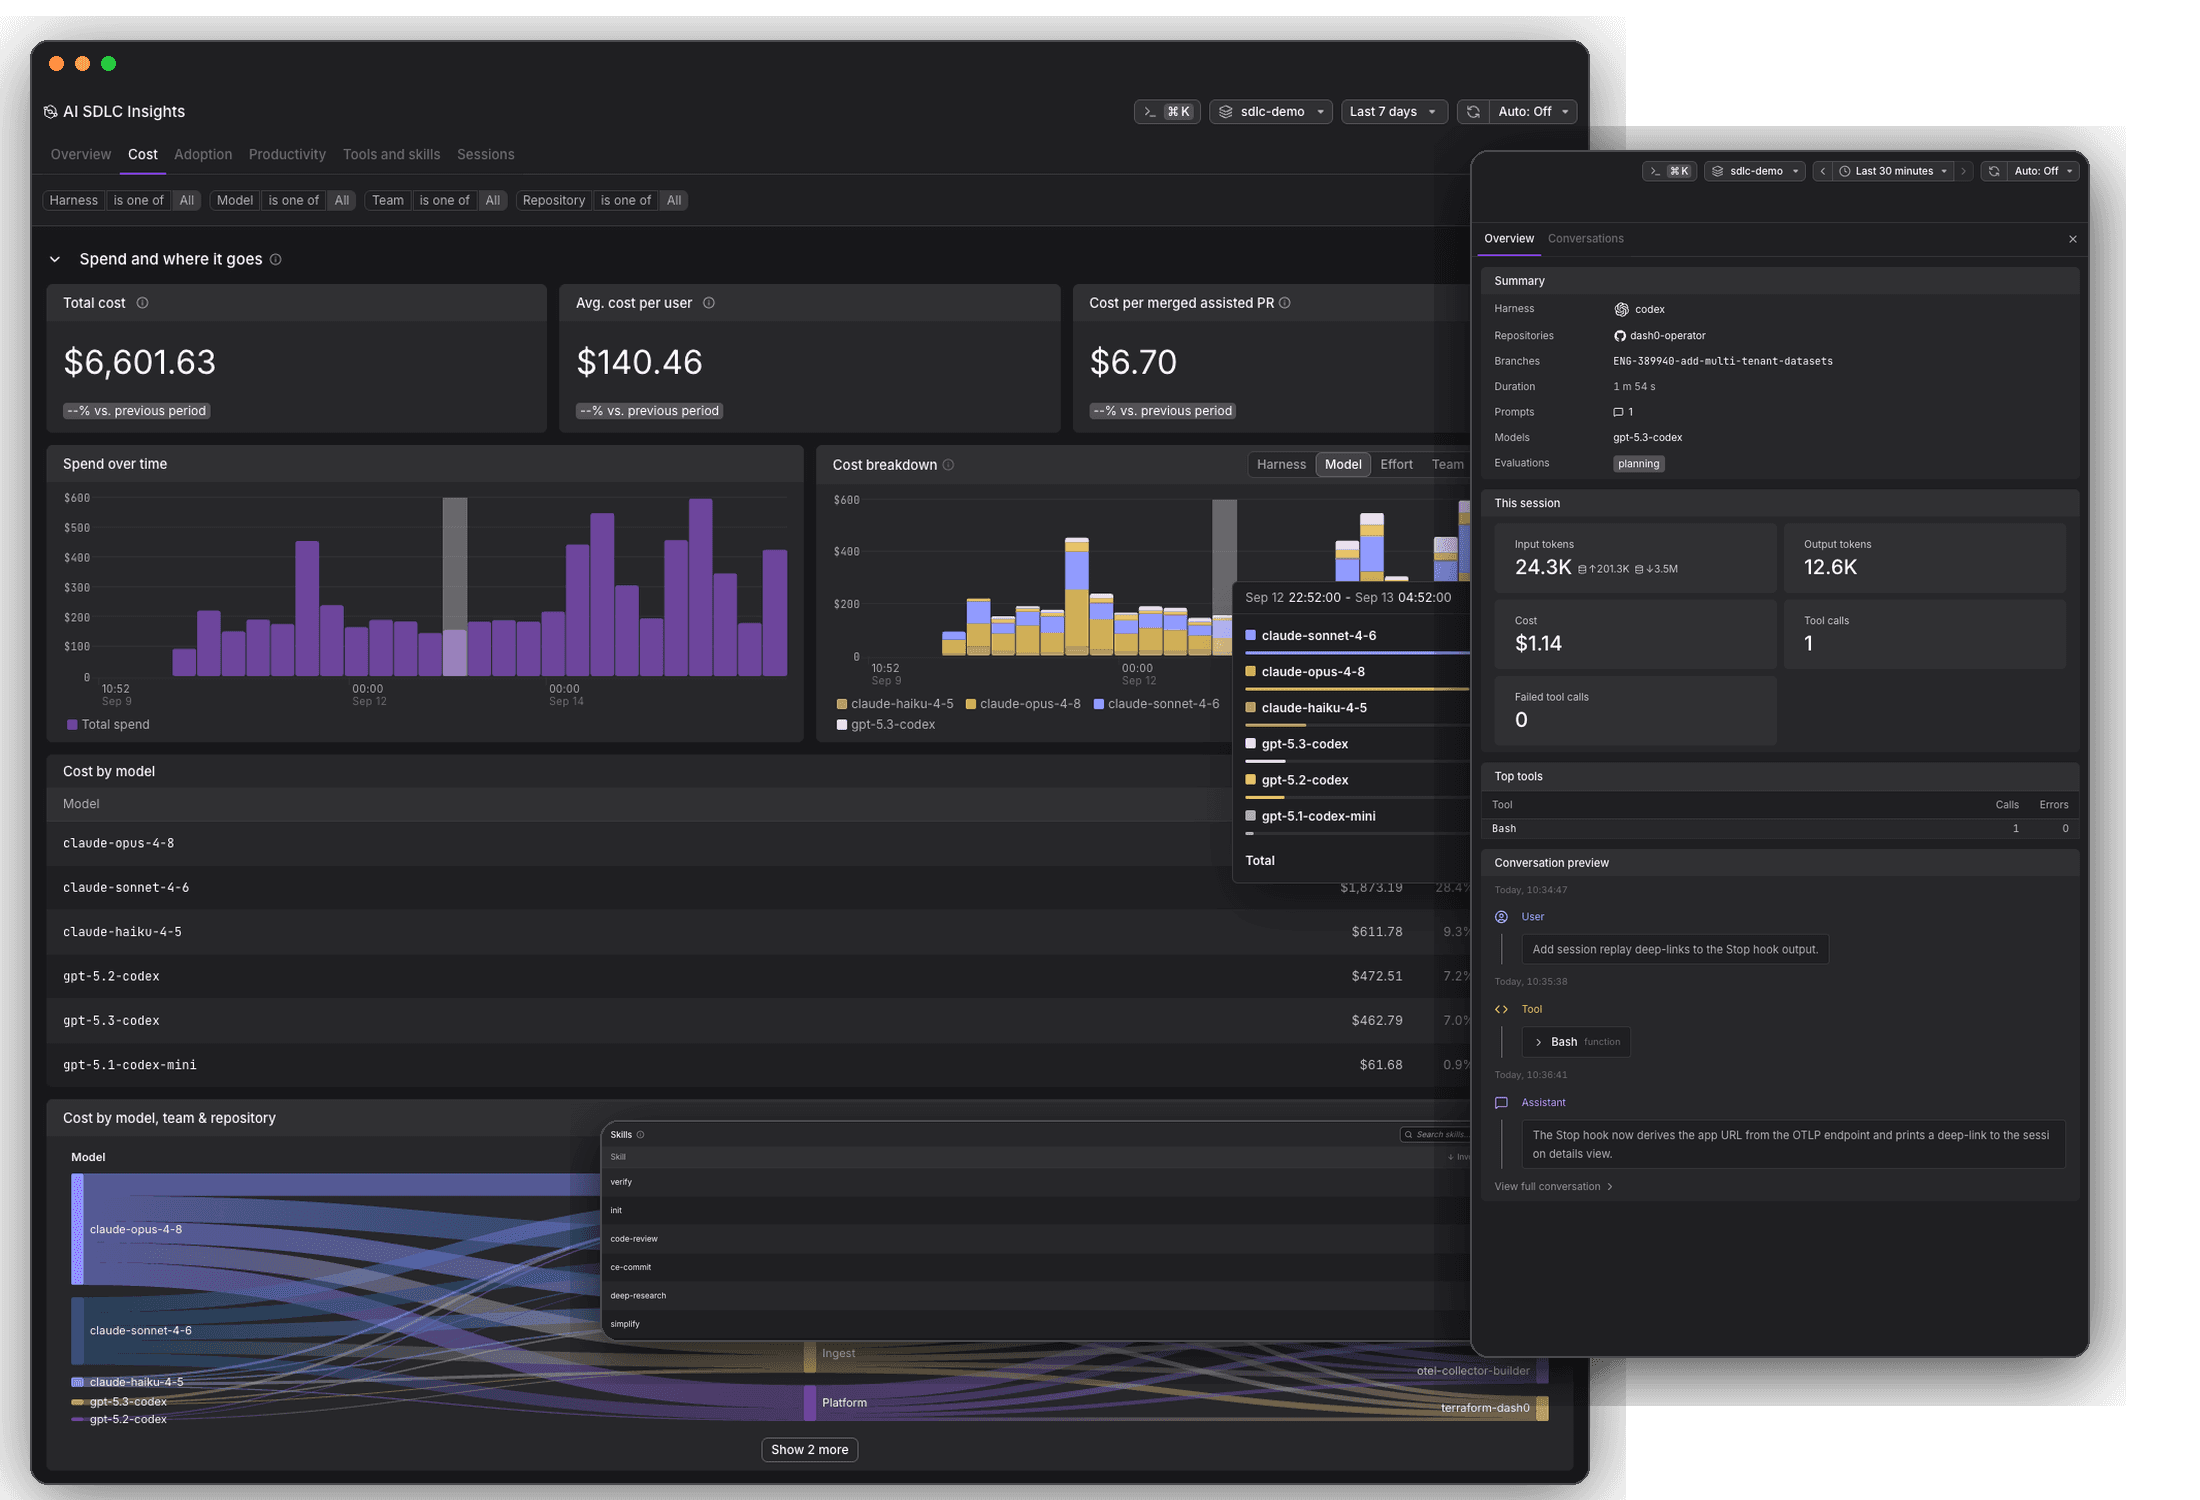
Connect token spend to what is actually produced
AI agents are writing a growing share of your code. Output is up. But the process is invisible: no way to benchmark harnesses against each other, compare models on anything beyond raw token cost, or show business value and ROI of token spend to leadership.
The billing tab gives you a total and nothing else. When a model needs more prompts to reach a good result but costs far less per token, it might be the better economic choice. You can only know that with productivity data sitting next to cost: pull request throughput, time to merge, where merged pull requests jam between coding and merge, and which teams are actually getting value.
Six views. One question: is this worth it?
One filter bar across every view: harness, model, team, repository. Narrow to a team and every number on the page, including the ones counting pull requests, narrows with it.
The numbers, and where work piles up
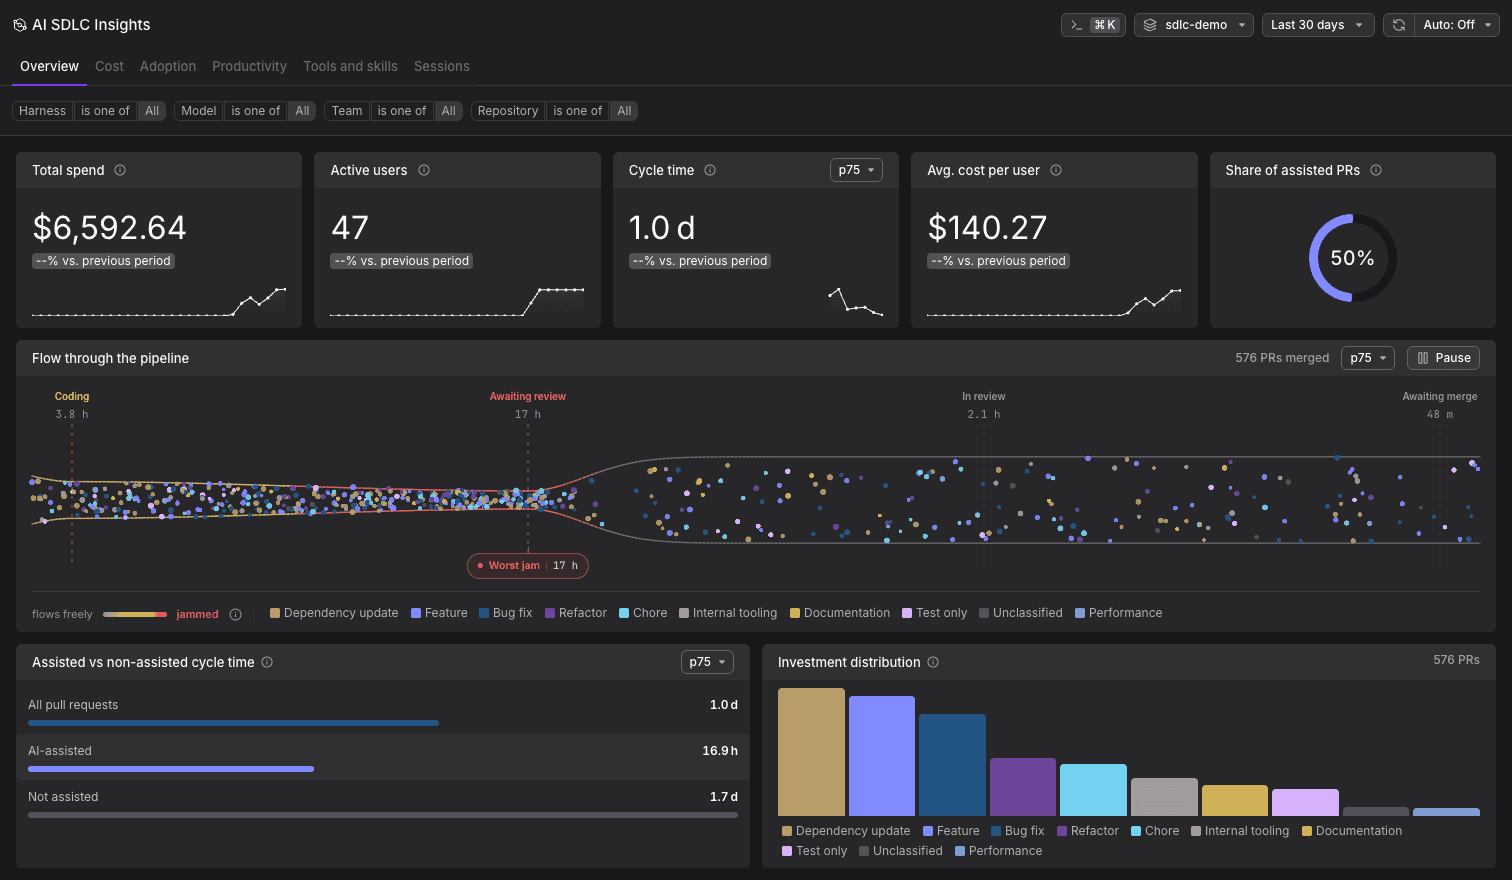
Total spend, active users, cycle time, and the share of assisted pull requests, with assisted and unassisted cycle time side by side.
Stop guessing where the tokens went
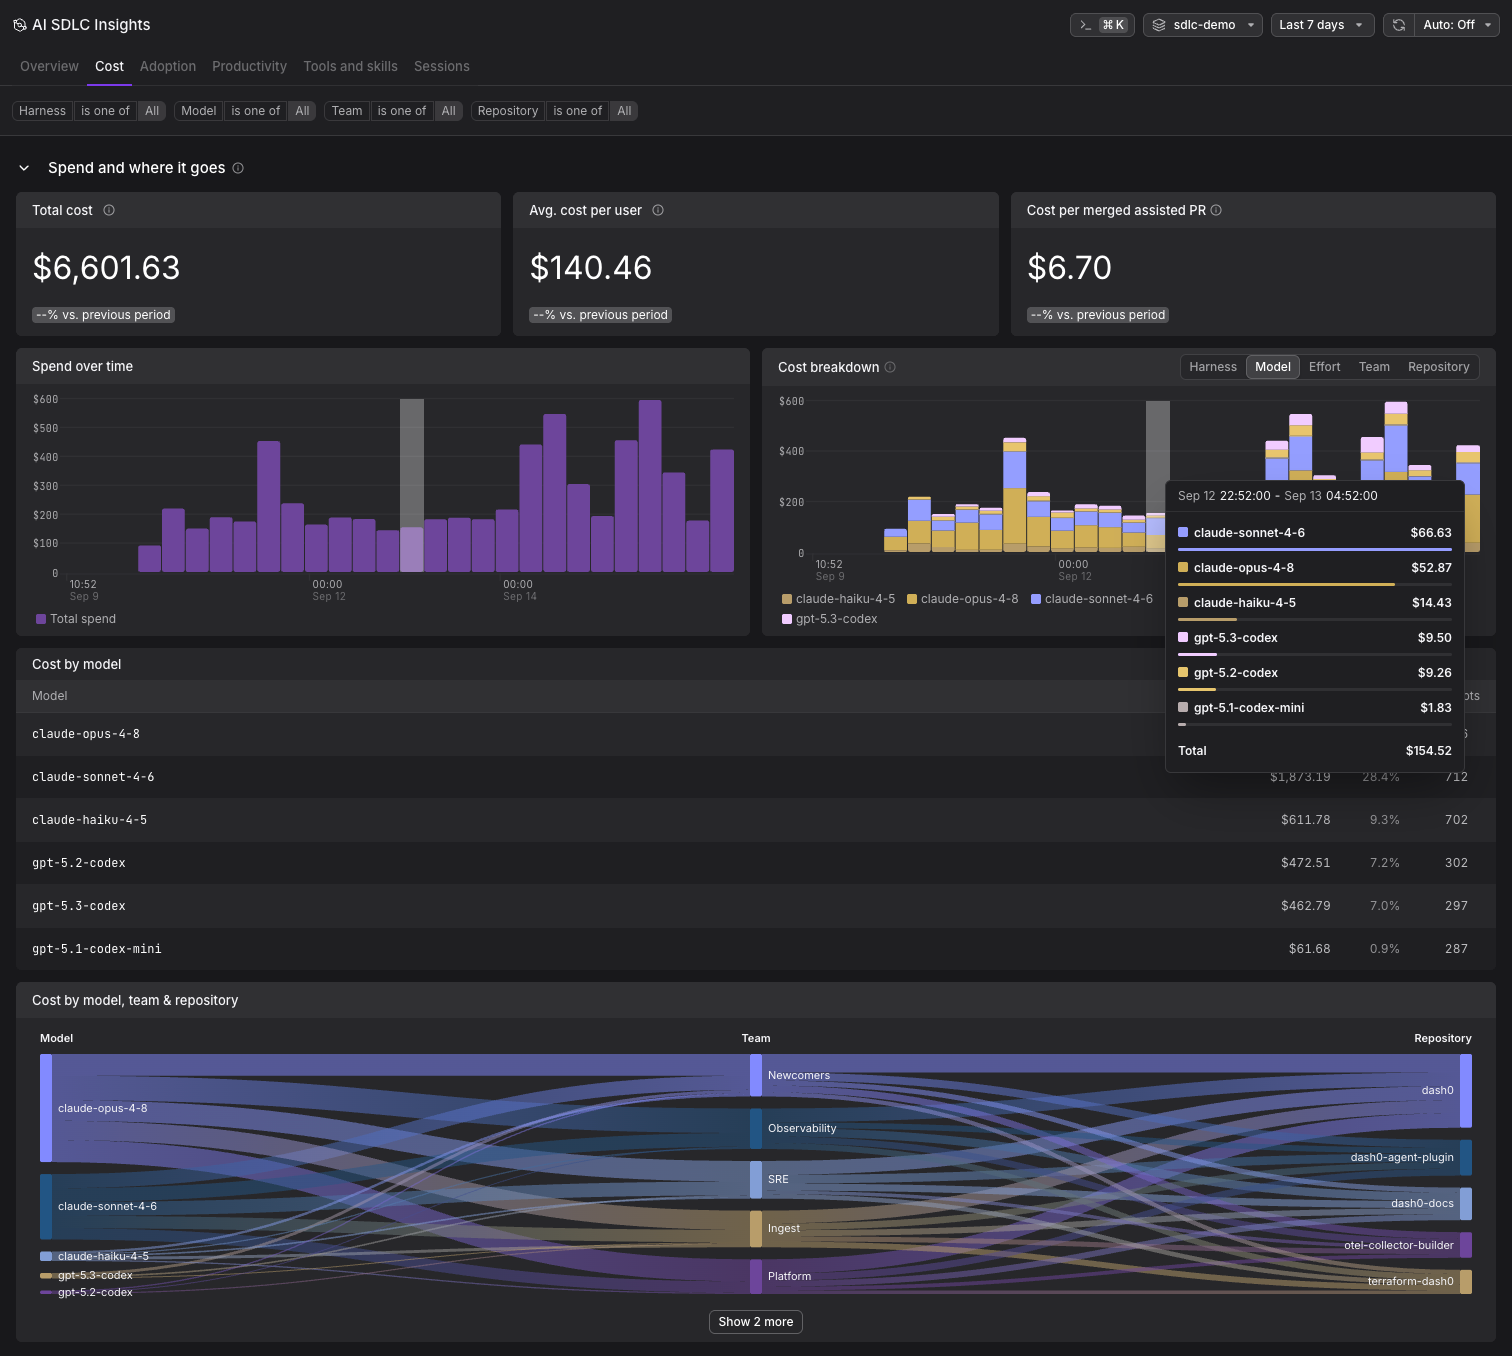
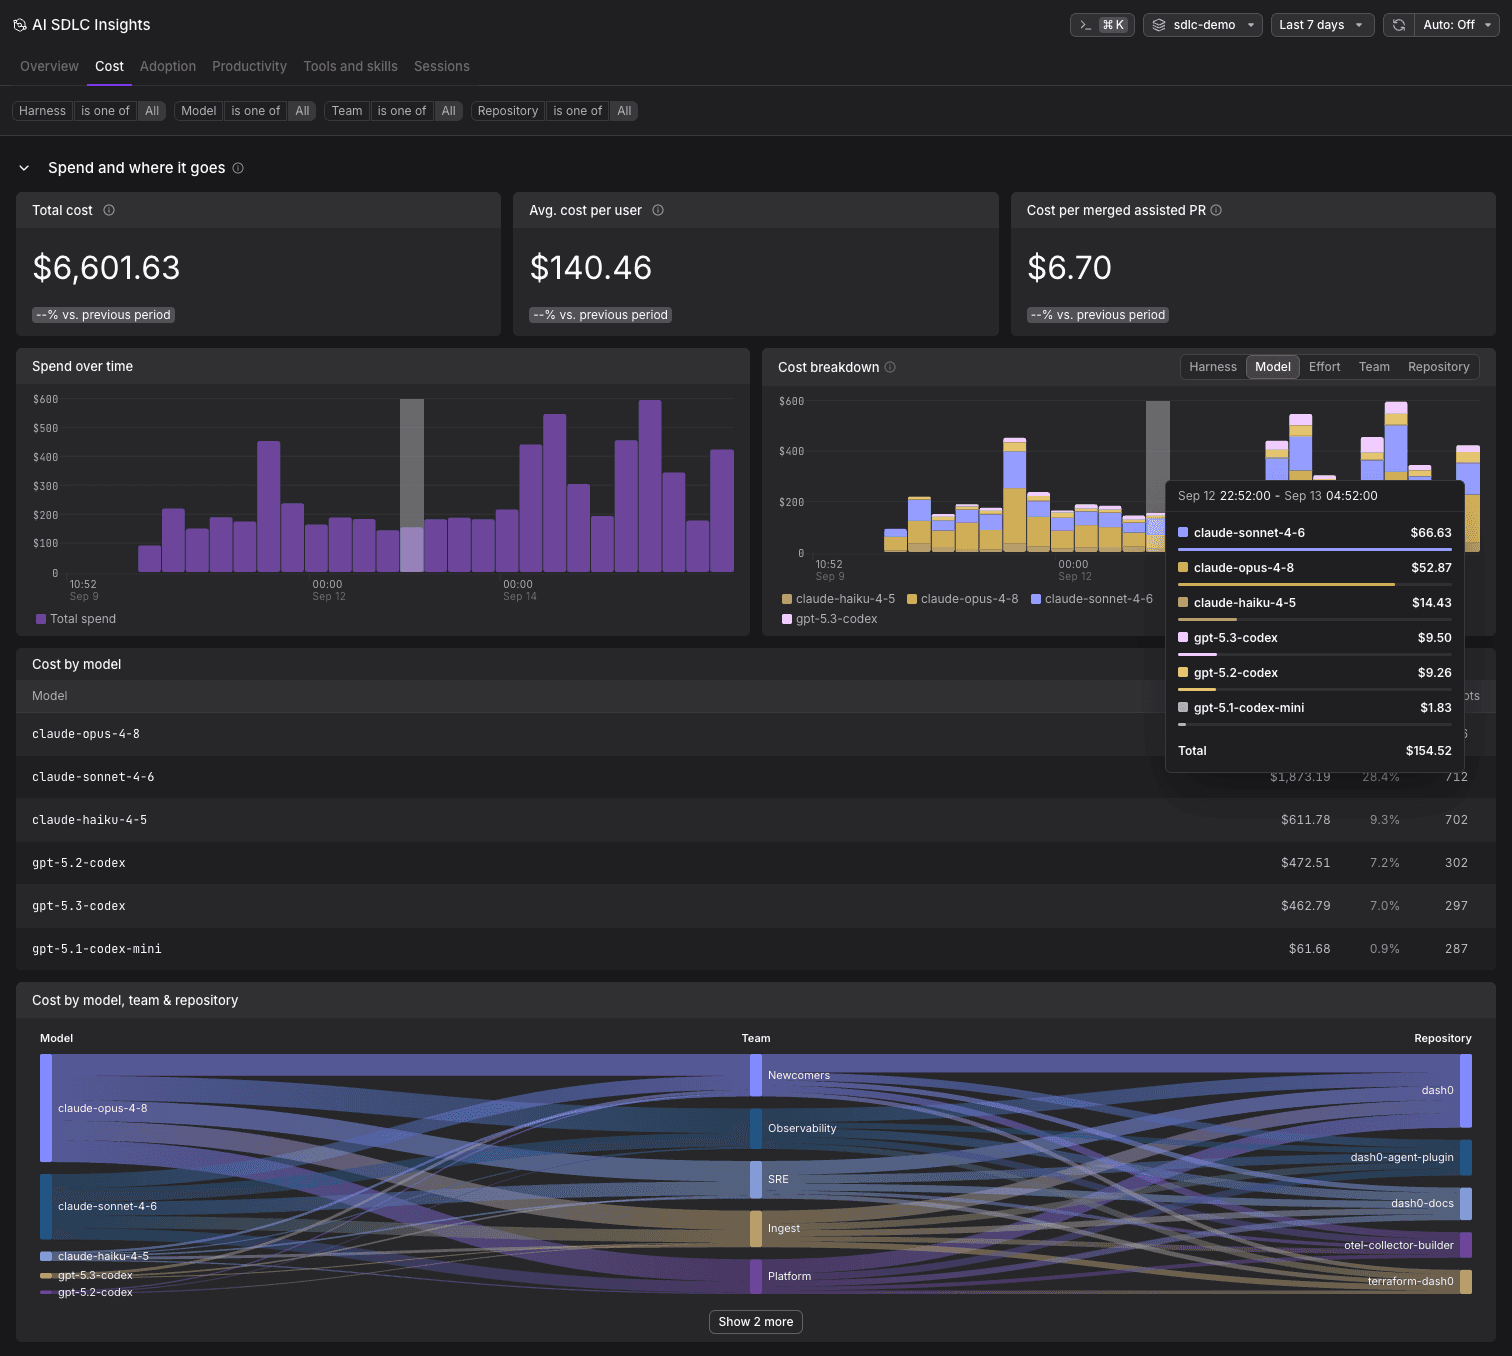
Spend by harness, model, effort, team, and repository, and what one merged agent-assisted pull request cost in tokens.
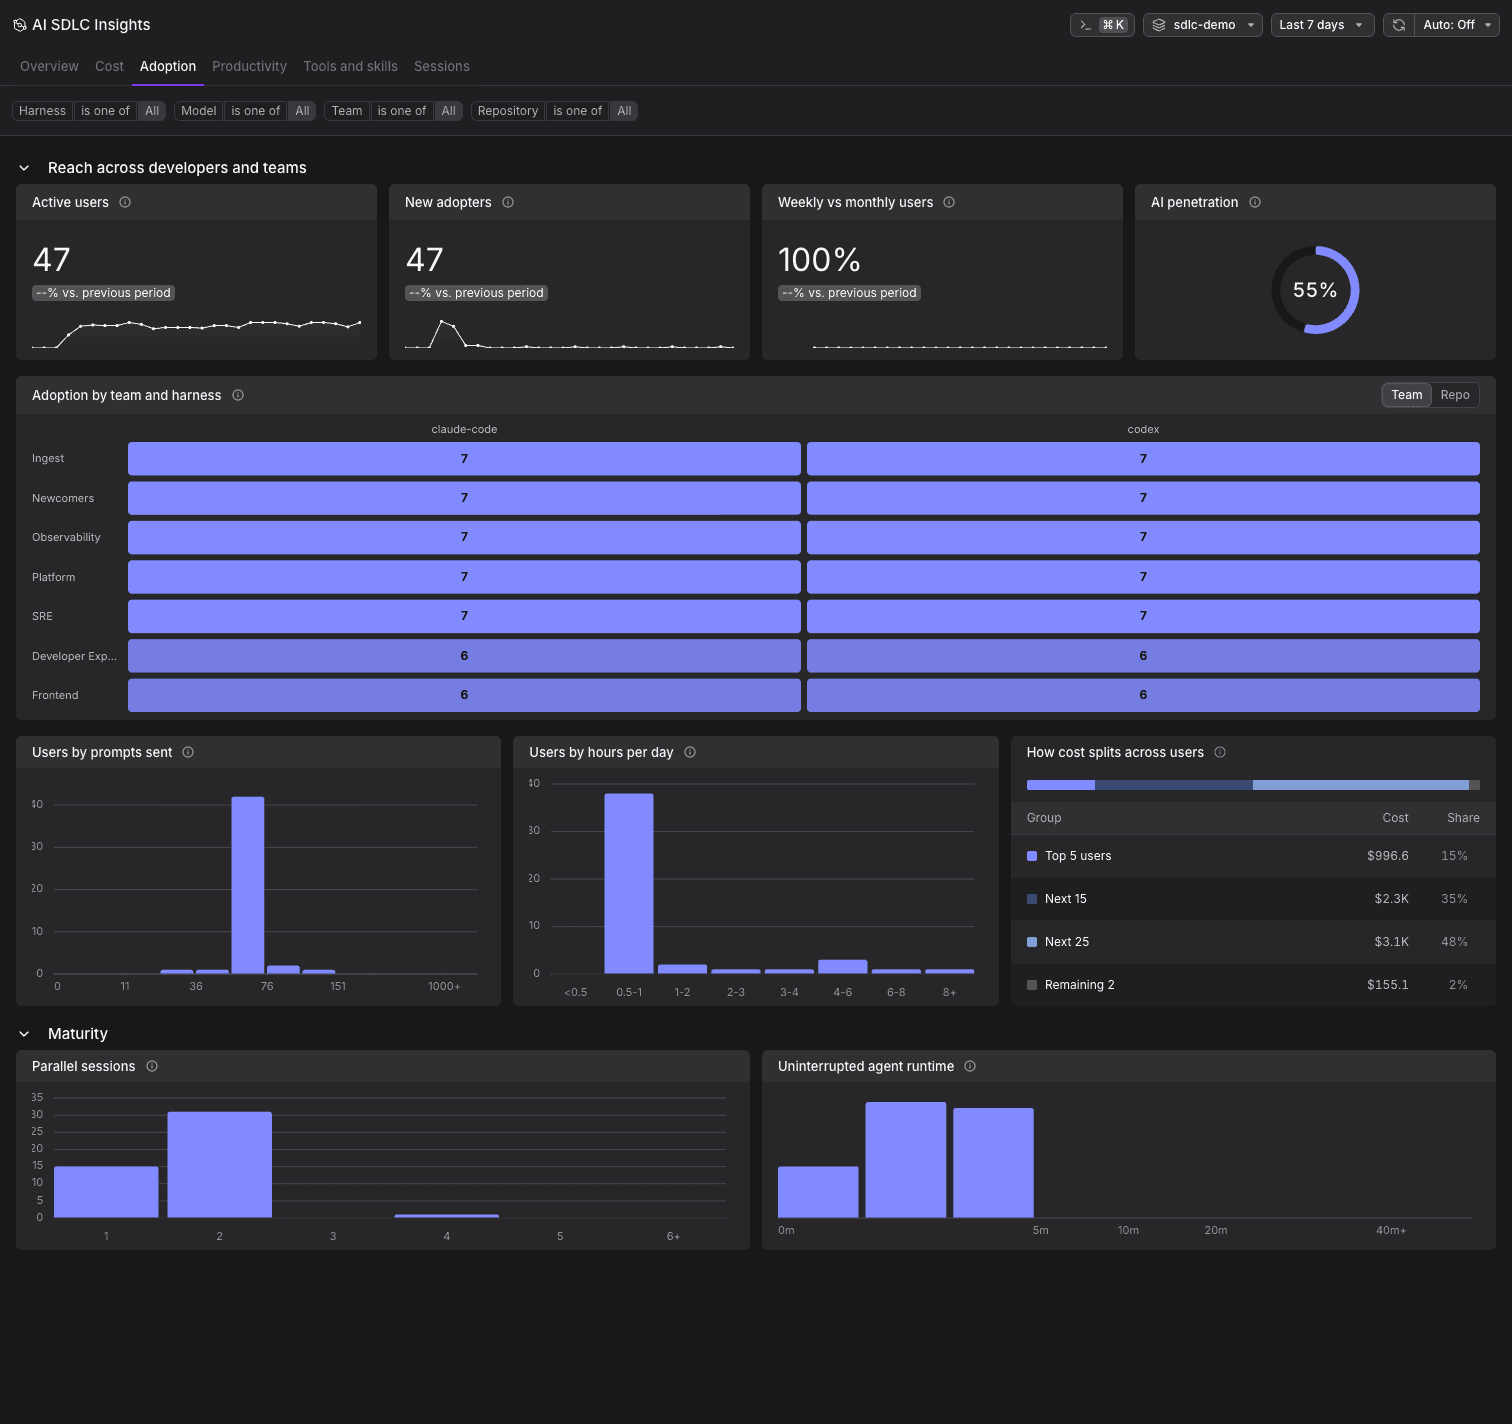
See where AI coding is taking hold
Active users, new adopters, and weekly versus monthly use. AI penetration shows the share of merged pull requests an agent touched.
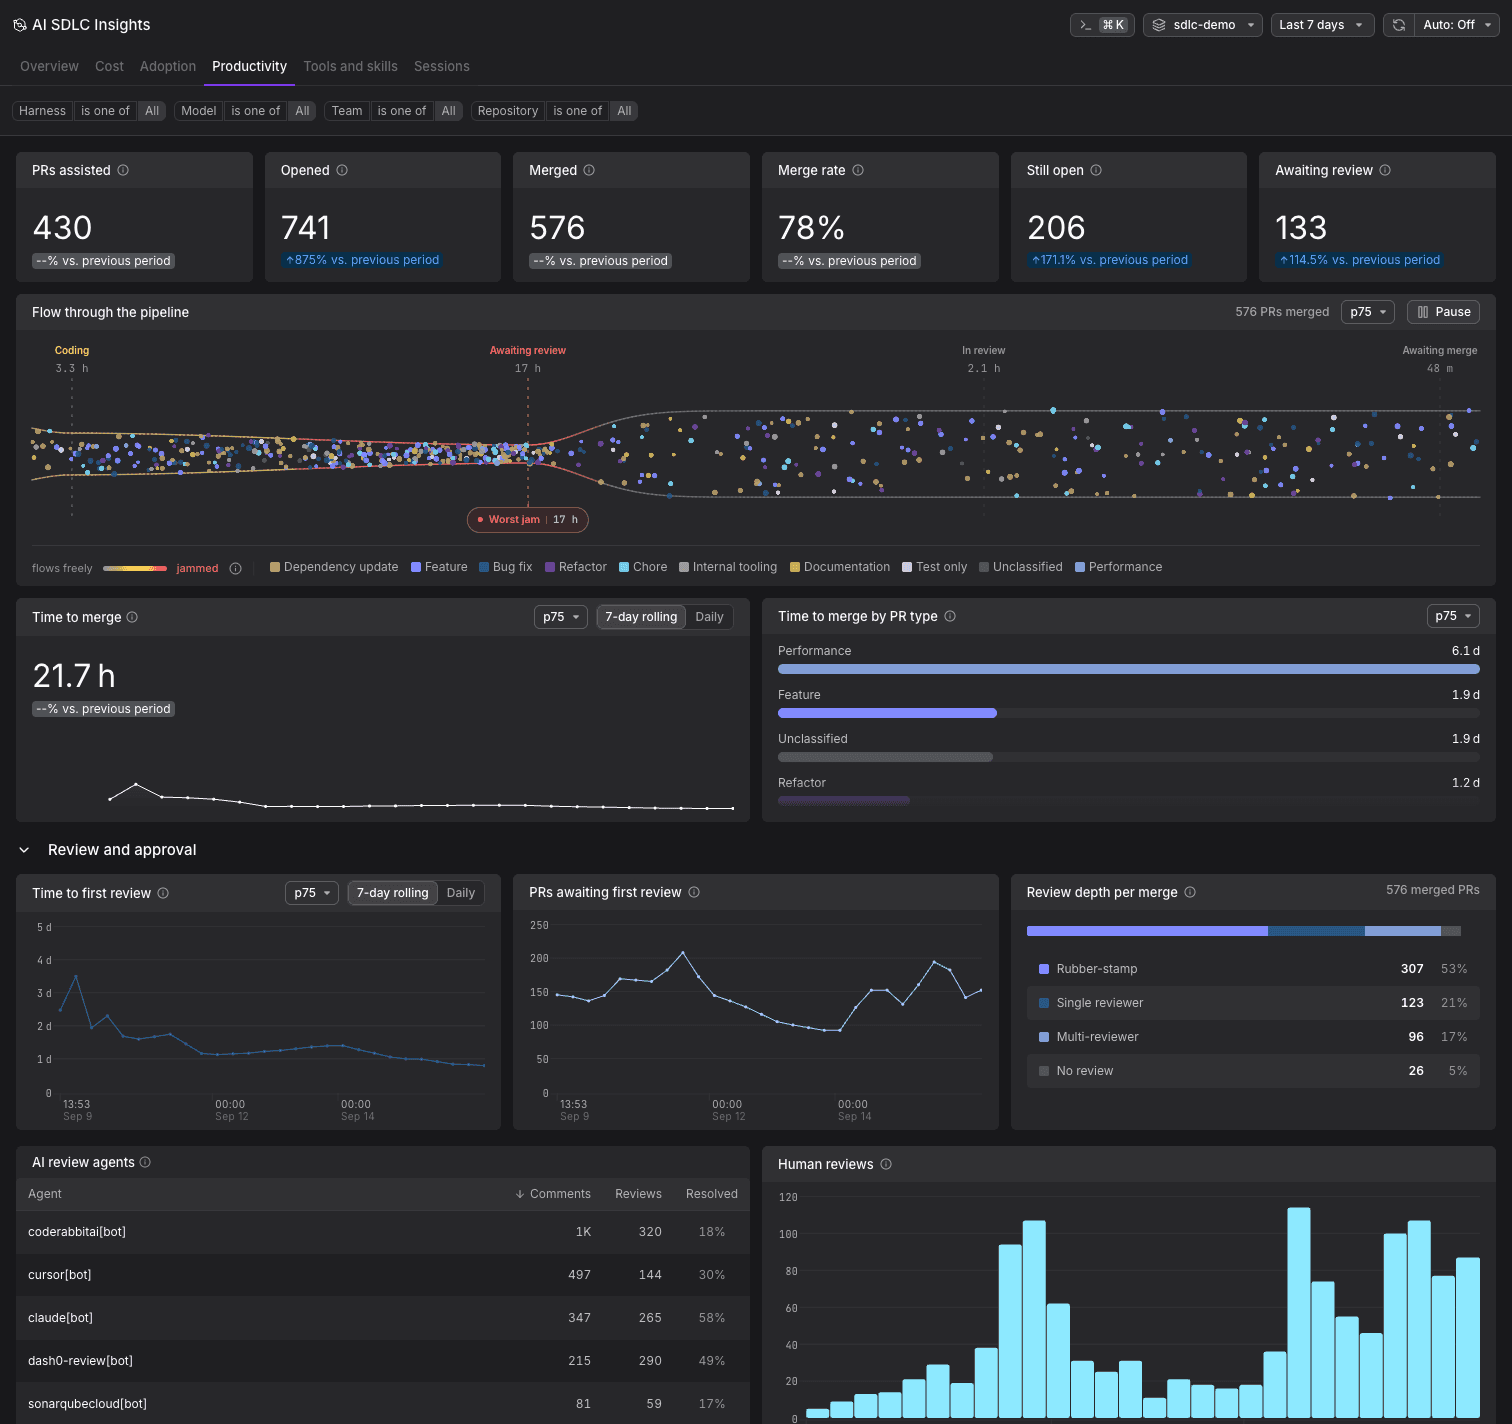
See what the agents actually ship
Throughput and time to merge at the percentile you pick, split by PR type. Review depth tracks what review looks like as throughput climbs.
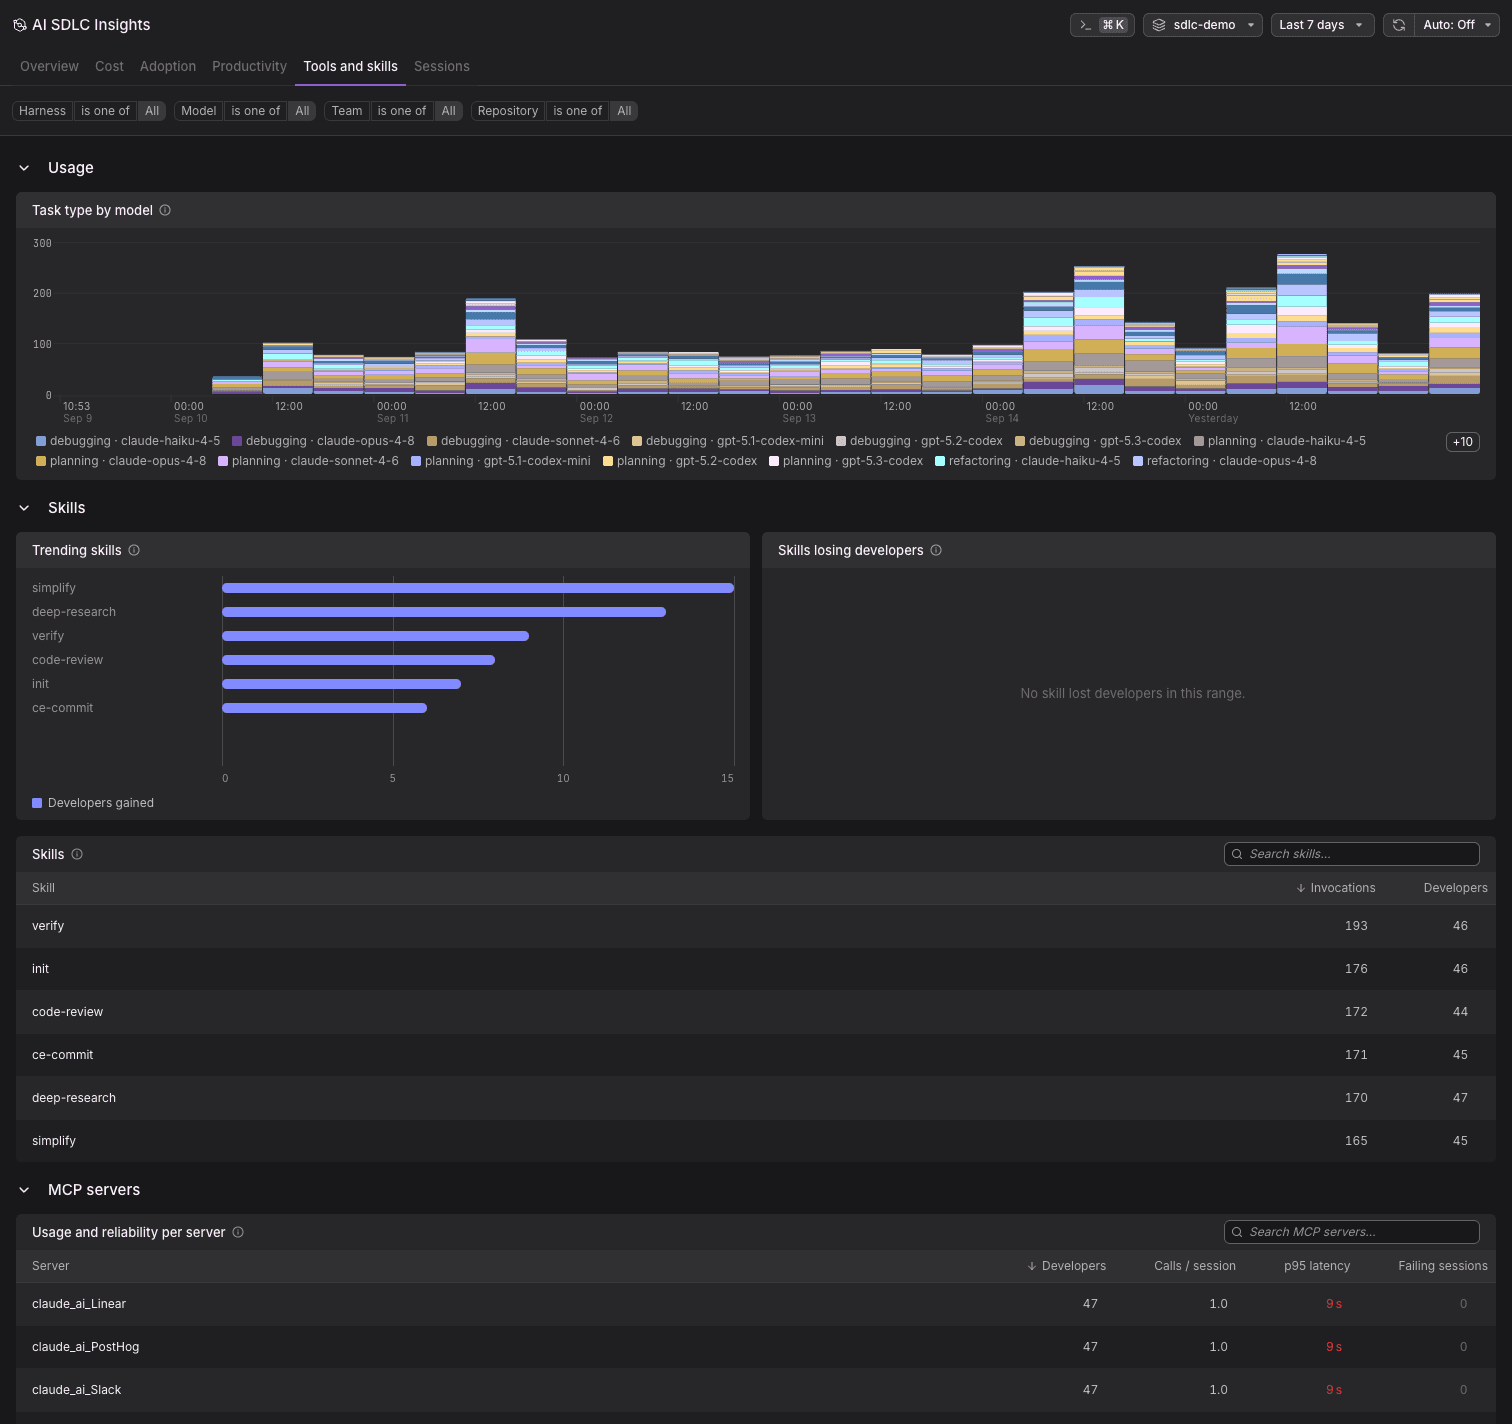
What the agents reach for, and what breaks
Which skills are spreading and which are fading. Per MCP server: developers, calls per session, p95 latency, and failing sessions.
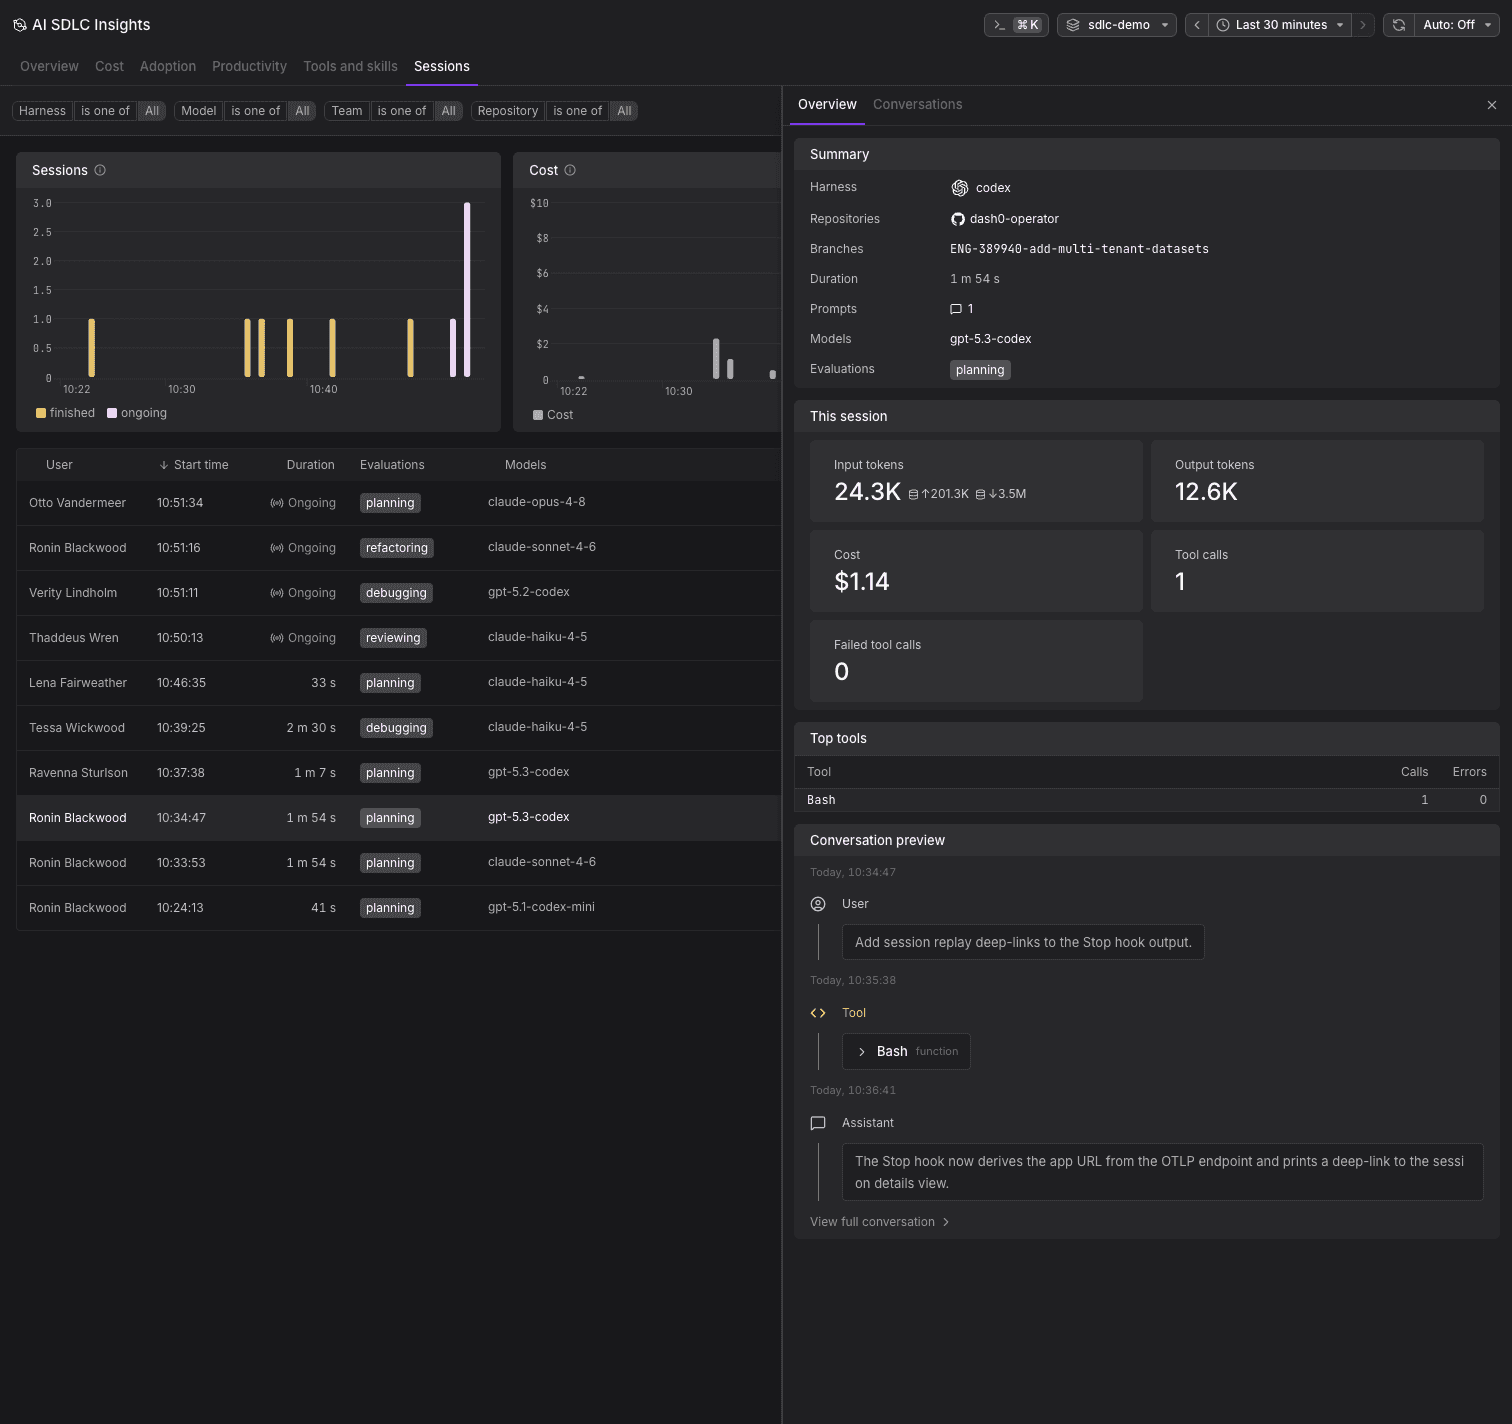
Every run, down to the conversation
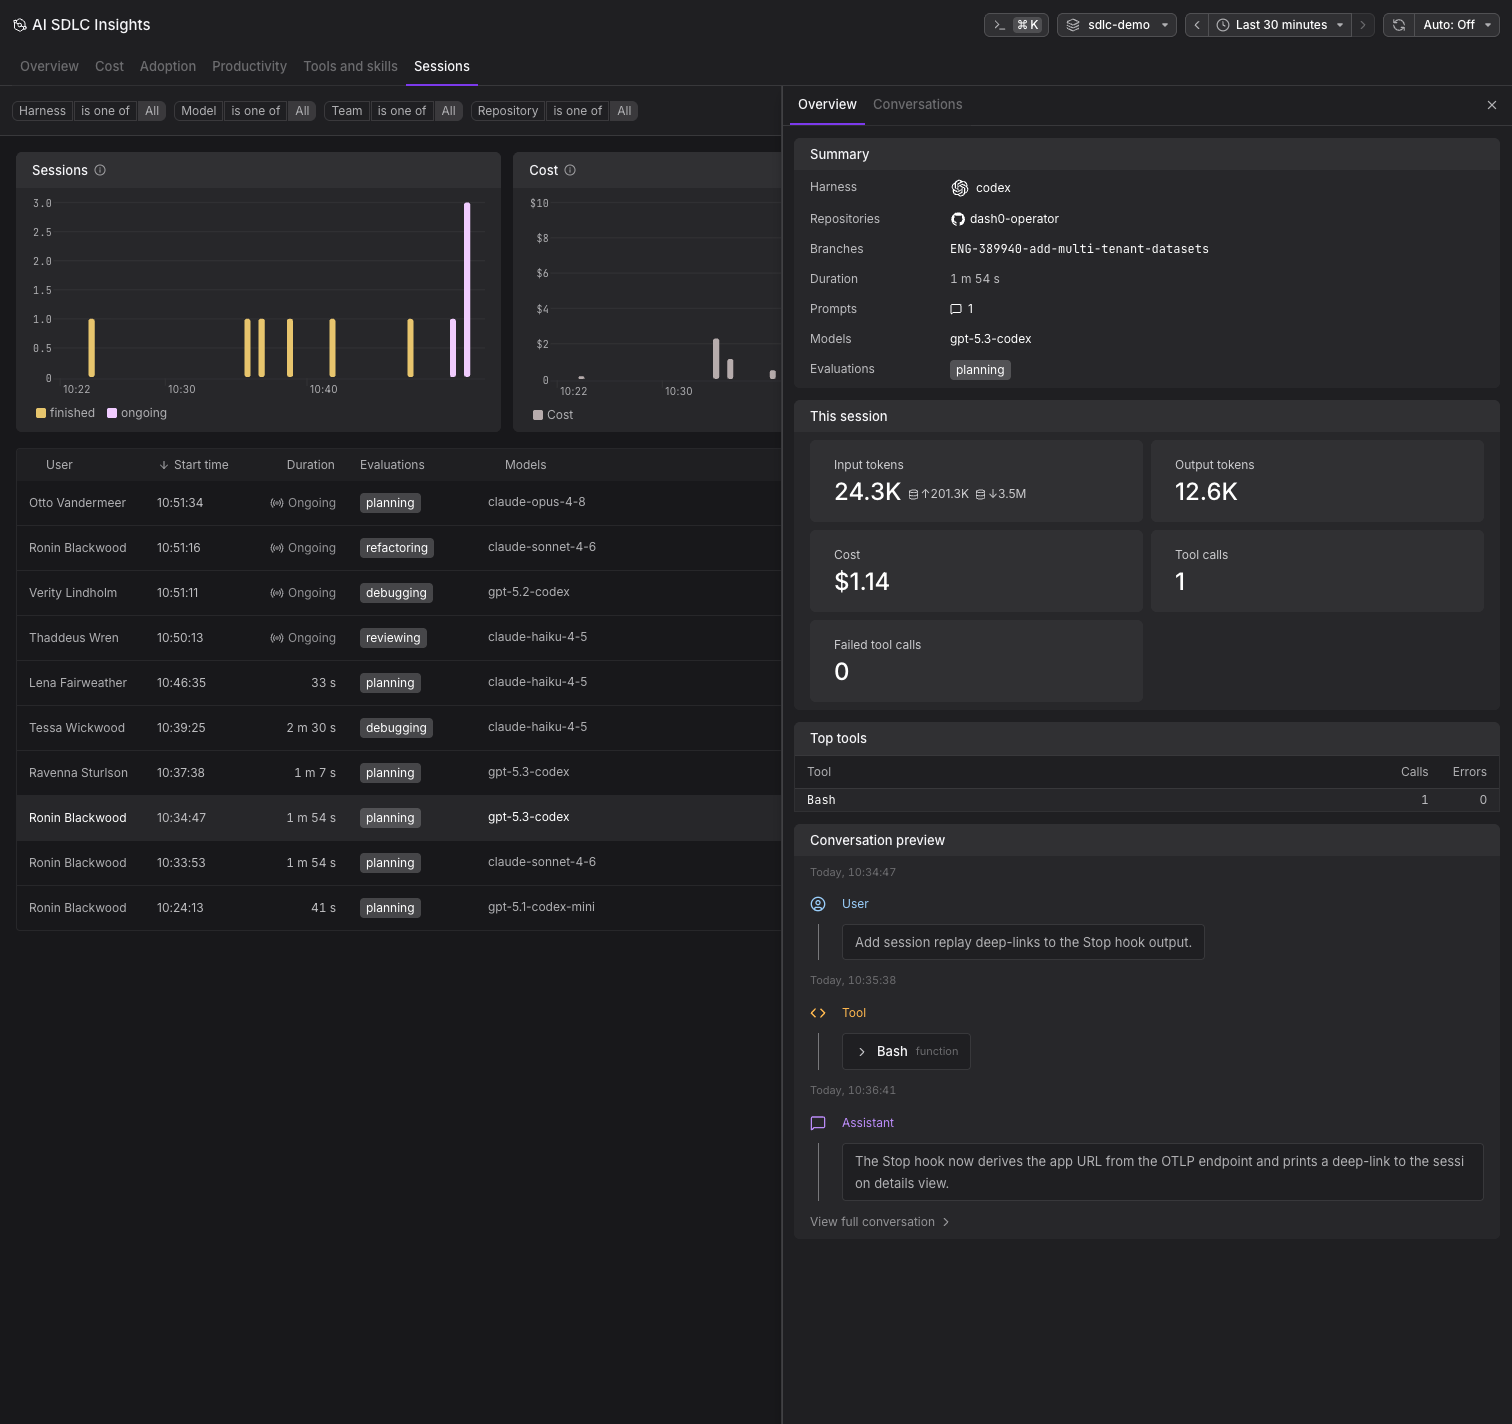
One row per session with user, duration, evaluations, models, and cost. Open one for tokens, tool calls, and the conversation.
Every number opens up.
A total spend and a cycle time are where you start, not where you stop. Each one opens into the work behind it: which stage holds pull requests up, whose repositories the bill came from, and what the sessions were doing.
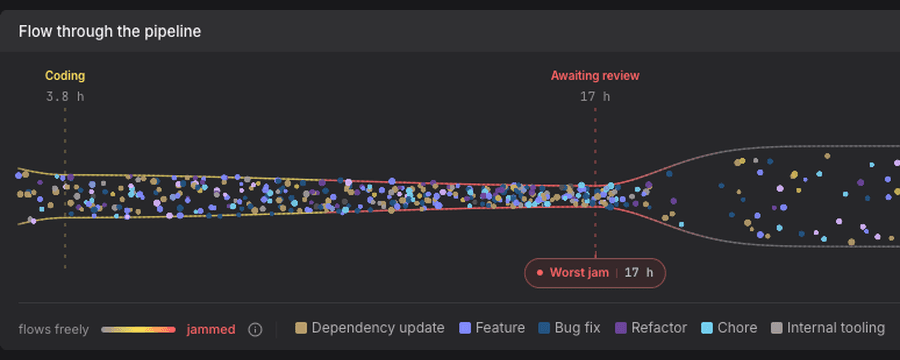
Where pull requests actually stall
Merged pull requests move through coding, awaiting review, in review, and awaiting merge. Each stage carries its own wait at the percentile you pick, and the longest one is named as the worst jam.
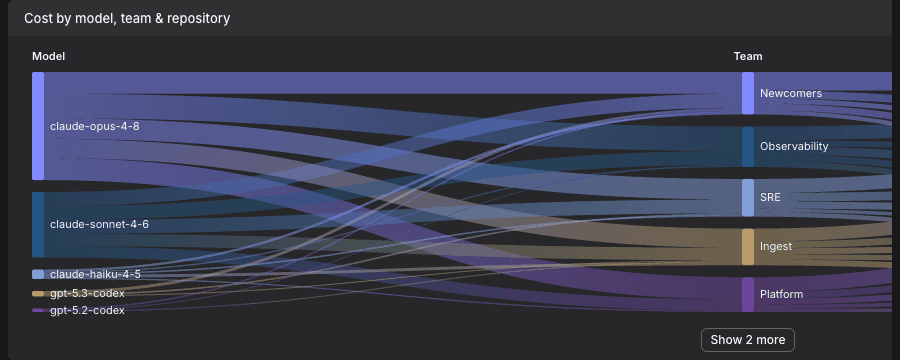
A bill traced back to the work
A Sankey running from model, through team, to repository. Follow a model's spend into the teams reaching for it and the codebases it ran against, rather than stopping at a total.
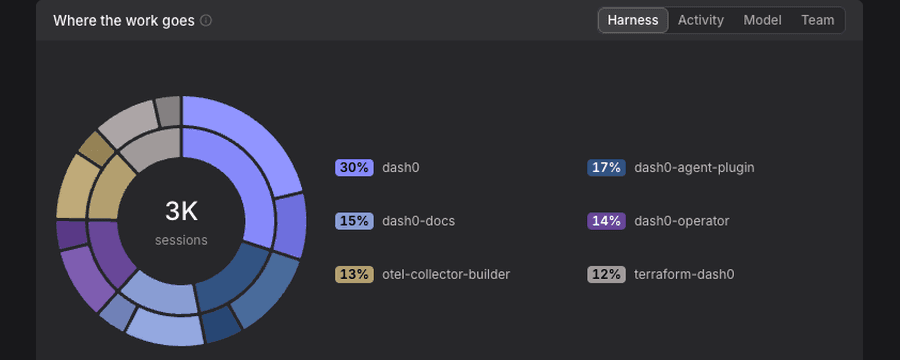
What the capacity went on
Sessions split by harness, activity, model, or team, next to merged pull requests grouped by type. This is where dependency updates and chores turn out to outweigh features.
Every session, replayable
Find the run you care about, sort by cost, and read the conversation exactly as the harness ran it. Cache reads sit next to token cost, which is usually what separates an expensive session from an efficient one.
Connects to your stack, not the other way around.
One open-source plugin, built on standard OpenTelemetry. Install it and session telemetry flows into Dash0 as standard OTel traces over OTLP. No proprietary agent, no lock-in.
Portable, not locked in
Everything is standard gen_ai.* and vcs.* OpenTelemetry over OTLP. If you ever leave Dash0, point the OTLP exporter at any other OTel-compatible backend and the instrumentation still works.
Claude Code, Cursor, Codex, Copilot CLI
One plugin covers all four. Chat and LLM-call spans with full token accounting, tool and MCP calls, sub-agent activity, and errors start flowing right away, and every harness lands in the same views, comparable on cost, adoption, and time to merge.
Tune what leaves your machine
Prompt and tool I/O are stripped by default (DASH0_OMIT_IO=true). Set DASH0_OMIT_USER_INFO=true to hash user.name and drop email.
Ship it to the whole organization
For Claude Code, managed settings install and configure the plugin for every member with no per-developer steps, from the admin console or as an on-disk file through your MDM. The other harnesses install unattended from whatever already provisions developer machines.
Priced per user, not per token.
$10 per user per month. A fraction of what the agents themselves cost.
| Users | Monthly | Annual |
|---|---|---|
| 10 | $100 | $1,200 |
The factory is running.
AI is writing more of your codebase every week. AI SDLC Insights shows you what it's building, what it costs, and whether the investment is working, per tool, per team, per model.