Last updated: September 21, 2026
Correlating Metrics and Traces with OpenTelemetry Exemplars
Metrics are good at revealing broad patterns in how software behaves. A latency histogram can show that requests got slower, and a counter can show that errors increased, but neither one tells you which requests were responsible.
Exemplars connect those aggregates back to individual requests. By carrying a trace or span reference with a metric measurement, they let you jump from a chart to one concrete request that contributed to it.
That sounds straightforward, but keeping the link intact is not. An exemplar is created in the SDK, has to survive an export protocol, a Collector component, a backend's ingest path, its storage layer, a query, and finally a UI that knows how to render it.
Keeping exemplars useful means preserving them at every stage, from capture and export through storage and display, until the trace link is actually needed.
In this article, you'll follow that path end to end and see how exemplars are created, where they can be dropped, how backends store and expose them, and what has to happen for a metric to correlate cleanly with a trace.
Setting up the demo
To make each step concrete, we'll use a small local demo you can run yourself:
1git clone https://github.com/dash0-community/opentelemetry-exemplars && cd opentelemetry-exemplars
1docker compose up -d --build
The setup uses a Python service, the OpenTelemetry Collector, Prometheus, and Jaeger to produce a working metric-to-trace link.
The service records request duration as a histogram while traces capture the work behind each request. Metrics travel over OTLP through the Collector and into Prometheus's native OTLP ingestion path, while Jaeger stores the corresponding traces.
What are OpenTelemetry exemplars?
An exemplar is a sample measurement retained alongside an aggregated metric data point and annotated with the trace context that was active when the measurement was recorded. The specification's stated purpose is straightforward: linking metrics back to traces.
The obvious alternative is attaching the trace ID as a metric attribute, but that would explode cardinality. Every request has a unique trace ID, so each one would create a separate time series containing a single sample. Exemplars keep the trace reference outside the metric's attribute set, so the number of time series stays bounded while individual measurements remain traceable.
An exemplar can carry a trace_id and span_id, along with its timestamp,
recorded value, and filtered attributes that provide additional context about
the measurement. Two properties are especially important in practice.
First, exemplars are most useful for aggregates that hide individual events, especially histograms and counters. A histogram bucket might tell you that forty requests took between one and two and a half seconds; an exemplar gives you one of those requests to inspect.
Second, the exemplar's value is already part of the aggregate it annotates. For histograms, it is already included in the bucket counts, total count, and sum. For sums, it is already included in the overall value. Enabling exemplars does not double-count measurements or change the metric itself.
Exemplars are marked Stable in the specification, but there's no separate exemplar API to call. You record measurements as usual, and the SDK attaches trace context to selected measurements according to the rules covered below.
If you need the surrounding metrics concepts, our article on OpenTelemetry metrics covers instruments, aggregation, and views.
What has to be true at every stage
An exemplar survives each stage only if that stage can represent it, is configured to preserve it, and doesn't discard it along the way. If any of those conditions fail, the exemplar is silently lost.
Here's the whole chain, with the requirement at each stage and the most common way it fails:
| Stage | What must be true | Typical failure |
|---|---|---|
| SDK | An exemplar is captured and retained | Filter, context, or reservoir prevents it |
| Export | The format preserves exemplars | A conversion drops them |
| Backend | Exemplars are stored | Storage or ingest drops them |
| Query/UI | Exemplars are exposed | Query or UI ignores them |
| Trace link | The referenced trace resolves | Linking, sampling, or retention breaks it |
Asynchronous instruments are a special case. Their callbacks run during
collection rather than in the application's request context, so they generally
can't provide the request-to-trace correlation demonstrated here with the
default trace_based filter.
The rest of this article walks the chain in order, showing what has to be true at each stage and how to verify it.
Making the OpenTelemetry SDK emit exemplars
Exemplar capture is automatic when the filter allows it. You only need to record a measurement on a synchronous instrument in the context of an active span, can attach that span's trace context to the exemplar.
The filter is the first gate in exemplar capture. If a measurement is not eligible, nothing later in the pipeline can turn it into an exemplar. The specification defines three filters:
always_on: every measurement can be considered for an exemplar.always_off: exemplar capture is disabled.trace_based: a measurement is eligible only when it is recorded while a sampled span is active.
All three are configurable through
OTEL_METRICS_EXEMPLAR_FILTER,
and the specification default is trace_based. That default avoids exemplars
for traces rejected by the sampling decision already visible in the
application's span context. A later tail-sampling decision can still discard the
referenced trace, as we'll discuss later.
SDKs can deviate from the specification default, so check your SDK's behavior or
set OTEL_METRICS_EXEMPLAR_FILTER explicitly. For example, the .NET SDK
disables exemplars by default
with AlwaysOff.
The other requirement is where the measurement is recorded. With the
trace_based filter, the SDK looks at the current Context when a synchronous
measurement is recorded. If a sampled span is active, its trace context can be
attached to the exemplar:
123with tracer.start_as_current_span("GET /checkout"):seconds = do_the_work()latency.record(seconds, {"http.route": "/checkout"})
If the same measurement is recorded outside that span, there's no trace context to attach, so it can't produce a trace-correlated exemplar.
Reservoirs: how the SDK chooses which measurements to keep
Passing the filter only makes a measurement eligible for an exemplar. The SDK still has to decide which eligible measurements to retain, and that's the job of the exemplar reservoir.
Reservoirs are deliberately bounded as the goal is keeping a small, useful sample of measurements rather than retain every eligible one.
OpenTelemetry defines two main reservoir strategies:
SimpleFixedSizeExemplarReservoir, which keeps a fixed number of exemplars and samples across the measurements it sees.AlignedHistogramBucketExemplarReservoir, which keeps at most one exemplar for each histogram bucket.
Explicit bucket histograms use the bucket-aligned reservoir, while other aggregations typically use a fixed-size reservoir.
For explicit bucket histograms, the practical consequence is that you can get at most one exemplar per bucket per collection interval.
The important thing to know is that an exemplar is a sample, not necessarily the most interesting measurement. If three requests land in the same bucket during an interval, only one may be retained, and it's not guaranteed to be the slowest.
So exemplars are good at showing you a trace associated with a part of the distribution, but they don't necessarily attach the most interesting request. If you need that kind of selection, you'll need a custom reservoir or a different sampling strategy.
Bucket boundaries decide how many exemplars you see
For explicit bucket histograms, the reservoir can retain at most one exemplar per bucket per collection interval. That means bucket boundaries affect exemplar selection as well as the histogram itself.
If the boundaries are poorly matched to the values being recorded, most or all measurements can land in the same bucket. You may then see only one exemplar even under heavy traffic since there are not enough populated buckets to retain more exemplars.
The fix is to use boundaries that match the metric's unit and expected value distribution. If you control the metric, define appropriate bucket boundaries when you instrument it. If you don't control the metric, use a View to override its aggregation:
12345678# main.pyseconds_buckets = View(instrument_type=Histogram,instrument_name="http.server.request.duration",aggregation=ExplicitBucketHistogramAggregation(boundaries=[0.005, 0.01, 0.025, 0.05, 0.1, 0.25, 0.5, 1.0, 2.5, 5.0, 10.0]),)
This is worth checking early when troubleshooting. If you see one exemplar rather than none, inspect the histogram boundaries before assuming something in the telemetry pipeline is dropping them.
Getting exemplars through the export path
OTLP can represent exemplars natively, so an OTLP exporter doesn't need to translate them before sending the metric. But that only gets the exemplar across the first boundary.
If the receiving system converts OTLP into another format internally, forwards it through another protocol, or stores it in a representation that does not support exemplars, the correlation can still be lost.
The Collector's debug exporter is useful here because it shows the OTLP representation of your metric data before another exporter converts it:
123456789101112Descriptor:-> Name: http.server.request.duration-> Unit: s-> DataType: Histogram-> AggregationTemporality: Cumulative...Exemplars:Exemplar #0-> Trace ID: 16e73e7790599e68f856d469f66c16a9-> Span ID: 05934aefb7bfb182-> Timestamp: 2026-09-17 12:47:56.325260574 +0000 UTC-> Value: 0.092667
If the exemplar is present here but missing in your backend, it means the SDK produced it and the Collector received it so the failure is somewhere downstream.
Exemplar handling across ingest paths in Prometheus
Prometheus is a useful example because it supports multiple ingest paths, and exemplar handling differs between them.
If you send metrics to Prometheus through its native OTLP receiver, exemplars stay in OTLP all the way through ingestion, so there is no scrape-format conversion to strip them out. Prometheus still needs exemplar storage enabled:
123456789# docker-compose.ymlservices:prometheus:image: prom/prometheus:v3.14.0container_name: exemplars-prometheuscommand:- --web.enable-otlp-receiver- --enable-feature=exemplar-storage# [...]
If exemplar storage is disabled, Prometheus can accept and store the metric while silently discarding the attached exemplars. The result is indistinguishable from a data point that never produced an exemplar in the first place.
If instead you use the Collector's prometheus exporter and have Prometheus scrape it, the metric has to be converted into a Prometheus exposition format. The plain text format cannot represent exemplars, so the exporter needs OpenMetrics enabled:
12345# otelcol.yamlexporters:prometheus:endpoint: 0.0.0.0:8889enable_open_metrics: true
If OpenMetrics is disabled, the metric is still exposed and scraped normally, but the exemplar is lost during conversion. You also need to retain the exemplar storage feature flag.
The third path is Remote-Write, which is a common ingest route for
Prometheus-compatible backends that do not accept OTLP directly. The protocol
can carry exemplars, and the Collector's
prometheusremotewrite exporter
translates OTLP exemplars into the corresponding remote write fields.
On the Prometheus side, you only need to enable the Remote-Write receiver with
--web.enable-remote-write-receiver and exemplar storage as shown earlier.
Seeing the exemplar, and getting to the trace
Once an exemplar reaches the backend, two things still have to happen:
- Rendering: the UI has to show the exemplar and expose its trace ID.
- Navigation: the UI has to turn that trace ID into a link to the corresponding trace.
Prometheus can render exemplars in its graph view. When exemplar display is
enabled, markers appear on the graph, and selecting one shows the exemplar
labels, including trace_id and span_id.
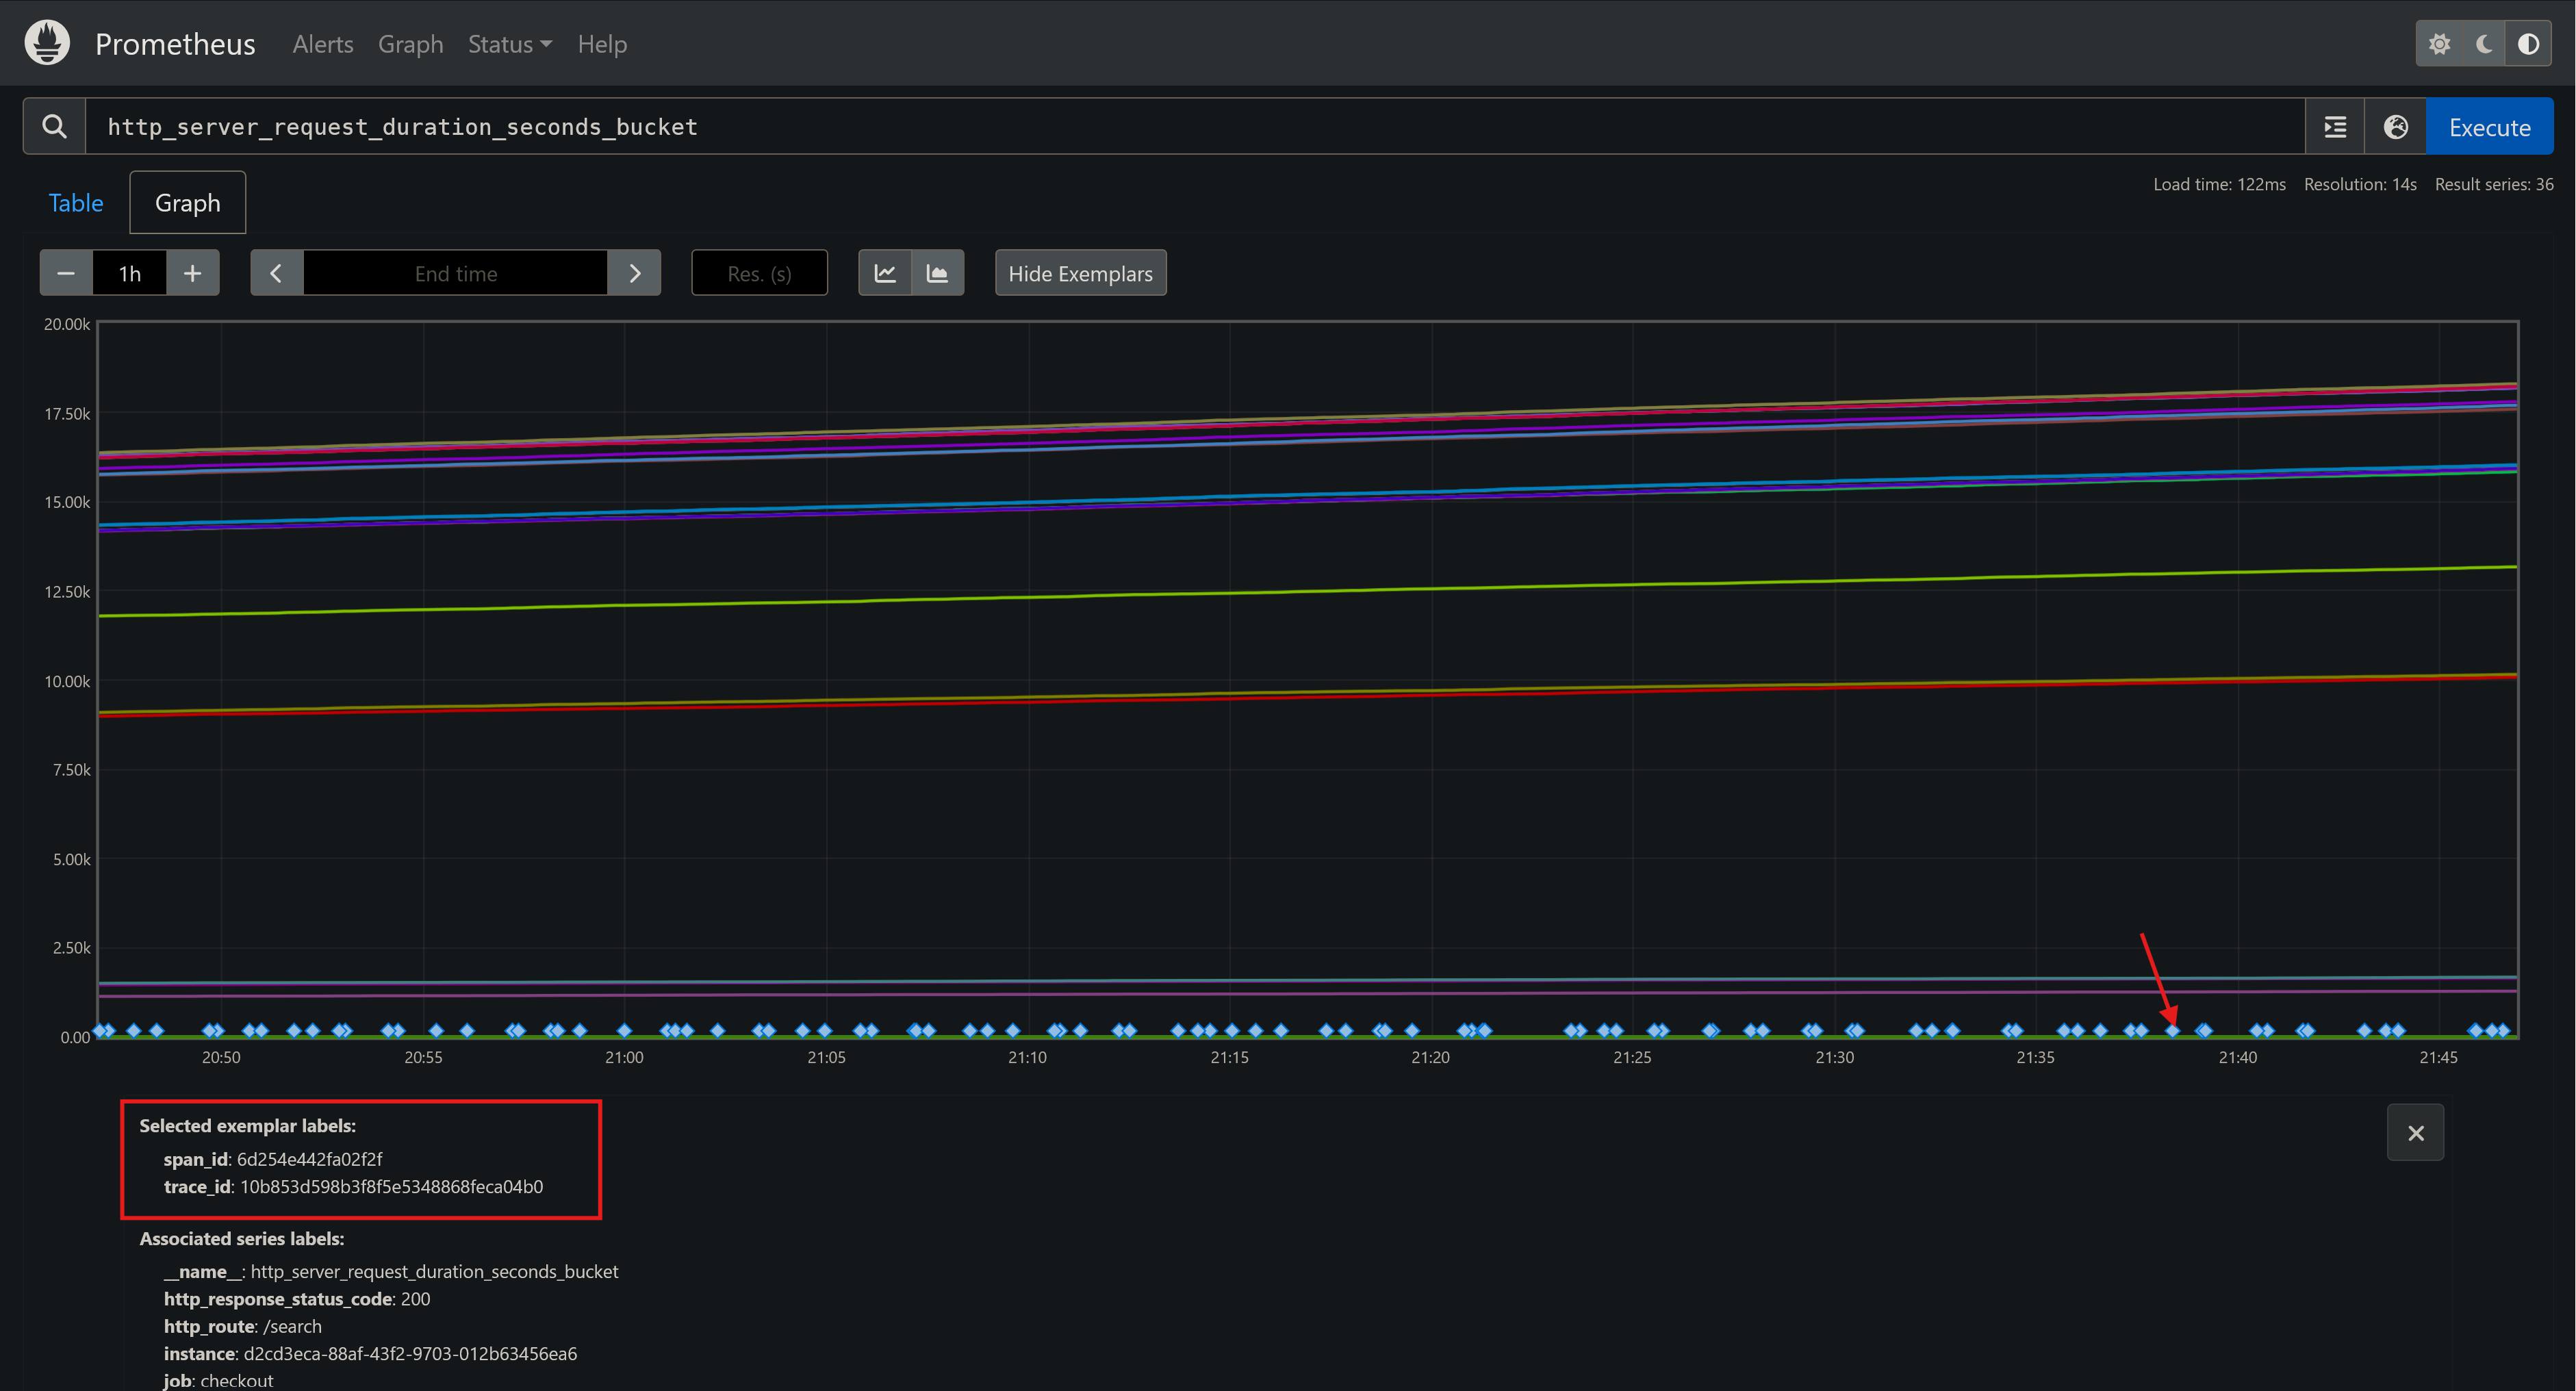
At the time of writing, Prometheus still requires the old-ui feature flag to
render exemplars in the graph view because the newer 3.x UI does not yet expose
that functionality:
12command:- --enable-feature=exemplar-storage,old-ui
Prometheus cannot navigate from that trace ID to Jaeger in this setup, so you have to open the trace manually:
1http://localhost:16686/trace/<trace_id>
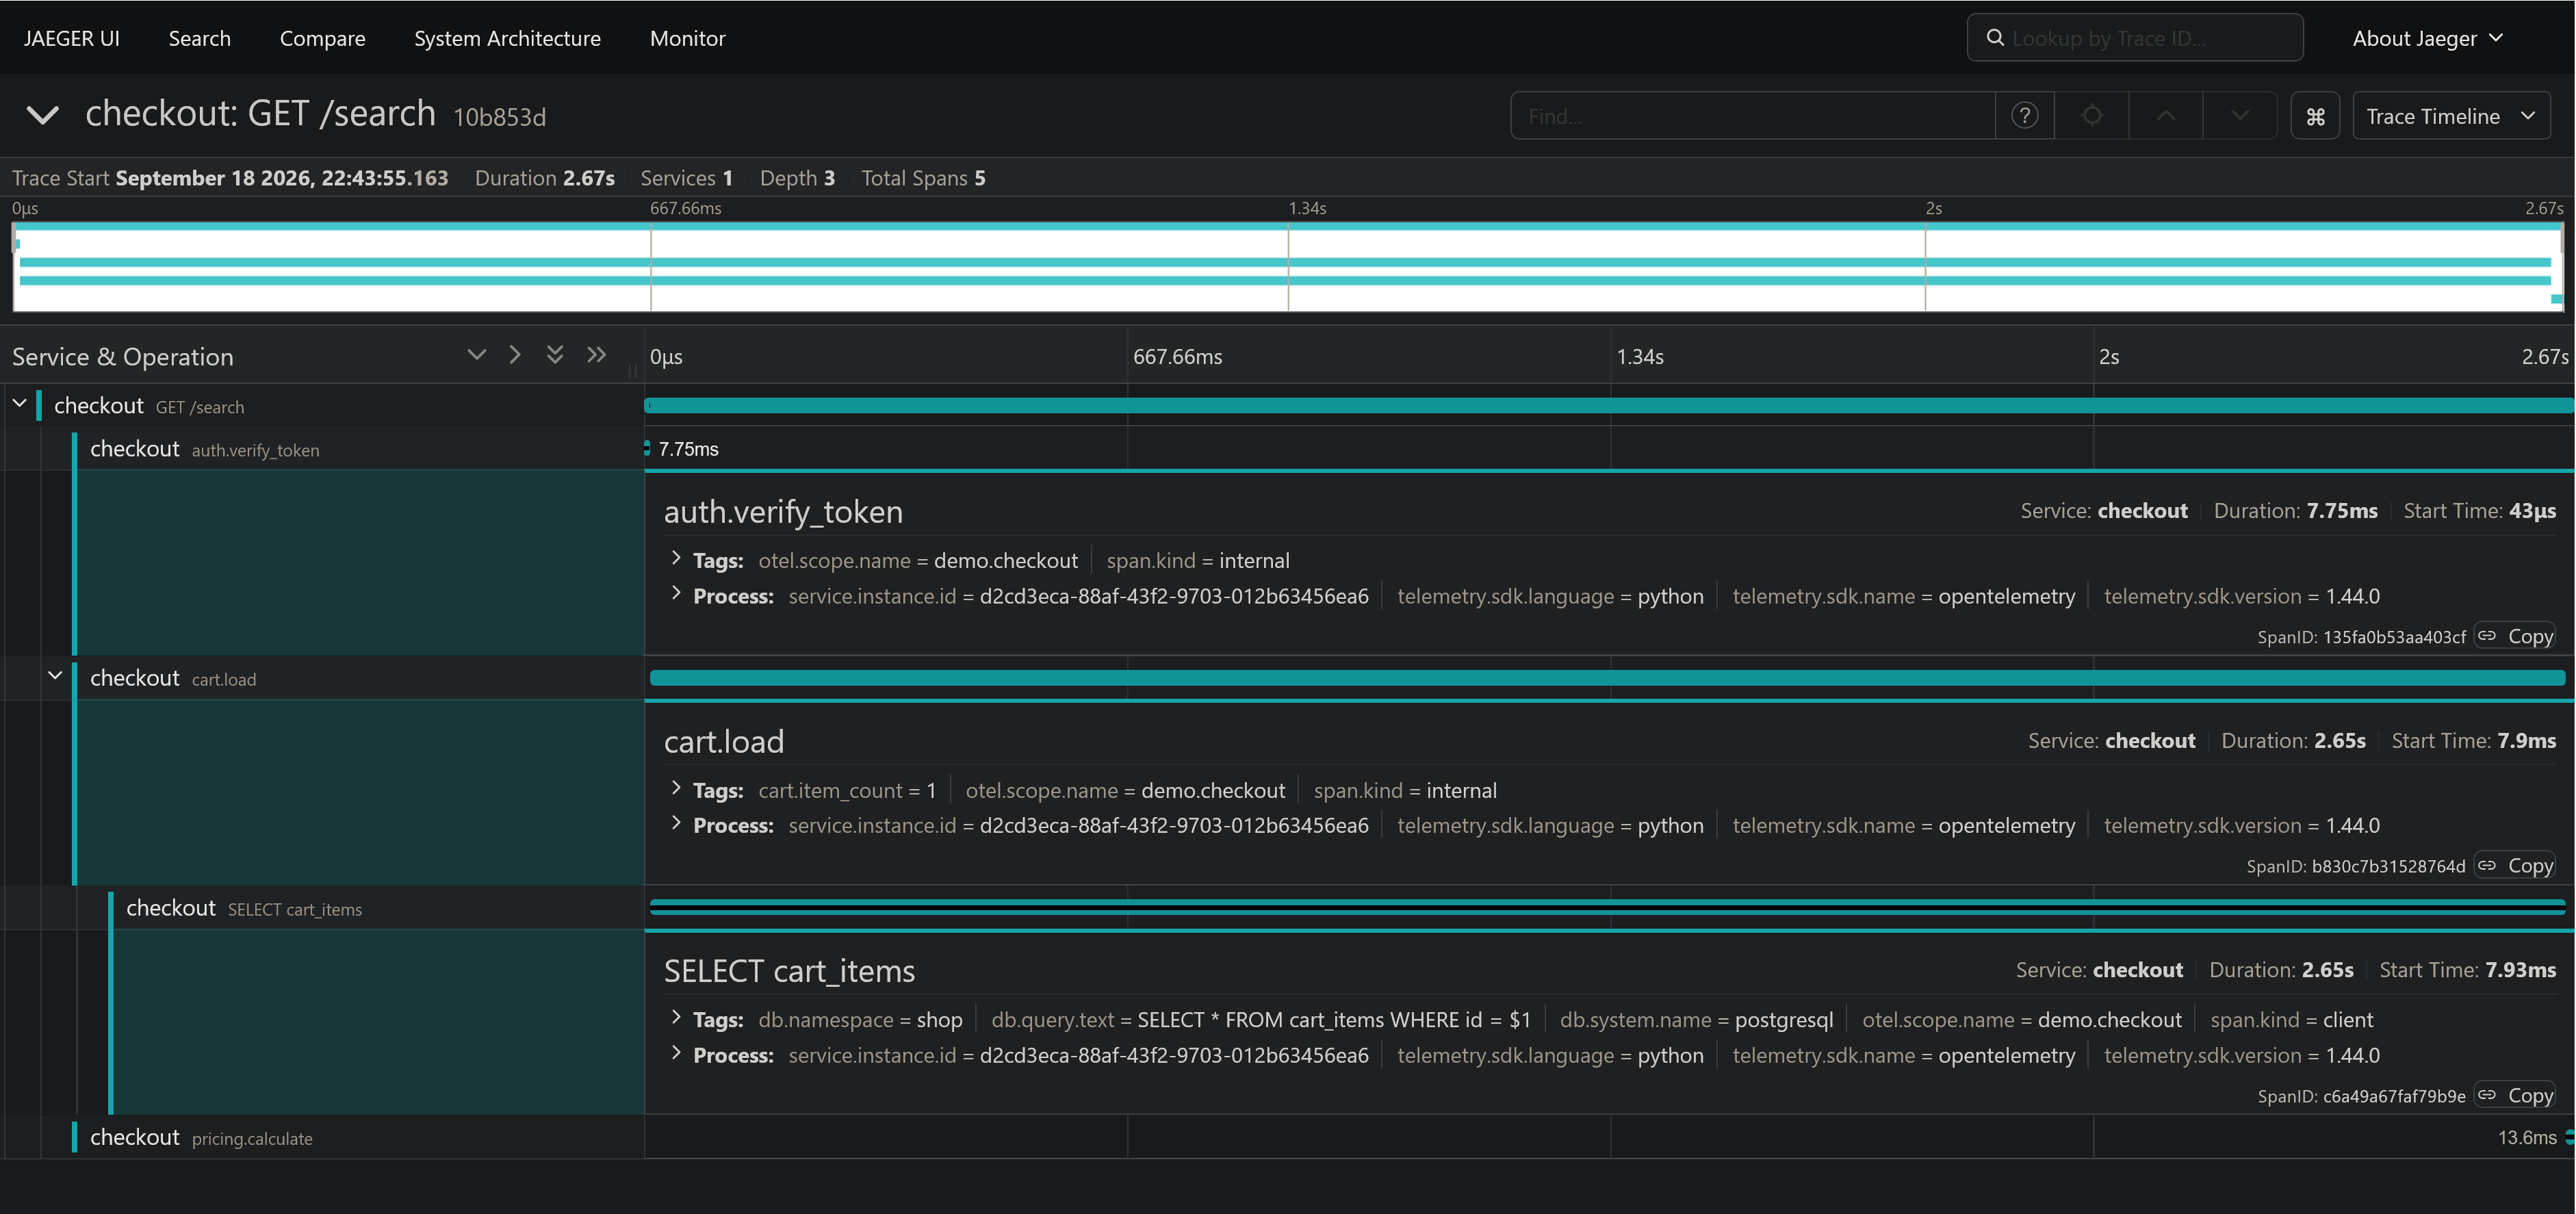
If the exemplar appears in Prometheus and that trace opens in Jaeger, the correlation survived the full pipeline.
If the exemplar is present but the trace cannot be found, the problem is on the tracing side rather than the metrics path.
Why an exemplar can point at a trace that no longer exists
An exemplar can survive the entire metrics pipeline and still lead nowhere if the trace it references is later discarded.
This commonly happens with tail sampling where the SDK records the exemplar while the application span is active, before the Collector has made its tail-sampling decision. The metric can therefore leave the application carrying a valid trace ID even if the Collector later decides not to retain that trace.
So if you can see the exemplar and its trace ID in the metrics backend, but the corresponding trace cannot be found, the exemplar pipeline may be working correctly. The trace may simply have been sampled out.
There are a few ways to deal with this.
If occasional dead links are acceptable, you may not need to do anything. Exemplars are samples themselves, and retaining every referenced trace may not be worth the additional trace volume.
But if you need exemplar links to resolve reliably, the metric and trace pipelines need some way to coordinate. This means identifying the span selected as an exemplar and ensuring the tail sampler keeps the trace containing it.
OpenTelemetry does not standardize that coordination today, but there's an open proposal to add a span flag whenever a span's trace context is used for a metric exemplar. A tail sampler could then recognize that flag and retain traces referenced by metrics rather than accidentally dropping them.
Until such a mechanism exists, you may need to implement that coordination yourself using SDK-specific exemplar extension points, for example by marking the span selected for an exemplar and configuring the tail sampler to retain traces carrying that marker.
Doing this correctly requires keeping the marker aligned with the exemplar that is actually selected, so it's more involved than simply adding an attribute to every eligible span.
123456789101112131415161718# otelcol.yamlprocessors:tail_sampling:decision_wait: 5sexpected_new_traces_per_sec: 10policies: [{name: keep-exemplars,type: string_attribute,# assuming you add an exemplar=true attribute to mark selected spansstring_attribute: { key: "exemplar", values: ["true"] },},{name: keep-10-percent,type: probabilistic,probabilistic: { sampling_percentage: 10 },},]
In practice, it's simpler to accept that some exemplar links may become stale when tail sampling is used. Retention can produce the same symptom for a different reason. If metrics are kept longer than traces, an exemplar can simply outlive the trace it points to.
So a broken exemplar link does not necessarily mean the exemplar pipeline failed. The trace may simply have been dropped by sampling or expired from storage.
Using span-derived metrics for exemplars
Exemplars don't always have to come from application-recorded metrics. The
spanmetrics connector
can derive RED metrics from spans and attach the originating spans as exemplars:
12345# otelcol.yamlconnectors:span_metrics:exemplars:enabled: true
But the same tail-sampling problem still applies. If span_metrics runs before
tail_sampling, it can attach an exemplar for a span that a later sampling
decision drops. The derived metric survives, but the trace behind its exemplar
may not.
Putting span_metrics after tail_sampling avoids that particular failure
mode, because it only sees spans that were retained. The trade-off is that the
metrics are now derived from the sampled trace population rather than from all
incoming spans which materially changes what the metrics mean.
Final thoughts
Exemplars are easy to generate and surprisingly easy to lose.
The SDK has to capture one, the export path has to preserve it, the backend has to store it, the query layer has to return it, the UI has to expose it, and the referenced trace still has to exist when you follow the link.
That makes exemplars less like a feature you enable once and more like correlation data that has to survive the entire telemetry path.
If you're building or debugging that path, confirm that the SDK produced an exemplar, that the Collector received it, that the backend stored it, and that the referenced trace survived sampling and retention.
Once that chain is intact, a latency spike stops being an anonymous aggregate and becomes a concrete trace you can investigate.