Last updated: June 2, 2026
Logrus Logging in Go: A Complete Guide
Logrus was the go-to structured logging library for Go for much of the 2010s, and if you've worked on a codebase that's more than a few years old, you've almost certainly seen it.
The import path github.com/sirupsen/logrus shows up in go.sum files across a
huge slice of the Go ecosystem, and it earned that position by being genuinely
useful at a time when Go's standard library offered almost nothing for
structured logging.
But here's the thing you should know before reading further: Logrus has been in maintenance mode since around 2020. The author won't add new features, its ecosystem has stagnated, and since Go 1.21 shipped log/slog in the standard library, there's no reason to reach for Logrus in a new project anymore.
If your current project uses Logrus and you can't migrate away, it's still worth knowing how to use it well. This guide covers the patterns that hold up in production, the parts worth being skeptical of, and where the modern alternatives do things better.
What Logrus does
Logrus adds structured logging on top of Go's standard log package. The
meaningful additions over the standard library are structured fields attached to
log entries rather than raw strings, multiple log levels with configurable
filtering, JSON and text formatters, a hook system for routing log output, and
the logrus.Entry type for building up context incrementally across a request
lifecycle.
If you've only ever used Go's standard log package,
structured logging
is what changes everything. Instead of logging raw strings that you'll later
need a regex to parse, you log a message with discrete fields that any log
aggregator can filter and index independently.
Getting started with Logrus
Install the Logrus package in your project through the following command:
1go get github.com/sirupsen/logrus
Logrus uses the sirupsen/logrus import path. If you're maintaining older code
and hitting mysterious import errors, you might be looking at a dependency that
still uses Sirupsen/logrus with a capital S — the original import path before
the maintainer renamed the GitHub organization to lowercase.
The two paths are incompatible, and the Go toolchain's error message (unexpected module path) isn't obvious about the cause. The fix is updating the import path to its lowercase form throughout any affected dependency.
Once the package is installed, you can start logging in a few lines. The pre-configured global logger is the quickest way in:
1234567891011package mainimport log "github.com/sirupsen/logrus"func main() {log.SetFormatter(&log.JSONFormatter{})log.WithFields(log.Fields{"user_id": 12345,"action": "login",}).Info("user authenticated")}
The WithFields() method is the core of what makes Logrus more useful than the
older log package as it allows you to attach typed key-value pairs to a log
entry rather than interpolating values into the message string.
It then outputs newline-delimited JSON to stderr:
1234567{"action": "login","level": "info","msg": "user authenticated","time": "2026-06-01T10:40:06+01:00","user_id": 12345}
The global logger works fine for small programs, but it makes testing harder and it can lead to unexpected behavior as any package can reconfigure it. For anything production-sized you'll want to instantiate your own logger and pass it explicitly:
1234567891011121314package mainimport "github.com/sirupsen/logrus"func main() {logger := logrus.New()logger.SetFormatter(&logrus.JSONFormatter{})logger.SetLevel(logrus.InfoLevel)logger.WithFields(logrus.Fields{"user_id": 12345,"action": "login",}).Info("user authenticated")}
The result is the same, but the logger is now a value you own: you can pass it as a dependency, swap it out in tests, and stop any package from silently reconfiguring it under you.
How log levels work in Logrus
Logrus has seven levels, which are listed below from the most to least verbose:
| Level | Typical use case |
|---|---|
| Trace | Fine-grained internal details of the system |
| Debug | Development diagnostics |
| Info | Normal operations |
| Warn | Unexpected conditions that aren't outright failures |
| Error | Failed operations |
| Fatal | Logs an error then calls os.Exit(1) |
| Panic | Logs an error then calls panic() |
These levels are all exposed through simple method calls:
1234567log.Trace("a trace message")log.Debug("a debug message")log.Info("an info message")log.Warn("a warning message")log.Error("an error message")log.Fatal("a fatal message")log.Panic("a panic message")
The default level for a logger is Info, which means Trace and Debug logs
are suppressed unless you explicitly lower it. Reading the level from an
environment variable is the usual pattern:
12345678910111213func newLogger() *logrus.Logger {logger := logrus.New()logger.SetFormatter(&logrus.JSONFormatter{})level, err := logrus.ParseLevel(os.Getenv("LOG_LEVEL"))if err != nil {level = logrus.InfoLevel}logger.SetLevel(level)return logger}
You can then control the log level when starting your application through the
LOG_LEVEL environment variable:
1LOG_LEVEL=warn ./go-app
Changing log levels at runtime
Calling logger.SetLevel() takes effect immediately for all subsequent log
calls, which means you can adjust verbosity without restarting the process. A
common pattern is exposing a small (protected) HTTP endpoint that accepts a
level name and applies it:
1234567891011http.HandleFunc("/log-level", func(w http.ResponseWriter, r *http.Request) {level, err := logrus.ParseLevel(r.URL.Query().Get("level"))if err != nil {http.Error(w, "invalid level", http.StatusBadRequest)return}logger.SetLevel(level)fmt.Fprintf(w, "log level set to %s\n", level)})
This is useful in production when you need to temporarily drop to Debug to
diagnose a problem without a deployment. When you're done with active
troubleshooting, you can bump it back to Info by sending another request.
Deferring expensive log construction
If building a log message is expensive (serializing a large struct, running a
query to gather diagnostic data), you don't want to pay that cost when the log
level means the entry will be discarded anyway. Logrus provides LogFunction()
variants for each level that accept a function instead of arguments. The
function is only called if the level is enabled:
1234logger.DebugFn(func() []interface{} {snapshot := buildExpensiveDiagnosticSnapshot()return []interface{}{snapshot}})
If the logger is set to Info or above, the function never executes and the
snapshot is never built. This is particularly useful for Debug() and Trace()
calls in hot paths where the diagnostic data is costly to assemble but you still
want it available when troubleshooting with a lowered log level.
Understanding how Logrus formatters work
Logrus ships with two formatters: JSONFormatter and TextFormatter. While
TextFormatter produces logfmt-style output, which is structured, logfmt is
nowhere near as widely supported as
JSON across observability tools.
Therefore the recommended choice is always JSONFormatter for your production
logs. You only need to configure JSONFormatter once at initialization and
leave it on for any environment where logs leave the process:
123logger.SetFormatter(&logrus.JSONFormatter{TimestampFormat: time.RFC3339,})
Logrus defaults to msg as the message field key and time for the timestamp,
but your observability tool may expect different names. Check what it expects
and remap with FieldMap before you go to production:
1234567logger.SetFormatter(&logrus.JSONFormatter{FieldMap: logrus.FieldMap{logrus.FieldKeyTime: "timestamp",logrus.FieldKeyLevel: "severity",logrus.FieldKeyMsg: "message",},})
TextFormatter is still useful locally, where you're reading logs directly
rather than shipping them anywhere:
1234logger.SetFormatter(&logrus.TextFormatter{FullTimestamp: true,TimestampFormat: "15:04:05",})
The output looks like this when a TTY is attached:
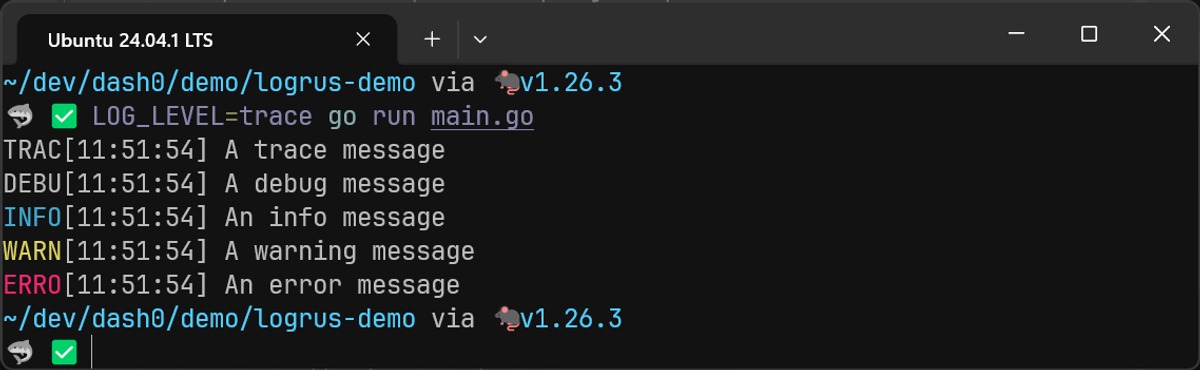
But when a TTY isn't attached, the output looks like this
12345time="13:41:22" level=trace msg="A trace message"time="13:41:22" level=debug msg="A debug message"time="13:41:22" level=info msg="An info message"time="13:41:22" level=warning msg="A warning message"time="13:41:22" level=error msg="An error message"
If you need predictable output in all contexts, use DisableColors: true:
12345logger.SetFormatter(&logrus.TextFormatter{DisableColors: true,FullTimestamp: true,TimestampFormat: "15:04:05",})
A reasonable and common pattern is switching between JSON and text output depending on the environment:
123456789if os.Getenv("APP_ENV") == "production" {logger.SetFormatter(&logrus.JSONFormatter{})} else {logger.SetFormatter(&logrus.TextFormatter{DisableColors: true,FullTimestamp: true,TimestampFormat: "15:04:05",})}
Writing to files and multiple outputs
By default Logrus writes to os.Stderr, which is the right choice for
containerized applications where a log collector automatically picks up
stdout/stderr. If you're running on a VM or bare metal and need to write
directly to a file, you can redirect the output:
123456789101112file, err := os.OpenFile("app.log",os.O_CREATE|os.O_WRONLY|os.O_APPEND,0644,)if err != nil {log.Fatal(err)}defer file.Close()logger.SetOutput(file)
If you need to write to both stderr and a file simultaneously (for example,
tailing logs locally while also persisting them), io.MultiWriter handles it:
1logger.SetOutput(io.MultiWriter(os.Stderr, file))
The problem with writing to a single file like this is that it grows without bound. In a long-running service, a single log file will eventually eat the disk. You need log rotation with a tool like logrotate: closing the current file when it gets too large, renaming it with a timestamp, and opening a fresh one.
If handling rotation in-process is preferable, you can drop in lumberjack, which is the most widely used log rotation package in the Go ecosystem. Install it alongside Logrus:
1go get gopkg.in/natefinch/lumberjack.v2
Then pass a *lumberjack.Logger as the output writer:
12345678910111213141516171819import ("github.com/sirupsen/logrus""gopkg.in/natefinch/lumberjack.v2")func setupLogger() *logrus.Logger {logger := logrus.New()logger.SetFormatter(&logrus.JSONFormatter{})logger.SetOutput(&lumberjack.Logger{Filename: "app.log",MaxSize: 100, // megabytesMaxBackups: 5,MaxAge: 30, // daysCompress: true,})return logger}
When the active log file reaches MaxSize megabytes, lumberjack closes it,
renames it with a timestamp (e.g. app-2026-06-01T10-30-000.log), and creates a
fresh app.log for subsequent writes.
MaxBackups controls how many rotated files to keep around, MaxAge deletes
anything older than the specified number of days, and Compress gzips the
rotated files to save disk space. If both MaxBackups and MaxAge are zero,
lumberjack keeps everything, so make sure at least one of them is set to avoid
filling the disk with old logs.
You can also trigger a manual rotation by calling Rotate() on the lumberjack
logger, which is useful if you want to hook into a SIGHUP signal for on-demand
rotation:
123456789101112131415161718lj := &lumberjack.Logger{Filename: "app.log",MaxSize: 100,MaxBackups: 5,Compress: true,}logger.SetOutput(lj)// Rotate on SIGHUPc := make(chan os.Signal, 1)signal.Notify(c, syscall.SIGHUP)go func() {for range c {lj.Rotate()}}()
One thing to be aware of: lumberjack only rotates based on file size, not on a
time schedule. If you need daily or hourly rotation regardless of file size,
you'd need to call Rotate() on a timer yourself, or use an external tool like
the previously mentioned logrotate.
If you're running in containers or Kubernetes, you typically don't need any of
this. Write to stdout or stderr, let the container runtime capture the
output, and let your log collector (such as the
OpenTelemetry Collector,
or similar) handle shipping and retention. File-based rotation is primarily for
traditional deployments where you're managing log files directly on disk.
Adding contextual attributes to Go logs
The value of a log record comes from the context attached to it. These are attributes that let you filter, correlate, and understand what happened when something goes wrong in production. Logrus gives you several ways to attach such context, each suited to a different scope.
Per-event context
The most direct way is at the call site through WithFields(). Each call
creates a one-off *logrus.Entry with those fields attached to that specific
log record:
12345logger.WithFields(logrus.Fields{"order_id": "ord-789","item_count": 3,"total": 59.97,}).Info("order placed")
Use this when the fields are specific to a single event and won't be reused. The
WithField() variant works for a single key-value pair without the
logrus.Fields map:
1logger.WithField("query", sqlQuery).Debug("executing query")
And WithError() is a convenience wrapper that adds the error under the error
key, which keeps error logging consistent across your codebase:
12345if err := db.Query(ctx, query); err != nil {logger.WithError(err).WithField("query", query).Error("database query failed")}
1234567{"error": "an error","level": "error","msg": "database query failed","query": "SELECT * from posts;","time": "2026-06-01T14:10:52+01:00"}
Child loggers
When you need the same fields on multiple log calls within a scope, create a
*logrus.Entry and hold onto it. This is the Logrus equivalent of a child
logger:
12345678910orderLogger := logger.WithFields(logrus.Fields{"order_id": "ord-789","customer_id": "cust-456",})orderLogger.Info("payment processing started")// ... payment logic ...orderLogger.Info("payment captured")// ... fulfillment logic ...orderLogger.Info("order fulfilled")
All three log records carry order_id and customer_id without repeating them:
123{"customer_id":"cust-456","level":"info","msg":"payment processing started","order_id":"ord-789","time":"2026-06-01T14:12:15+01:00"}{"customer_id":"cust-456","level":"info","msg":"payment captured","order_id":"ord-789","time":"2026-06-01T14:12:15+01:00"}{"customer_id":"cust-456","level":"info","msg":"order fulfilled","order_id":"ord-789","time":"2026-06-01T14:12:15+01:00"}
You can layer additional fields onto a child logger by calling WithField or
WithFields again, which returns a new entry with the accumulated fields from
both calls:
12itemLogger := orderLogger.WithField("sku", "WIDGET-42")itemLogger.Info("checking stock")
This entry now carries order_id, customer_id, and sku:
12345678{"customer_id": "cust-456","level": "info","msg": "checking stock","order_id": "ord-789","sku": "WIDGET-42","time": "2026-06-01T14:12:51+01:00"}
The original orderLogger is unchanged, so you're free to create as many
specialized child entries as you need without them interfering with each other.
Global context
Some fields belong on every log record because they describe the process itself rather than any particular event: which service emitted the record, which environment it's running in, which version of the code is deployed, which host it's on, etc.
These fields are static for the lifetime of the process and are essential for filtering when you're looking at logs from more than one service. They are analogous to resource attributes in OpenTelemetry.
Logrus doesn't have a dedicated mechanism for this functionality, but it provides a hook feature that handles this cleanly:
12345678910111213141516type GlobalFieldsHook struct {fields logrus.Fields}func (h *GlobalFieldsHook) Levels() []logrus.Level {return logrus.AllLevels}func (h *GlobalFieldsHook) Fire(entry *logrus.Entry) error {for k, v := range h.fields {if _, exists := entry.Data[k]; !exists {entry.Data[k] = v}}return nil}
The !exists check ensures that per-event fields can override the global
defaults when needed. You only need to register it at initialization:
1234567logger.AddHook(&GlobalFieldsHook{fields: logrus.Fields{"service.name": "order-api","service.version": buildVersion,"deployment.environment.name": os.Getenv("APP_ENV"),},})
With this in place, every log record from this logger now carries the specified attributes without the call sites needing to know about them.
Using OpenTelemetry semantic conventions for the field names from the start means no translation step is needed when the OpenTelemetry Collector ingests your logs. When your log, span, metric and resource attributes, all use the same conventions, correlating across signals just works out of the box.
Sharing log context across a request
In web services, the most common need is carrying request-scoped fields through
the entire call stack without threading them through every function signature.
The standard Go pattern is storing a *logrus.Entry in the request's
context.Context:
123456789101112131415161718type contextKey stringconst loggerKey contextKey = "logger"func LoggerFromContext(ctx context.Context) *logrus.Entry {if entry, ok := ctx.Value(loggerKey).(*logrus.Entry); ok {return entry}return logrus.NewEntry(logrus.StandardLogger())}func WithLogger(ctx context.Context,entry *logrus.Entry,) context.Context {return context.WithValue(ctx, loggerKey, entry)}
The middleware then creates a request-scoped entry and puts it in the context:
123456789101112131415161718func RequestLogger(base *logrus.Logger,) func(http.Handler) http.Handler {return func(next http.Handler) http.Handler {return http.HandlerFunc(func(w http.ResponseWriter, r *http.Request) {entry := base.WithFields(logrus.Fields{"request_id": r.Header.Get("X-Request-ID"),"method": r.Method,"path": r.URL.Path,})ctx := WithLogger(r.Context(), entry)next.ServeHTTP(w, r.WithContext(ctx))})}}
Anywhere downstream, you pull the logger from the context:
1234567func processOrder(ctx context.Context, orderID string) error {logger := LoggerFromContext(ctx).WithField("order_id", orderID)logger.Info("processing order")// ...return nil}
Every log line emitted during this request now carries the request ID, method,
and path from the middleware, plus the order_id added by processOrder. None
of those values are passed as explicit function parameters, and downstream
functions don't need to know where the context originated from.
Enriching context as the request progresses
Real requests accumulate context over their lifecycle. The user is authenticated partway through the middleware chain, a database query returns an account type, a feature flag is resolved. You can layer these into the context incrementally:
12345678910111213141516171819func AuthMiddleware(next http.Handler) http.Handler {return http.HandlerFunc(func(w http.ResponseWriter, r *http.Request) {user, err := authenticate(r)if err != nil {http.Error(w, "unauthorized", 401)return}logger := LoggerFromContext(r.Context()).WithFields(logrus.Fields{"user_id": user.ID,"user_role": user.Role,})ctx := WithLogger(r.Context(), logger)next.ServeHTTP(w, r.WithContext(ctx))})}
Each middleware adds its own fields, and subsequent log calls see the full accumulated context. By the time a log record is emitted deep in the call stack, it might carry the request ID from the request logger middleware, the user ID from the auth middleware, and the order ID from the handler, all without any single layer knowing about the others.
This layered approach to context is what makes structured logging genuinely useful in production. When an error surfaces in your log aggregator, you can filter on any combination of these fields to reconstruct exactly what happened during that specific request.
Adding caller information to your logs
Logrus also has built-in caller reporting via SetReportCaller, which adds the
calling function and file to every log entry without any external dependency:
1logger.SetReportCaller(true)
This adds func and file fields to every entry:
1234567{"file": "/home/user/app/main.go:42","func": "main.handleRequest","level": "error","msg": "request failed","time": "2026-06-01T10:22:31+01:00"}
The trade-off is performance: SetReportCaller uses runtime.Caller on every
log call, which adds 20-40% overhead according to the Logrus documentation.
Hooks
Hooks are Logrus's extension point for running custom logic whenever a log entry is written. They can serve two broad purposes: enriching log entries with additional fields before they're written, and routing log data to secondary destinations alongside the primary output.
The interface is two methods:
1234type Hook interface {Levels() []LevelFire(*Entry) error}
When you register the hook with logger.AddHook(), Logrus calls Fire() every
time an entry is logged at one of the levels Levels() returns.
Enriching or modifying entries
We already saw this pattern in the global context section, where a hook injects process-level fields into every entry. The same approach works for modifying entries before they're written. A practical example is a redaction hook that scrubs sensitive fields so they never reach your log aggregator:
123456789101112131415161718192021222324type RedactionHook struct {redactKeys map[string]bool}func NewRedactionHook(keys ...string) *RedactionHook {m := make(map[string]bool, len(keys))for _, k := range keys {m[k] = true}return &RedactionHook{redactKeys: m}}func (h *RedactionHook) Levels() []logrus.Level {return logrus.AllLevels}func (h *RedactionHook) Fire(entry *logrus.Entry) error {for k := range entry.Data {if h.redactKeys[k] {entry.Data[k] = "[REDACTED]"}}return nil}
Register it with the field names you want scrubbed:
123456logger.AddHook(NewRedactionHook("password","token","api_key","credit_card",))
Any log entry that includes these fields will have their values replaced before the formatter writes them out, so even if a developer accidentally logs a token, it won't make it into your observability backend.
Routing to secondary destinations
The more common use case is sending a subset of log entries somewhere other than the primary output. A typical example is routing error-level entries to a dedicated error tracker:
12345678910111213141516171819202122type ErrorNotifierHook struct {client AlertClient}func (h *ErrorNotifierHook) Levels() []logrus.Level {return []logrus.Level{logrus.ErrorLevel,logrus.FatalLevel,logrus.PanicLevel,}}func (h *ErrorNotifierHook) Fire(entry *logrus.Entry) error {msg, err := entry.String()if err != nil {return err}return h.client.Send(msg)}logger.AddHook(&ErrorNotifierHook{client: alertClient})
Hooks fire synchronously
Hooks run on the same goroutine that called the log method. If your hook does I/O, such as an HTTP request to an alerting service or writing to a remote queue, it blocks every log call at those levels for the duration of that I/O.
You can work around this with an async wrapper, but then you're building a
pipeline that silently drops entries when the buffer saturates. The cleaner
approach is keeping your application's logging simple (write JSON to stdout)
and handling routing out of process.
The OpenTelemetry Collector, Fluent Bit, or a similar log shipper can tail your output, filter by severity, and fan out to multiple destinations without adding latency or complexity to your application code. Routing rules become configuration rather than code, which means you don't need a redeployment to change them.
Reserve hooks for things that genuinely need to happen in-process: enriching entries with fields, redacting sensitive data, or injecting trace context. Anything that involves network I/O should be done outside the application.
Logging Go errors with Logrus
Logrus provides a WithError() method for attaching an error as a structured
field, which we've already covered. The more important question is which level
to use when something goes wrong:
-
Error()is the right choice for almost everything. It records the failure and lets execution continue, so the calling code can decide whether to retry, degrade, or propagate. -
Fatal()callsos.Exit(1)immediately after logging the error which skips deferred functions and any graceful shutdown logic. To prevent this, Logrus providesRegisterExitHandler()to run cleanup functions before the process terminates:go1234logrus.RegisterExitHandler(func() {db.Close()metricsFlusher.Flush()})Exit handlers run in the order they were registered, before
os.Exit(1)is called. They aren't a substitute for proper error propagation, but they're worth setting up ifFatal()appears anywhere in your application code. -
Panic()callspanic()after logging. If you use it, make sure there's a recover() in place (such as HTTP recovery middleware) so the process can log the failure and exit gracefully rather than crashing abruptly.
The most common mistake with error logging is logging the error and returning it, which causes the same failure to appear multiple times as each caller up the stack does the same:
12345678910// Avoid: logs the error, then returns it for the caller to also logfunc getUser(ctx context.Context, id string) (*User, error) {user, err := db.FindUser(ctx, id)if err != nil {logger.WithError(err).Error("failed to get user")return nil, err}return user, nil}
Instead, either handle the error and log it, or return it and let a higher layer
log it. When propagating, wrap the error with fmt.Errorf() and the %w verb
to add context at each layer without losing the original:
123456789101112131415161718func getUser(ctx context.Context, id string) (*User, error) {user, err := db.FindUser(ctx, id)if err != nil {return nil, fmt.Errorf("getting user %s: %w", id, err)}return user, nil}func handleRequest(ctx context.Context, r *http.Request) {user, err := getUser(ctx, r.URL.Query().Get("id"))if err != nil {LoggerFromContext(ctx).WithError(err).Error("request failed")http.Error(w, "internal error", 500)return}// ...}
The top-level handler is usually the best place to log because that's where you have the most context about what the operation was trying to do, and the wrapped error chain gives you the full path from the original failure upward.
Capturing stack traces
Logrus doesn't capture stack traces for error logs. If including such details are desired, you need to capture the stack at the error site using a separate library, then extract it in a hook.
The most widely used option is still pkg/errors, but it's been unmaintained since 2021. go-xerrors is a smaller, actively maintained alternative with zero dependencies that works cleanly with modern Go error handling.
It's less well-known, but its API is stable (frozen since v1.0) and it does one
thing well. If your codebase already uses pkg/errors, the hook pattern below
adapts easily to its StackTrace() interface instead.
First, create errors with stack traces at the point of failure:
123456789101112import (xerrors "github.com/mdobak/go-xerrors")func findUser(ctx context.Context, id string) (*User, error) {row := db.QueryRowContext(ctx, "SELECT ...", id)if err := row.Scan(&user); err != nil {return nil, xerrors.New("user query failed", err)}return &user, nil}
Then write a hook that extracts the stack trace and attaches it as a structured field:
1234567891011121314151617181920212223type StackTraceHook struct{}func (h *StackTraceHook) Levels() []logrus.Level {return []logrus.Level{logrus.ErrorLevel,logrus.FatalLevel,logrus.PanicLevel,}}func (h *StackTraceHook) Fire(entry *logrus.Entry) error {err, ok := entry.Data[logrus.ErrorKey].(error)if !ok {return nil}frames := xerrors.StackTrace(err)if len(frames) > 0 {entry.Data["stack_trace"] = xerrors.Sprint(err)}return nil}
Register the hook and the stack trace shows up as a field on every error-level log entry:
1logger.AddHook(&StackTraceHook{})
This yields the following outcome:
12345678910{"deployment.environment.name": "","error": "user query failed","level": "error","msg": "executing query","service.name": "order-api","service.version": "v1.2.3","stack_trace": "Error: user query failed\n\tat main.main (/home/ayo/dev/dash0/demo/logrus-demo/main.go:87)\n\tat runtime.main (/home/ayo/.local/share/mise/installs/go/1.26.3/src/runtime/proc.go:290)\n\tat runtime.goexit (/home/ayo/.local/share/mise/installs/go/1.26.3/src/runtime/asm_amd64.s:1771)\n","time": "2026-06-02T13:06:40+01:00"}
You can go further by formatting the stack trace into structured fields that can be easily parsed by your observability tool:
123456789101112131415161718192021222324func (h *StackTraceHook) Fire(entry *logrus.Entry) error {err, ok := entry.Data[logrus.ErrorKey].(error)if !ok {return nil}trace := xerrors.StackTrace(err)if len(trace) == 0 {return nil}frames := trace.Frames()formatted := make([]map[string]any, len(frames))for i, f := range frames {formatted[i] = map[string]any{"func": f.Function,"source": f.File,"line": f.Line,}}entry.Data["stack_trace"] = formattedreturn nil}
With JSONFormatter, this produces a stack_trace array where each frame is a
queryable object with func, source, and line fields, rather than a single
opaque string you'd have to parse after the fact:
1234567891011121314151617181920212223242526{"deployment.environment.name": "","error": "user query failed","level": "error","msg": "executing query","service.name": "order-api","service.version": "v1.2.3","stack_trace": [{"func": "main.main","line": 95,"source": "/home/ayo/dev/dash0/demo/logrus-demo/main.go"},{"func": "runtime.main","line": 290,"source": "/home/ayo/.local/share/mise/installs/go/1.26.3/src/runtime/proc.go"},{"func": "runtime.goexit","line": 1771,"source": "/home/ayo/.local/share/mise/installs/go/1.26.3/src/runtime/asm_amd64.s"}],"time": "2026-06-02T13:10:01+01:00"}
Bridging the standard library logger
If you're using third-party packages or standard library components that expect
a *log.Logger or io.Writer for their error output, you can bridge them into
Logrus with logger.Writer():
123456logger := logrus.New()logger.SetFormatter(&logrus.JSONFormatter{})// Bridge stdlib's log package to Logruslog.SetOutput(logger.Writer())
This returns an io.PipeWriter that routes each line through Logrus's
formatters and hooks at info level. For HTTP servers that take an ErrorLog,
the pattern is:
12345678srv := &http.Server{Addr: ":8080",ErrorLog: log.New(logger.WriterLevel(logrus.WarnLevel),"",0,),}
WriterLevel() lets you control the severity, so that HTTP server errors don't
get buried at info level alongside normal output. The writer is one end of an
io.Pipe, so remember to close it when you're done if the logger's lifetime is
shorter than the process.
Testing log output
Logrus ships a test hook in logrus/hooks/test that captures log entries in
memory instead of writing them to an output stream. This is useful for verifying
that your code logs the right message at the right level without parsing the
actual output:
123456789101112131415161718192021222324import ("testing""github.com/sirupsen/logrus""github.com/sirupsen/logrus/hooks/test""github.com/stretchr/testify/assert")func TestOrderProcessing(t *testing.T) {logger, hook := test.NewNullLogger()processOrder(logger, "ord-789")assert.Equal(t, 1, len(hook.Entries))assert.Equal(t, logrus.InfoLevel, hook.LastEntry().Level)assert.Equal(t, "order processed", hook.LastEntry().Message)assert.Equal(t,"ord-789",hook.LastEntry().Data["order_id"],)hook.Reset()assert.Nil(t, hook.LastEntry())}
The test.NewNullLogger() method returns a logger that discards all output and
a hook that stores every entry. You can inspect hook.Entries,
hook.LastEntry(), and call hook.Reset() between test cases as needed. If
you'd rather decorate an existing logger than create a new one,
test.NewLocal(logger) adds the test hook to any *logrus.Logger you pass in.
Performance is where Logrus shows its age
Logrus is the slowest of the widely used Go logging libraries, and it's not
close. For comparison, it is around 100x slower than log/slog in
benchmarks
that measure the dominant production pattern (attach request-scoped fields once,
then log many events per request).
The cause is architectural: it allocates a new Entry on every WithFields()
call, builds a map[string]interface{} to hold the fields, and formats through
encoding/json using reflection.
Newer alternatives like Zerolog and
Zap avoid this entirely
by appending directly to a byte buffer with type-specific encoders, which
eliminates both the map allocation and the reflection overhead. log/slog takes
a middle path with its Attr type and concrete slog.Value struct, avoiding
both the map and the interface boxing when you use the strongly-typed
constructors like slog.String().
For most applications the performance differences don't matter. If you're logging only a few hundred lines per second, the difference between 100 ns and 10000 ns per log call is a rounding error in your overall latency budget.
Where it starts to hurt is high-throughput services that emit thousands of log entries per second under load, particularly in hot paths like request middleware or message consumers. At that scale the allocations add GC pressure and the formatting time becomes visible in profiles.
If performance is a concern for your workload, this is one of the stronger reasons to migrate away from Logrus. Our Go logging library comparison has the full details across all the major libraries in the ecosystem.
Sending Logrus logs to an observability backend
Logrus logs are most useful when they're centralized alongside your traces and metrics rather than sitting in local files.
While Logrus predates OpenTelemetry, it now has an official OpenTelemetry bridge at otellogrus.
It's implemented as a Logrus hook that converts logrus.Entry records into
OpenTelemetry log.Record objects, mapping timestamps, severity levels, message
bodies, and fields to their OTel equivalents. The records then flow through the
OTel Logs SDK and can be exported over OTLP to any compatible backend.
Another approach is writing JSON to stdout or a file and routing it through
the
OpenTelemetry Collector
using the most appropriate receiver for your environment such as the
filelog receiver,
which parses the JSON and forwards it as OTLP log records to any compatible
backend.
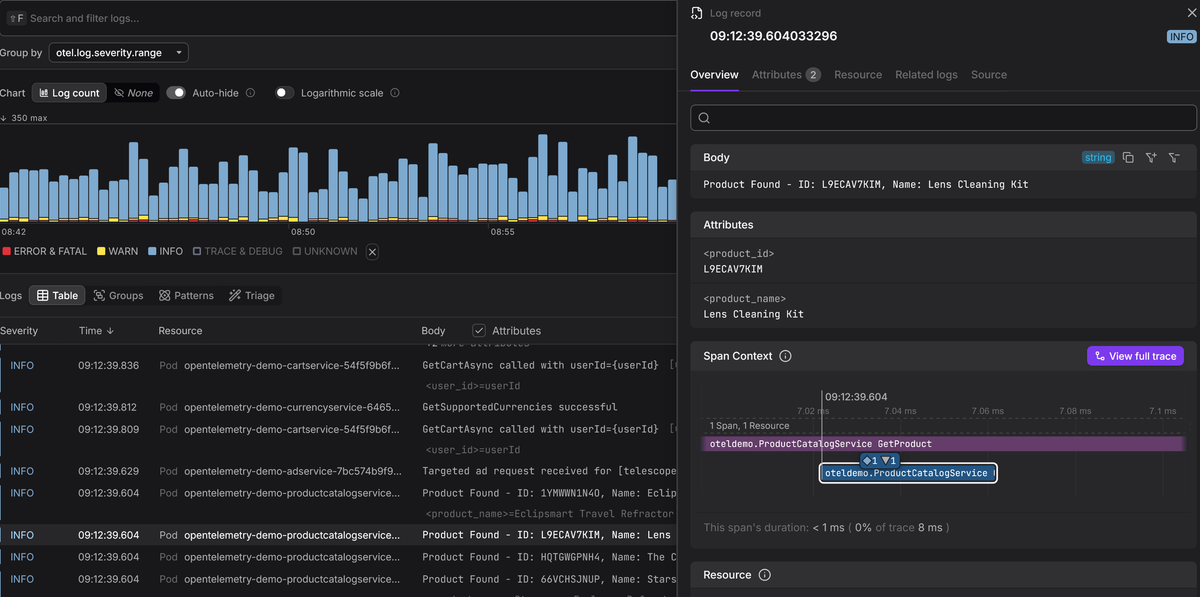
Once your logs are flowing over OTLP, an OpenTelemetry-native backend like Dash0 can correlate them with your traces and metrics in a single view, so you can jump from a log entry to the trace that produced it without switching tools.
Final thoughts
Logrus earned its place in the Go ecosystem by making structured logging the default at a time when the standard library had nothing to offer.
For new projects, log/slog covers the same ground with no external dependency,
far better performance, and native OpenTelemetry support through the
otelslog bridge.
Our Go logging library comparison has the full breakdown if you're evaluating options, and our Logrus to slog migration guide covers the transition for existing codebases.
