Last updated: April 17, 2026
Infrastructure Monitoring with OpenTelemetry Host Metrics
When you're monitoring infrastructure with OpenTelemetry, the
Host Metrics Receiver
(hostmetrics) is one of the most relevant components to reach for.
It fully replaces traditional agents (like Prometheus Node Exporter), and collects essential system metrics such as CPU, memory, disk, and network usage directly from the machine where the Collector is running.
Because this receiver needs direct access to the underlying system, it's intended to be used when the Collector is deployed as an Agent. For example, as a DaemonSet on Kubernetes nodes or as a service on a VM or bare-metal host, not as a centralized gateway.
In this guide, you'll learn how to configure it as a Node Exporter alternative for monitoring your server infrastructure.
Quick start: collecting host metrics
To see it in action, let's spin up a Docker Compose setup that uses the OpenTelemetry Collector to scrape your host's vitals and send that data directly to Prometheus.
First, create a docker-compose.yaml to orchestrate the services:
12345678910111213141516171819202122232425262728293031# docker-compose.yamlservices:otelcol:image: otel/opentelemetry-collector-contrib:0.140.0container_name: otelcolvolumes:- ./otelcol.yaml:/etc/otelcol-contrib/config.yaml- /:/hostfs:rorestart: unless-stoppeddepends_on:- prometheusprometheus:image: prom/prometheus:v3.7.3container_name: prometheusrestart: unless-stoppedvolumes:- ./prometheus.yml:/etc/prometheus/prometheus.yml- prometheus_data:/prometheuscommand:- --config.file=/etc/prometheus/prometheus.yml- --storage.tsdb.path=/prometheus- --storage.tsdb.retention.time=15d- --web.enable-lifecycle# Enable Prometheus to accept OTLP writes directly- --web.enable-otlp-receiverports:- 9090:9090volumes:prometheus_data:
There are two key details here:
-
You must mount the host's root directory (
/)to/hostfsinside the container. Without this, the Collector would only see the statistics of its own tiny container, not your actual server. -
The
--web.enable-otlp-receiverflag enables Prometheus to expose an OTLP endpoint, allowing the Collector to send data to it over standard HTTP.
Next, create the otelcol.yaml configuration file that enables the
hostmetrics receiver:
123456789101112131415161718192021222324252627282930# otelcol.yamlreceivers:hostmetrics:# Tell the scrapers to look at the mounted volume, not the container's /root_path: /hostfscollection_interval: 1m # Default is 1m, adjust based on resolution needsscrapers:cpu:memory:load:network:disk:filesystem:processors:batch:exporters:otlphttp/prometheus:# Push metrics to Prometheus's OTLP receivermetrics_endpoint: http://prometheus:9090/api/v1/otlp/v1/metricstls:insecure: trueservice:pipelines:metrics:receivers: [hostmetrics]processors: [batch]exporters: [otlphttp/prometheus]
The most important setting here is root_path: /hostfs. It explicitly tells the
hostmetrics receiver to read metrics from the host filesystem mounted in the
previous step, instead of the container's own filesystem.
Finally, create a minimal prometheus.yml to prevent Prometheus from scraping
any other targets, including itself:
123# prometheus.ymlglobal:scrape_interval: 10s
With no scrape configurations defined, Prometheus starts normally but does not collect its own metrics.
Now, run the command below to launch the services:
1docker compose up -d
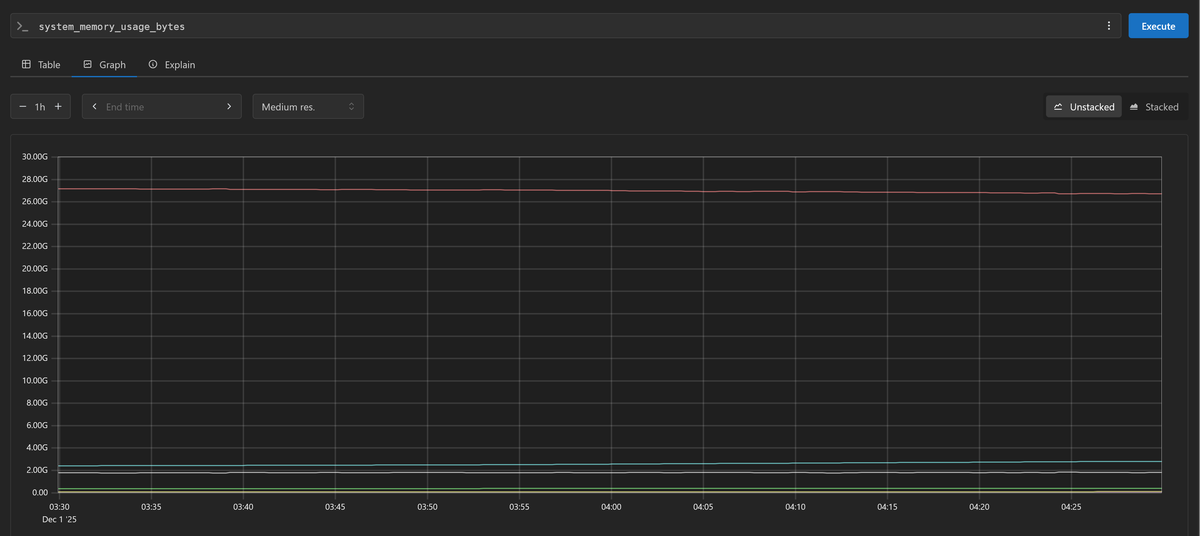
After a minute, navigate to http://localhost:9090 in your browser. You should
see metrics like system_cpu_time_seconds_total and system_memory_usage_bytes
flowing in from your host.
Understanding the host metrics scrapers
The hostmetrics receiver only acts as a scheduler that coordinates when
metrics are collected. The actual work is handled by
scrapers,
which are modular plugins that you enable individually in the scrapers section
of your configuration.
If you're coming from the Prometheus ecosystem, these scrapers are roughly equivalent to Node Exporter collectors.
They emit metrics that generally follow OpenTelemetry Semantic Conventions, which can look quite different from the metric names and labels you're used to in Prometheus.
The table below shows how the most commonly used scrapers map to the Node Exporter collectors you may already be familiar with:
| OTel Scraper | Metric Name | Node Exporter Equivalent |
|---|---|---|
| cpu | system.cpu.* | node_cpu_* |
| memory | system.memory.* | node_memory_* |
| load | system.cpu.load_average.1m | node_load1 |
| filesystem | system.filesystem.* | node_filesystem_* |
| disk | system.disk.* | node_disk_* |
| network | system.network.* | node_network_* |
While this covers the most commonly used scrapers, there are a few details worth noting:
-
The default
memoryscraper only reports physical RAM usage. If you're investigating performance issues related to memory pressure, you'll also need to enable thepagingscraper to see swap usage and page faults. -
Pay close attention to the difference between the
processes(plural) andprocess(singular) scrapers:processesis lightweight, as it simply counts the number of running or blocked processes on the host.processis expensive, as it collects detailed CPU and memory metrics for every executable on the system. Enabling it without a strict allowlist is one of the fastest ways to blow up your metric cardinality.
-
The
filesystemanddiskscrapers are easy to confuse. The former measures free space and tells you when the disk is full, while the latter measures IOPS and throughput to help you debug slow I/O performance. In practice, you'll usually need both.
Configuring scrapers
In production environments, you need to be intentional about what each scraper collects to avoid flooding your backend with low-value or redundant data.
The most basic and important tuning lever is controlling which metric data points are emitted. Every scraper defines a set of default metrics, which are enabled out of the box, and optional metrics, which remain disabled unless you explicitly turn them on.
You control this behavior through the metrics block in the scraper's
configuration:
12345678910111213141516# otelcol.yamlreceivers:hostmetrics:scrapers:cpu:metrics:system.cpu.utilization:enabled: truememory:metrics:system.memory.utilization:enabled: truefilesystem:metrics:system.filesystem.utilization:enabled: true
Reducing noise with filters
Some of the more resource-intensive scrapers like disk, filesystem,
network, and process, support include and exclude rules to limit data
collection to what actually matters. These filters help you avoid collecting
metrics from irrelevant devices or especially noisy interfaces.
Filtering rules can be defined using exact string matches (strict) or regular
expressions (regexp), depending on how much flexibility you need.
For example, to prevent the Network scraper from generating data for local loopback or Docker bridge interfaces, you can exclude them by name:
12345678# otelcol.yamlreceivers:hostmetrics:scrapers:network:exclude:interfaces: ["lo", "docker0"]match_type: strict
The filesystem scraper is another common source of noise, especially on
systems with many virtual or container-related mounts. In most cases, you'll
want to exclude filesystems like tmpfs or overlay:
12345678# otelcol.yamlfilesystem:exclude_fs_types:fs_types: ["tmpfs", "autofs", "overlay"]match_type: strictexclude_mount_points:mount_points: ["/var/lib/docker/*"]match_type: regexp
This kind of filtering keeps your metrics focused, reduces cardinality, and lowers ingestion and storage costs without sacrificing visibility into the parts of the system that matter.
Optimizing metric collection intervals
Not all metrics need to be collected at the same frequency. Highly volatile resources like CPU and memory benefit from high-resolution sampling to capture short-lived spikes, while slower-moving signals such as filesystem usage can be polled far less often without losing useful context.
To support this, you can define named instances of the hostmetrics
receiver, each with its own collection_interval and a tailored set of
scrapers. This lets you balance visibility against overhead more precisely:
1234567891011121314151617181920receivers:# High-resolution scraping for volatile metricshostmetrics/fast:collection_interval: 10sscrapers:cpu:memory:# Lower-resolution scraping for stable metricshostmetrics/slow:collection_interval: 1mscrapers:filesystem:disk:service:pipelines:metrics:# Both instances feed into the same pipelinereceivers: [hostmetrics/fast, hostmetrics/slow]
Note that if you run multiple hostmetrics receiver instances in the same
Collector pipeline, they must all use the same root_path setting to ensure
they read from the same host filesystem.
Silencing permission errors
The process scraper is especially sensitive to permissions because it attempts
to read detailed information for every process on the system, including those
owned by root or other users. In restricted container environments, this often
results in a steady stream of "permission denied" log messages.
You can suppress these specific errors without losing visibility into the processes the Collector is actually allowed to inspect:
123process:mute_process_user_error: true # Mute "user does not exist" errorsmute_process_io_error: true # Mute "permission denied" on I/O stats
The missing link: resource attributes
One of the biggest gotchas with the hostmetrics receiver is that it emits
effectively "naked" metrics. Out of the box, it does not attach essential
resource metadata
such as host.name, service.namespace, or cloud.region to the telemetry it
produces.
Without these attributes, your backend receives a stream of CPU, memory, and disk metrics with no reliable way to tell which host, environment, or service they came from. The fix is to enrich the data before it leaves the Collector.
Processors like resourcedetection and k8sattributes can automatically query the underlying platform and cloud APIs to discover and attach the correct metadata at runtime.
123456# otelcol.yamlprocessors:resourcedetection/docker:detectors: [env, docker]timeout: 2soverride: false
1234567891011# docker-compose.ymlservices:otelcol:image: otel/opentelemetry-collector-contrib:0.140.0container_name: otelcolvolumes:# the `docker` detector requires the Docker socket to be mounted- /var/run/docker.sock:/var/run/docker.sock# the `env` detector reads from OTEL_RESOURCE_ATTRIBUTESenvironment:- OTEL_RESOURCE_ATTRIBUTES=service.name=host-metrics-demo,service.version=1.0.0,deployment.environment.name=production
In your prometheus.yml, you'll want to promote key resource attributes to
metric labels so they can be used for querying, grouping, and filtering:
12345# prometheus.ymlotlp:promote_resource_attributes:- service.name- host.name
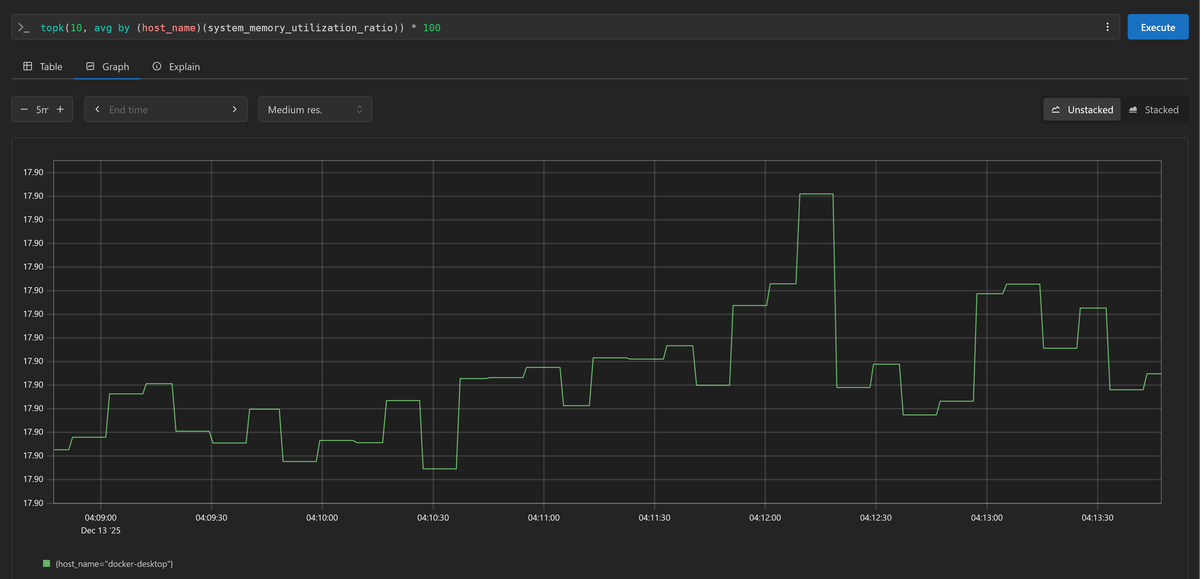
By default, Prometheus
translates promoted OTLP attribute names
into its traditional label format, which means host.name becomes host_name
as shown below:
For a deeper dive into managing and standardizing these attributes, see our resource processor guide.
Visualizing and alerting on host metrics
Once host metrics are flowing to your observability backend, you'll need to turn the raw time series into dashboards and alerts that help you spot problems before users do.
Since the hostmetrics receiver follows
OpenTelemetry semantic conventions,
the metrics map cleanly to the same concepts you're already used to from Node
Exporter. The difference is mostly naming, not intent.
One straightforward way to build dashboards atop these metrics is with Perses, a CNCF-backed dashboard system designed to work well with a wide variety of data sources (including Prometheus).
One of Perses' biggest strengths is Dashboards-as-Code. Instead of clicking through a UI to build panels (which is hard to version control), you can define your views and panels through Go or CUE.
While we won't use that model in this guide, it's a powerful shift away from manually maintained, click-built dashboards.
Running Perses locally
To see Perses in action, add the following service to your docker-compose.yaml
file:
123456789101112# docker-compose.yamlservices:# [...]perses:image: persesdev/perses:latestcontainer_name: persesrestart: unless-stoppedports:- 8080:8080depends_on:- prometheus
Start Perses with:
1docker compose up -d perses
Then open http://localhost:8080 in your browser to access the Perses UI.
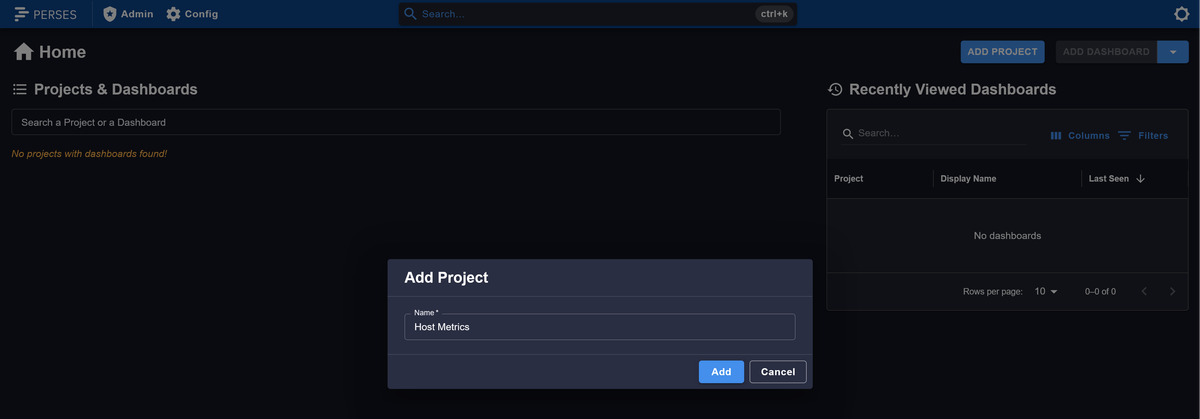
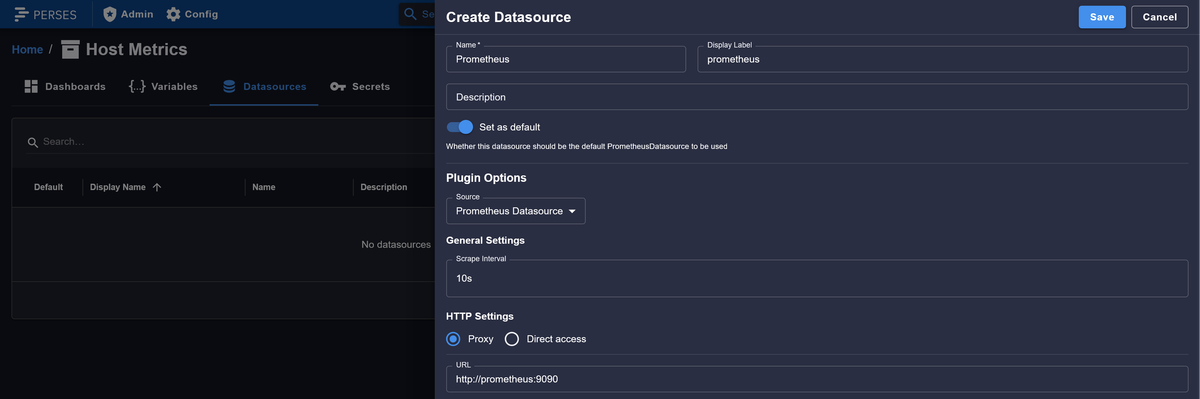
Click the ADD PROJECT button to add a new Project, then switch to the Datasources tab on the resulting page to add a new data source.
Configure it to point at your running Prometheus instance, then click SAVE:
Creating your first dashboard
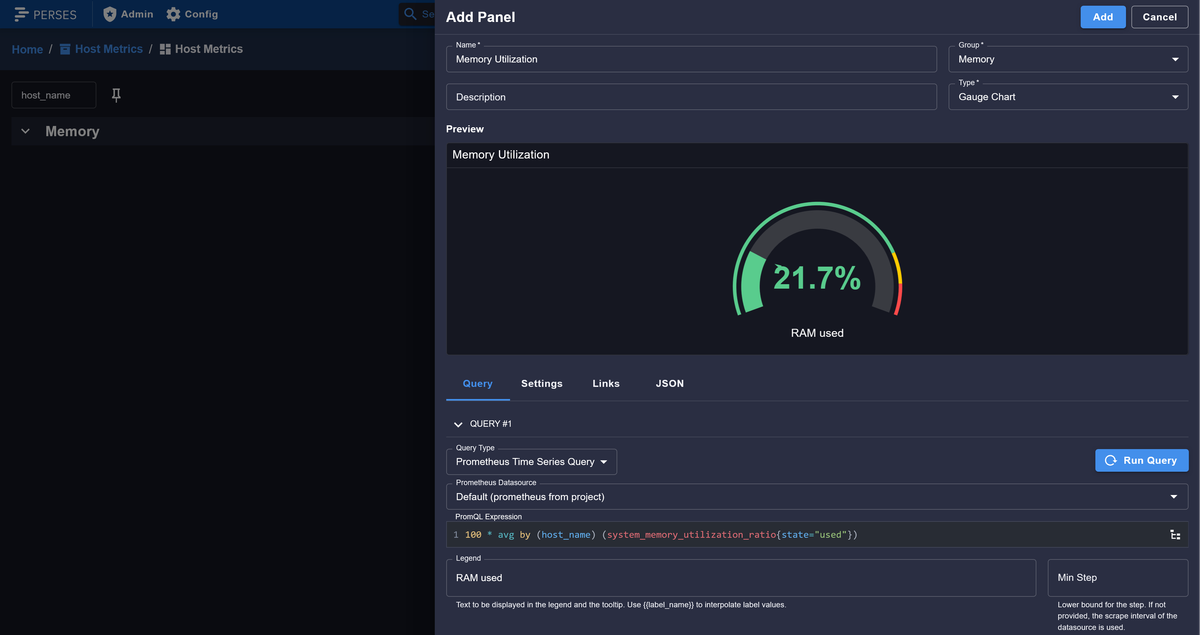
Return to the Dashboards tab and click ADD DASHBOARD. After naming the dashboard, you can begin adding panels.
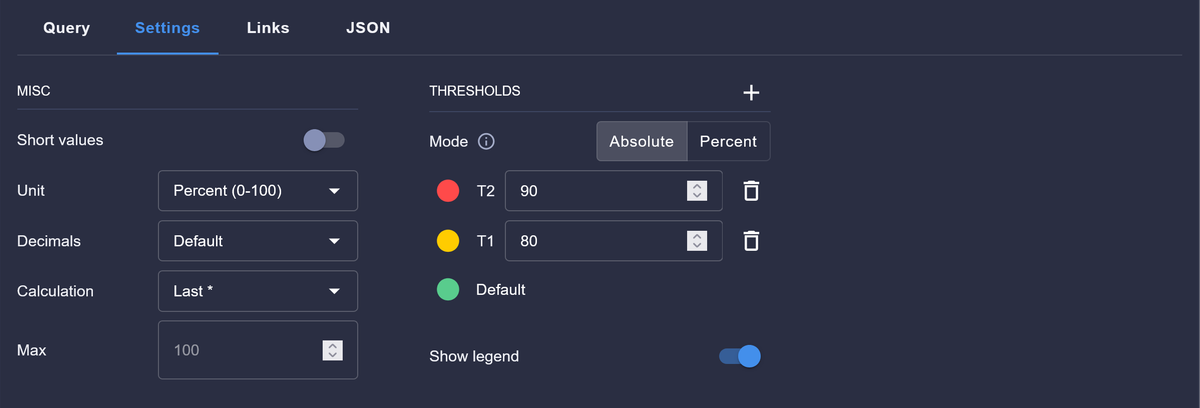
As a simple starting point, create a panel that shows memory utilization for your host and apply thresholds to make it obvious when the system is under pressure.
1100 * avg by (host_name) (system_memory_utilization_ratio{state="used"})
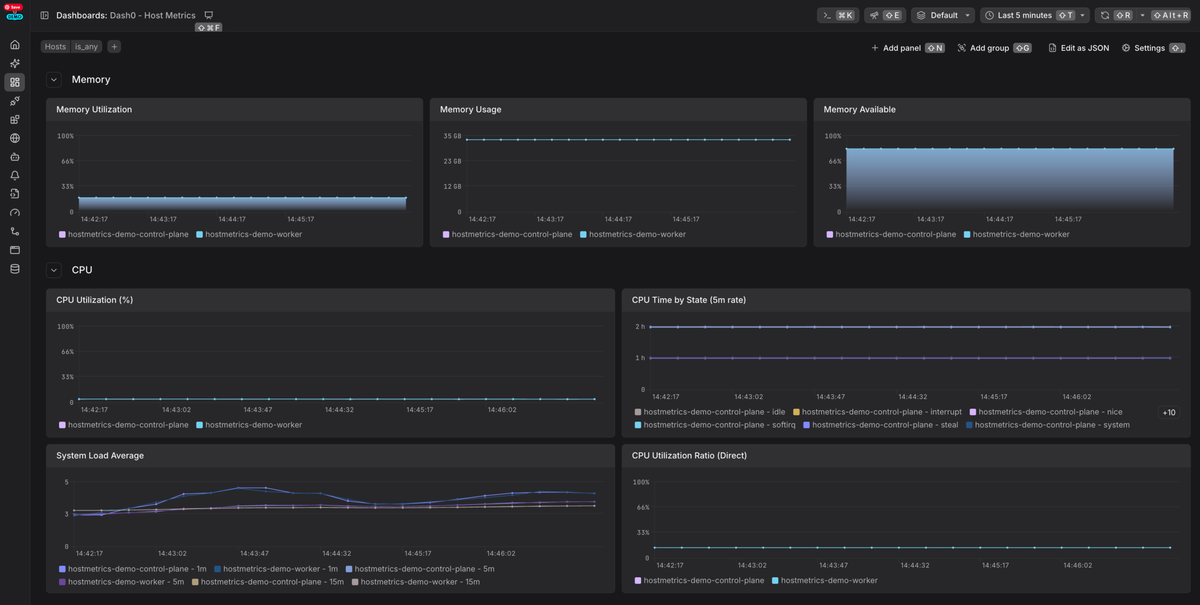
Once your first panel is in place, you can continue adding panels to cover other key resources. At a minimum, a useful host-level dashboard should let you answer these questions at a glance:
- Is this machine CPU-bound?
- Is it under memory pressure?
- Is disk space running out?
- Is disk, network, or I/O throughput becoming a bottleneck?
If you've used Node Exporter dashboards in the past, most of them can be adapted with minimal effort by translating metric names and labels to their OpenTelemetry equivalents.
Alerting on infrastructure symptoms
A good infrastructure alert signals a real risk to system health, fires early enough for someone to respond, and includes enough context to guide the next step in investigation.
Some of the most effective triggers include:
- Sustained high CPU utilization over a meaningful window
- Memory usage approaching exhaustion or increasing swap activity
- Filesystems exceeding safe utilization thresholds
- Disk I/O latency or queue depth increasing sharply
- Network error rates or dropped packets
What you generally want to avoid are alerts on brief spikes or single data points. Infrastructure metrics naturally exhibit high short-term variability, so alerts should be based on sustained conditions and reasonable aggregation windows.
From infrastructure symptoms to finding the root cause
Infrastructure metrics are most effective when they aren't viewed in isolation. To find the root cause of an issue, they must be correlated with other signals such as traces and logs.
A CPU saturation alert becomes actionable only when you can immediately answer:
- Which services are running on this host?
- Which request, batch job, or background task triggered the spike?
- Did this coincide with a deployment, a traffic surge, or a downstream failure?
At Dash0, this correlation is the default. Because the platform is OpenTelemetry-native, host metrics collected via OTLP are automatically linked to service-level traces and logs using shared resources, attribute context, and exemplars.
Dash0 is also compatible with Perses dashboards and uses PromQL across metrics, logs, and traces, which means you can:
- Send native OTLP data without translation layers
- Directly import and export Perses dashboards as JSON
- Pivot from an infrastructure symptom to the exact trace or log line involved, using the same query language and mental model
This approach eliminates vendor lock-in since your telemetry, dashboards, and queries remain portable OpenTelemetry, Perses, and PromQL artifacts that can be reused outside Dash0 or integrated with other tools as your stack evolves.
The result is a significantly shorter path from "this host looks unhealthy" to "here's the culprit", without the need to switch tools or guess at relationships.
Final thoughts
The Host Metrics receiver is one of the core building blocks of an infrastructure monitoring setup with OpenTelemetry, as it provides the baseline visibility every system relies on.
But metrics alone only tell part of the story. The payoff comes from being able to instantly correlate a spike in CPU usage with the specific service, trace, or database query causing it.
If you'd like to see what that looks like in practice, consider signing up for a free Dash0 trial.
