Last updated: November 27, 2025
9 Logging Best Practices You Should Know
We continue to build increasingly complex, distributed systems, yet we often
diagnose them with little more than glorified printf statements. While the
practice of logging has been with us since the earliest days of computing, too
many teams still treat it as an afterthought.
The consequences are all too familiar: the shocking cloud bill for debug logs that were never removed, the afternoon wasted trying to make sense of logs that say everything and nothing at the same time, and the thankless task of manually correlating events across services when your tools should have done it for you.
This guide is about fixing that. Logs aren't the whole observability story, but they can be transformed from unstructured strings scattered through a codebase into useful signals that drive real insight. The following checklist of best practices will help you do just that.
Let's begin!
1. Start with structured logging
Unstructured, string-formatted logs are an anti-pattern in modern systems. If
you're still writing logs designed to be read by someone running grep on a
server, you're not just behind the times, you're actively building an
un-observable system.
Logs are data and must be treated as such from the moment of creation. This means every log entry must be a structured, machine-parsable object (JSON is the lingua-franca here). Every piece of information becomes a distinct key-value pair, ready to be indexed, queried, and aggregated.
Instead of emitting a blob of text like this:
1[2025-07-24 07:45:10] INFO: Payment processed for user 12345 in 54ms. Request ID: abc-xyz-789
You'd output a queryable data record:
123456789{"level": "info","timestamp": "2025-07-24T06:45:10.123Z","message": "payment processed","service": "billing-api","duration_ms": 54,"user_id": "12345","trace_id": "abc-xyz-789"}
This fundamentally changes how you interact with your logs, moving you from clumsy regex-based text search to a more powerful, query-based analysis.
This makes it trivial to answer questions like: "How many payment operations
failed in the last hour?" or "Show me all logs tied to request abc-xyz-789",
or even "Which logs are associated with user 12345 today?" with a simple fast
query.
Most modern logging frameworks now support or default to emitting structured output out of the box, and languages are starting to treat it as a core feature rather than an optional add-on (see Go's log/slog package).
2. Establish an observability contract with OpenTelemetry
Adopting structured logging is just the first step. Without a shared standard, you're still left with the chaos of inconsistent names and semantics across services.
One service might log a user ID as "user_id": "12345", another as
"userId": "12345", and yet another as "customer": { "id": "12345" }.
Multiply that inconsistency across dozens of services, and the result is that
observability becomes nearly impossible since everyone is speaking a different
language.
To fix this, you need to establish an observability contract: a single, enforced schema for telemetry across all your services. This is where OpenTelemetry (OTel) becomes your foundation, providing a common structure (the log data model) and a common vocabulary (semantic conventions).
The good news is that you don't have to rip out your existing instrumentation. OpenTelemetry provides two clear paths (or "bridges") for bringing your logs into compliance.
For applications you control, you can integrate OTel directly with your existing logging library through an appender (or exporter). This component intercepts structured logs from your library, translates them to the OTel model in memory, and sends them directly to a collector or backend.
For legacy or third-party systems you can't change, let them continue writing to
stdout or local files and have the
OTel Collector ingest
and transform them into the OTel model before forwarding them.
Finally, a contract is useless without enforcement. Use tools like the OpenTelemetry weaver to document and enforce a core schema of attributes that are mandatory for every service.
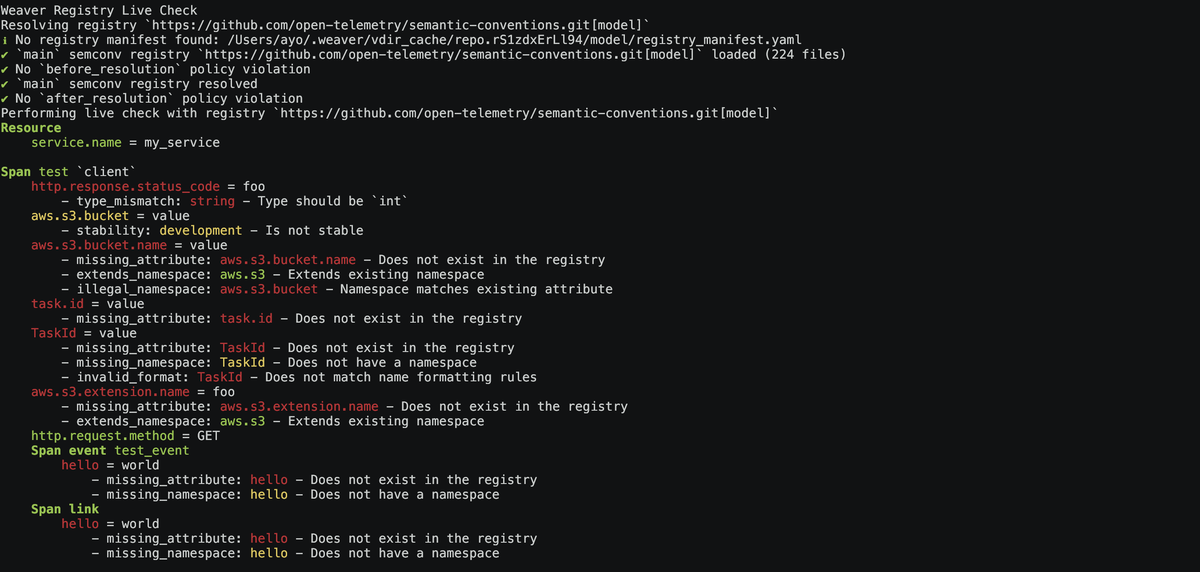
Then back it up with automation in your CI/CD pipeline so that builds that introduces unapproved attributes or omits required ones are automatically failed, making compliance a baked-in part of your engineering standard.
3. Enrich your logs with sufficient context
With the contract in place, you must ensure that every log is enriched with enough context to be useful on its own. A log message without context is just noise. Every log should be able to answer critical questions about its origin, scope, and intent.
You can think of context in two layers:
The platform context
This is the environmental and request-level context that should be attached to every single log automatically with zero developer effort. This tells you where the log came from, and what it is related to.
This is where your platform engineering shines, and OpenTelemetry provides the tools to make this automation seamless:
-
The OTel SDK automatically injects
trace_idandspan_id, linking logs to the specific request that generated them. -
The OTel Collector can automatically detect and attach metadata from the host environment, such as
cloud.provider,cloud.region,k8s.pod.name, andservice.versionusing processors like the resourcedetectionprocessor and k8sattributesprocessor.
This layer is your foundation. It ensures that even the most basic log can be traced back to a specific request and service instance, in a specific region, running a specific version.
The event context
This is the business-level context that only your application code knows. It's the most valuable information for debugging and the hardest to get right. Examples include entity identifiers and other domain-specific attributes that explain what action was attempted and why.
You shouldn't rely on manual effort alone here. Instead, establish a pattern where a context-aware logger (available in most logging frameworks) is injected into the request lifecycle.
With this pattern, once relevant identifiers are known during request handling, they automatically flow to every downstream log line without extra effort on your part.
By layering automated platform context with systematically-injected event-level context, you'll create logs that are "born correlated", turning them from isolated messages to a rich, connected narrative of system behavior.
The OWASP logging cheat sheet provides a solid reference for useful event attributes. Just be sure to align with OTel's semantic conventions when naming them so your logs remain consistent and interoperable.
4. Use log levels as an actionable signal
Few topics in logging generate as much debate as the proper use of severity levels.
Some argue for simplicity:
just use INFO and ERROR
to express that your system is either doing what it's supposed to or it isn't.
That approach may look clean on paper, but it removes too much nuance in practice. Not every anomaly is a failure, and not every failure requires paging someone. By reducing the vocabulary, you collapse important distinctions and lose the ability to separate actionable signals from supporting detail.
Adopting more granular levels like DEBUG, WARN or FATAL is far more
effective. They encode meaningful distinctions: a WARN typically highlights
something unusual and actionable but not urgent (like deprecation warnings),
ERROR flags an actual failure, FATAL signals an unrecoverable condition that
leads a process to terminate, and DEBUG captures detail for investigations
without polluting production by default.
To use them well, a few principles apply:
-
To avoid the "boy who cried wolf" scenario, log levels should reflect severity and actionability. If no human needs to take action, it shouldn't be logged at a level that triggers an alert.
-
The hardest part of logging is dialing verbosity to the right level. Too much, and you balloon costs, slow down systems, and bury engineers in noise; too little, and there's nothing useful to debug with. Verbose logs have their place, but they should be scoped, short-lived, and never treated as the default.
-
Ensure log verbosity can be adjusted on the fly, whether for a service, a module, or even a specific user, without redeploying. This helps you generate just the right amount of detail when investigating live incidents.
Log levels aren't the main value of a log, but they're a powerful signal when used consistently. They help you separate the routine from the exceptional and surface low-level details only when it's needed most. Dropping down to just two levels throws away that signal for no good reason.
5. Keep sensitive data out of your logs
One of the biggest risks in logging is the accidental inclusion of Personally Identifiable Information (PII) or other sensitive data. Of all the mistakes you can make, this is the one most likely to land your company on the front page for the wrong reasons.
High-profile slip-ups from Twitter and GitHub where plaintext passwords were accidentally written to internal logs, serve as stark reminders of how serious and easy-to-make this mistake can be.
Such leaks rarely happen with malicious intent. They happen because a developer, focused on their immediate task, is unaware of the downstream security implications of their logging choices.
The only effective defense is systemic and multi-layered. You have to assume mistakes will happen and design safeguards that catch them at multiple points.
At the application level, avoid logging entire objects that may contain sensitive fields. Instead, implement logging-safe representations that exclude or mask PII by default. This means that new attributes on the object may need to be allowlisted before they are logged.
123456789101112131415// User is a domain object that may contain sensitive fields.type User struct {ID stringEmail stringPassword stringCreatedAt time.Time}func (u User) LogValue() slog.Value {// Only allowlist the fields considered safe to log.return slog.GroupValue(slog.String("id", u.ID),slog.Time("created_at", u.CreatedAt),)}
For ad-hoc structures, most logging frameworks allow you to configure a "middleware" to automatically mask or scrub data from known sensitive fields whose key matches a blocklist before the log is written.
Finally, apply sensitive-data scrubbing in the OpenTelemetry Collector (or equivalent) to prevent anything from slipping through before logs leave your systems.
123456789101112131415# One of the most effective techniques is using an attribute allowlistprocessors:redaction/allowlist:allow_all_keys: falseallowed_keys:- http.method- http.url- http.status_codeservice:pipelines:logs:receivers: [...]processors: [attributes/allowlist, ...]exporters: [...]
Sensitive data logging mistakes are easy to make, but with layered defenses you can drastically reduce their impact. The most effective solutions are not those that blame individuals, but those that foster a culture of shared ownership over the quality and security of observability data.
6. Treat logging performance as a first-class concern
It's sometimes easy to forget that logging isn't free. Every log line consumes CPU, memory, and I/O. At small scale you'll barely notice, but at scale, it can become a real bottleneck.
To prevent logging from slowing down your services, adopt the following practices.
Choose performant libraries
Logging libraries vary widely in performance. Start by choosing modern,
efficient libraries that are designed to minimize overhead. For example, in the
Go ecosystem, the built-in log/slog or libraries like
Zerolog and
Zap are
orders of magnitude faster than
older options like Logrus.
Log asynchronously
Don't let your main application thread wait for a log to be written to disk or the network. Instead, log asynchronously by writing messages to a fast, in-memory buffer and letting a separate background process handle the slower I/O operations so that logging has virtually no impact on request latency.
Be mindful of hot paths
Avoid placing verbose log statements inside high-frequency loops or critical code paths. For diagnostics in these areas, use intelligent sampling or rate-limiting to gather insights without overwhelming the system with a flood of logs.
Defer expensive operations
A more subtle performance issue lies in how logging arguments are evaluated. For
example, a log statement like logger.debug(f"Processing {x}") in
Python evaluates the formatted
string even if the DEBUG level is disabled.
The better pattern, logger.debug("Processing %s", x), defers the string
formatting until it's certain the message will be emitted, saving precious
cycles in critical code.
The bottom line is to treat logging code like your business logic. If you wouldn't block a request or allocate unnecessary memory in a critical path, don't let your logging library do it either.
7. Manage log volume and cost intelligently
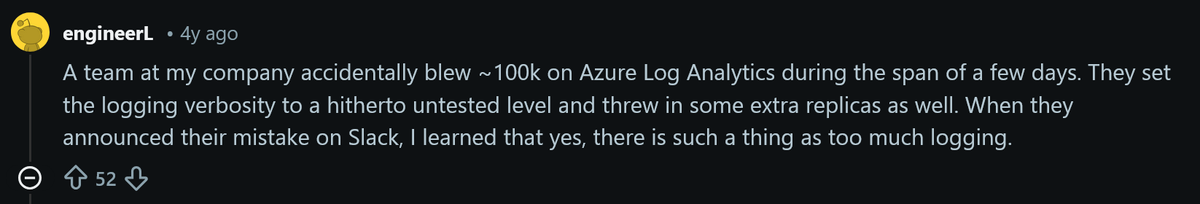
One of the quickest ways to burn money, overwhelm your systems, and blind your engineers is to let log volume grow unchecked. At scale, ingestion and storage can run into millions per year, while noisy streams bury the very signals you need during incidents.
The answer isn't to stop logging, but to log smarter. The best place to start is at the source by cutting high-volume, low-value logs. A classic example is successful health checks from a load balancer. Those are far more useful as a metric than as endless log lines that add little value.
For even more control, some logging frameworks allow you to log continuously to an in-memory ring buffer. Under normal conditions the buffer just overwrites itself, so nothing ever leaves memory. But if the system hits an error, the buffer is dumped along with the error log to ensure that the context from the moments leading up to the failure is preserved. It keeps volume low in the happy path while still capturing rich detail when it matters most.
Another effective technique is sampling. It's rarely necessary to keep every single log, especially for routine events. You might capture all failed requests but only one out of every hundred successful ones and still get a representative view.
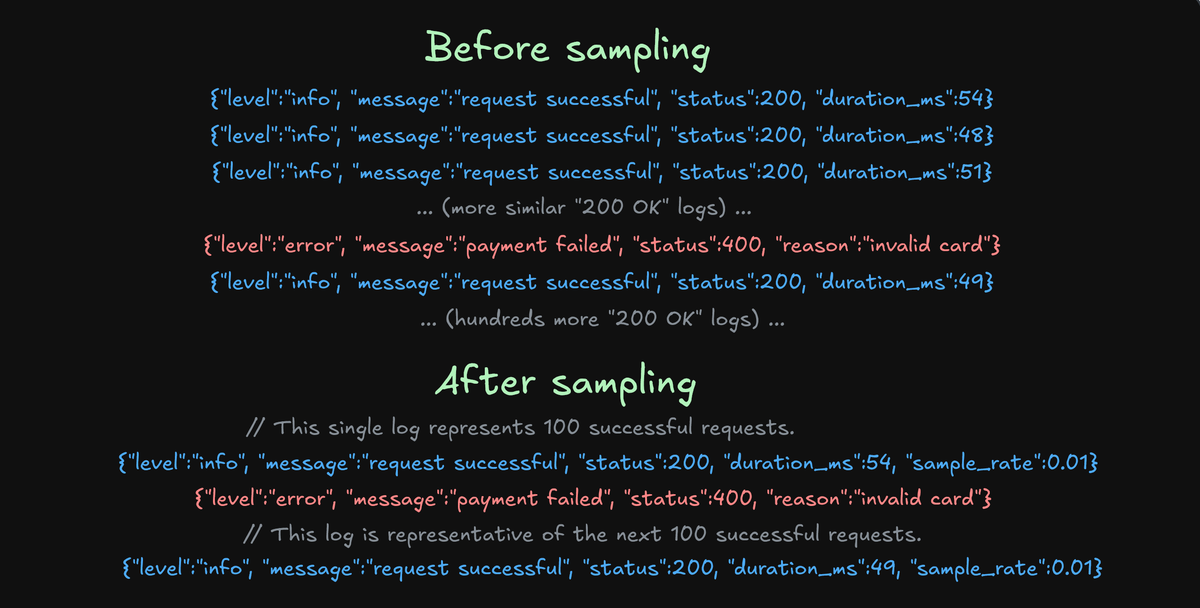
Sampling also helps during cascading failures: when a service starts spewing the same error on repeat, you don't need a million identical entries. A handful of representative samples tells the story just as well without overwhelming your system or ballooning your costs.
One caveat is that OpenTelemetry doesn't yet support log sampling natively. Its sampling strategies apply only to traces, so you'll need to implement log sampling through your framework or observability pipeline.
8. Make the OpenTelemetry Collector the linchpin of your pipeline
Shipping telemetry directly from your application to a backend works for small systems, but it doesn't scale. It leads to tight vendor coupling, performance bottlenecks, high possibility of data loss, and other operational headaches as you grow.
A better architecture is to put the OpenTelemetry Collector at the center of your observability pipeline. The Collector is a performant, vendor-neutral service that can ingest all your telemetry data, process them, and then route them to any number of backends.
It gives you a single place to enforce standards, redact sensitive fields, normalize formats, filter out noisy streams, or attach environment metadata automatically.
And since it handles logs, metrics, and traces together, it can outright replace log-only agents like Fluent Bit, Logstash, or Filebeat at the edge, giving you a unified pipeline instead of a patchwork of single-purpose shippers.
The payoff is flexibility. Want to send security events to one backend and
application logs to another? Drop DEBUG logs in production but keep them in
staging? Insert new Kubernetes metadata without developer involvement? With the
Collector as the linchpin, all of these become configuration changes instead of
engineering projects.
9. Choose an OpenTelemetry-native backend
You've done the hard work. You've implemented structured logging, established a schema with OpenTelemetry, enriched your logs with deep context, and built a robust pipeline with the Collector. The final step is to ensure your observability platform can capitalize on this investment.
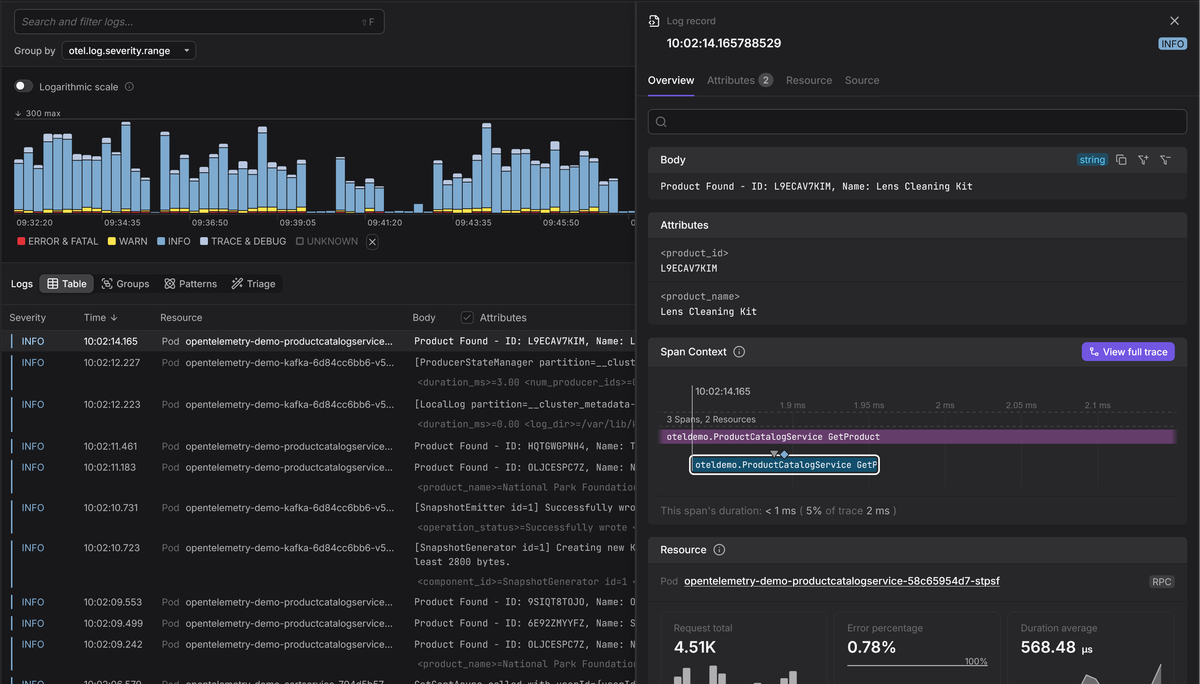
This is where choosing an OpenTelemetry-native platform becomes critical. An OTel-native platform isn't just a backend that can accept OTLP data; its one whose entire data model is built around the OpenTelemetry standard.
This means it inherently understands the intrinsic relationships between your signals and treats semantic conventions as first-class citizens, not just another set of tags.
It knows that db.query.text isn't just a string but database query, and can
parse the statement to identify the operation, highlight slow queries and
provide pre-built dashboards for database performance. These are the principles
Dash0 is built on.
By pairing your high-quality instrumentation with a platform that speaks the same native language, you ensure the payoff for all your effort is not just better data, but faster debugging, clearer insights, and more reliable systems.
Final thoughts
When done well, logging shifts from being a costly liability to a force multiplier for cutting incident response times, reducing operational overhead, and making your systems more reliable.
The next time something breaks in production (and it will) the quality of your logs will determine whether you're guessing in the dark or diagnosing with confidence.
Thanks for reading!
