Last updated: May 5, 2026
Mastering the OpenTelemetry OTLP HTTP Exporter
The OpenTelemetry Collector sits at the center of most modern observability pipelines and the OTLP HTTP exporter is one of the simplest and most interoperable ways to move telemetry data from your pipeline to the outside world.
It uses plain HTTP rather than gRPC, making it easier to integrate across a wide range of backends and environments—especially where proxies, firewalls, or strict network policies make gRPC less practical.
This guide explores the configuration of the OTLP HTTP exporter in detail, starting from the essentials and progressing to advanced tuning for security, reliability, and performance.
By the end, you’ll know how to configure the OTLP HTTP exporter confidently for both simple local agents and large-scale production pipelines.
Quick start: sending traces to Jaeger over HTTP
Like the gRPC exporter, the otlp_http exporter primarily needs two things:
where to send the data (endpoint) and how to secure the connection
(tls).
Here's a minimal working example using Docker Compose. This setup includes:
- telemetrygen for generating test traces.
- The OpenTelemetry Collector configured with an OTLP/HTTP exporter instance.
- A Jaeger instance for visualization.
Create the Docker Compose configuration first:
12345678910111213141516# docker-compose.ymlservices:otelcol:image: otel/opentelemetry-collector-contrib:0.144.0volumes:- ./otelcol.yaml:/etc/otelcol-contrib/config.yamljaeger:image: jaegertracing/jaeger:2.14.1container_name: jaegerports:- 16686:16686telemetrygen:image: ghcr.io/open-telemetry/opentelemetry-collector-contrib/telemetrygen:v0.144.0command: ["traces", "--otlp-insecure", "--otlp-http", "--otlp-endpoint", "otelcol:4318", "--rate", "10", "--duration", "1h"]
Then create the OpenTelemetry Collector configuration file in the same directory:
123456789101112131415161718# otelcol.yamlreceivers:otlp:protocols:http:endpoint: 0.0.0.0:4318 # requiredexporters:otlp_http:endpoint: http://jaeger:4318tls:insecure: trueservice:pipelines:traces:receivers: [otlp]exporters: [otlp_http]
Run the setup with:
1docker compose up -d
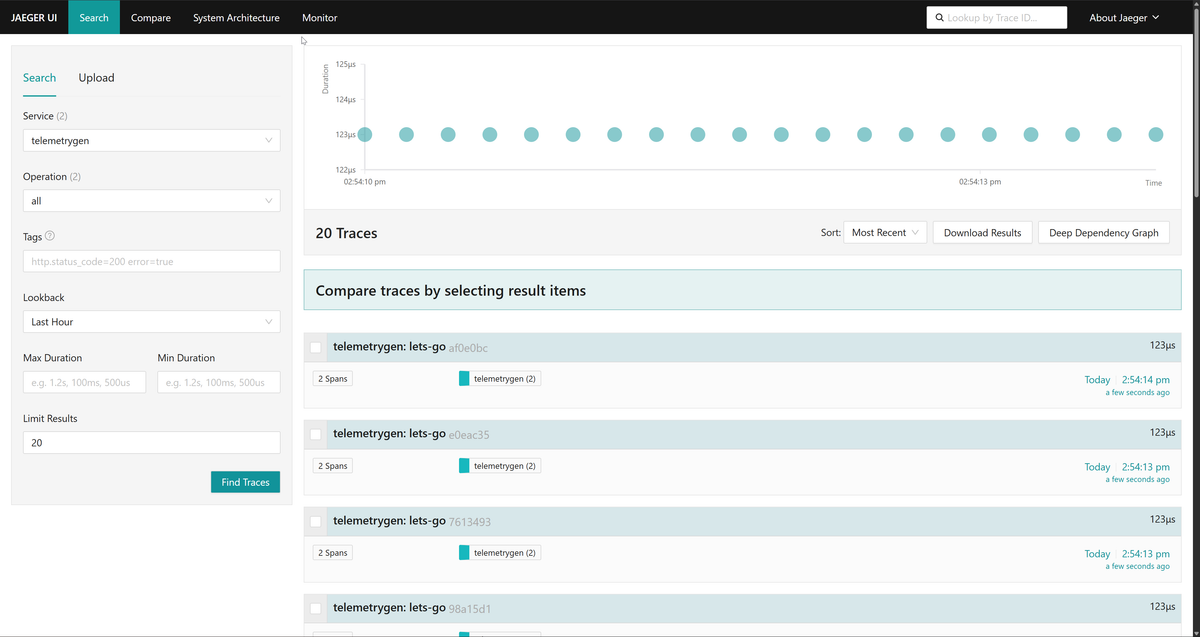
Once all containers are up, open http://localhost:16686 and select the
telemetrygen service to confirm traces are arriving via HTTP:
Setting up the OTLP HTTP exporter
The otlp_http exporter supports a similar configuration structure to the
gRPC variant except that it
operates over plain HTTP and can be configured with distinct endpoints per
signal type.
Let's examine the various tuning knobs below:
Configuring OTLP endpoints
There's a subtle but important difference in how the Collector handles the
generic endpoint versus specific overrides like traces_endpoint.
When you use the top-level endpoint setting, the Collector assumes standard
OTLP conventions. It automatically appends the default path for each signal type
(/v1/traces, /v1/metrics, /v1/logs, or /v1/profiles) to the base URL you
provided:
12345678exporters:otlp_http:# With this, the collector will send# - traces to https://otel.example.com:4318/v1/traces# - logs to https://otel.example.com:4318/v1/logs# - metrics to https://otel.example.com:4318/v1/metrics# - profiles to https://otel.example.com:4318/v1/profilesendpoint: https://otel.example.com:4318
If your backend doesn't expose telemetry on the standard OTLP HTTP paths, you can override them on a per-signal basis by providing full URLs for each signal type.
This is common when different signals are routed through separate ingestion services or when a backend expects custom endpoints rather than the default OTLP layout.
1234567exporters:otlp_http:# You must provide the full url for each signaltraces_endpoint: https://otel.example.com:4318/path/to/tracesmetrics_endpoint: https://otel.example.com:4318/path/to/metricslogs_endpoint: https://otel.example.com:4318/path/to/logsprofiles_endpoint: https://otel.example.com:4318/path/to/profiles
When you use these overrides, you must provide the full URL, including the path, as seen above as the Collector does not append anything.
If endpoint and <signal_endpoint> are used together, the specific signal
configuration takes precedence for that signal alone, while the general endpoint
acts as a fallback for any other signals.
12345678exporters:otlp_http:# The Collector automatically appends /v1/logs, /v1/metrics, and/v1/profilesendpoint: "https://some-backend.example.com"# Traces will go here instead.traces_endpoint: "https://tracing.example.com/v1/traces"
Improving throughput via compression
Compression is the easiest way to reduce egress costs and improve transmission
speed over public networks. The otlp_http exporter enables gzip by default,
which is suitable for most use cases:
1234567exporters:otlphttp:# Default is "gzip".# Options: "gzip", "zstd", "snappy", "none"# Note: "zstd" offers better compression ratios with lower CPU usage than gzip,# but requires receiver support.compression: gzip
However, compression is a trade-off as you're paying CPU cycles to save network
bandwidth. If your Collector is CPU-bound but you have ample bandwidth,
switching to snappy or zstd (if available)
can provide faster compression
speeds than gzip, or you can disable compression altogether.
Choosing the right encoding
The otlp_http exporter supports two serialization formats. This setting
controls the Content-Type header and the payload body format sent to your
backend:
proto(default): uses Protocol Buffers in a binary format, which is faster to serialize, produces smaller payloads, and consumes less CPU. This should be your default choice in production.json: uses standard JSON text encoding, which is significantly slower and results in much larger payloads. It’s best reserved for local debugging or for integrating with legacy systems that do not support Protocol Buffers.
123exporters:otlphttp:encoding: json
Tip: If you're getting 415 Unsupported Media Type errors from your backend,
check this setting. Some ingress endpoints might reject application/x-protobuf
and require application/json.
Securing the connection with TLS and authentication
Exporting telemetry securely boils down to two things: The data must be encrypted in transit using TLS and the Collector must authenticate itself to the backend so the data is accepted and attributed correctly.
Authentication via headers
Most backends, whether SaaS or self-hosted, require an API token or key to
accept data. The otlp_http exporter supports this through a simple headers
map, which is sent with every request.
Secrets should never be hardcoded into configuration files. Instead, inject
them at runtime using environment variables with the ${env:VAR_NAME} syntax:
12345exporters:otlp_http:endpoint: https://ingress.eu-west-1.aws.dash0.comheaders:Authorization: Bearer ${env:OTEL_API_KEY}
This keeps credentials out of version control and allows you to rotate keys without touching your Collector configuration.
TLS configuration
If your endpoint uses https://, the Collector automatically enables TLS with
system default certificate verification using your operating system’s trust
store. For most public SaaS backends, no additional configuration is required.
In internal environments, you may encounter self signed certificates or
endpoints that require mutual TLS (mTLS). In these cases, you must explicitly
configure the tls block:
1234567exporters:otlp_http:endpoint: https://internal-gateway:4318tls:ca_file: /etc/ssl/certs/ca.pemcert_file: /etc/ssl/certs/client.pemkey_file: /etc/ssl/private/client.key
And if you need to disable TLS entirely for local testing purposes, use:
12345exporters:otlp_http:endpoint: http://jaeger:4318tls:insecure: true
For details on TLS configuration, see the TLS configuration guide.
Timeout and buffer settings
Because HTTP is a request-response protocol (unlike gRPC's persistent streaming), handling network stalls effectively is critical. Here are some tuning knobs you can use:
Setting a timeout
This defines how long a single HTTP request is allowed to run before it’s aborted. The default is 30 seconds:
123exporters:otlp_http:timeout: 60s
For example, you could:
-
Lower it if you have a highly responsive backend and want to "fail fast" so the Collector can retry or drop data quickly to avoid memory queue buildup.
-
Raise it if you are sending massive batches or communicating over high-latency networks.
Tuning buffer sizes
In the otlp_http exporter, these settings control the size of the internal I/O
buffers used by the Go HTTP client. They do not change batching behavior or
request size directly; they only affect how data is read from and written to the
network socket.
12345exporters:otlphttp:# Only change if you know what you are doing.read_buffer_size: 0write_buffer_size: 524288 # 512KB
read_buffer_size
This sets the size, in bytes, of the read buffer used by the HTTP client when
receiving responses from the backend. The default value of 0 means "use the Go
runtime default".
The response bodies for OTLP exports are typically tiny (often just an ACK), so this buffer is rarely a performance bottleneck. Increasing this value almost never helps unless your backend returns unusually large responses.
In practice, most deployments should leave this at the default.
write_buffer_size
This controls the size of the write buffer used when sending request bodies to the backend. It affects how efficiently the exporter writes large payloads (for example, batched traces or metrics) to the network.
A larger buffer can reduce the number of syscalls when exporting high volume telemetry, at the cost of additional memory per connection. The default of 512 KB is a reasonable balance for most production workloads.
You might consider tuning this only if you are pushing very large batches over high latency links and have already verified that batching and compression are correctly configured.
These options are low level transport tuning knobs. For almost all users, they should be left unchanged. If you're troubleshooting throughput issues, focus first on batching, compression, and retry behavior before touching buffer sizes.
Building resilient pipelines with retries and queuing
The otlp_http exporter uses the same
exporterhelper
framework as the gRPC exporter. That means retries, buffering, and backpressure
handling are all first-class features you can tune to match real world failure
modes.
Configuring retries with exponential backoff
When an export request fails, the otlp_http exporter can retry automatically
using exponential backoff. Retries are only triggered for transient failures,
such as HTTP 429 or 503, where retrying is likely to succeed:
123456789exporters:otlp_http:retry_on_failure:# Default settingsenabled: trueinitial_interval: 5s # initial waiting time after first failuremax_interval: 30s # Upper bound on backoffmax_elapsed_time: 300s # maximum time to retry sending a batchmultiplier: 1.5 # retry interval is multiplied on each attempt
The exporter keeps retrying until either the request succeeds or
max_elapsed_time is exceeded. Setting max_elapsed_time: 0 enables indefinite
retries, but it can amplify backpressure elsewhere in the pipeline.
Configuring a memory buffer
The sending_queue is the pressure buffer between your pipelines and the
network. If it's undersized or misconfigured, failures show up in two ugly ways:
out-of-memory kills, or silent data loss.
The goal is to decide, very explicitly, how much data you're willing to buffer and what should happen when that buffer fills up.
1. Sizing the queue (sizer and queue_size)
123456exporters:otlp_http:sending_queue:enabled: truesizer: requestsqueue_size: 1000
By default, the queue is sized to 1000 units and uses requests as its sizer.
What those units represent depends entirely on the sizer you choose:
-
requests: Counts batches, not individual signals. If your upstream sends large batches (1000 spans per request), aqueue_sizeof 1000 means you could potentially buffer up to a million spans in memory. -
items: Counts individual spans, metric points, or log records. This is much safer for memory planning and makes queue size directly meaningful, at the cost of a small CPU overhead. -
bytes: Measures serialized size in bytes. This gives the tightest memory control, but it is the most CPU intensive option and is rarely needed outside very strict environments.
2. Handling overload (block_on_overflow)
12345exporters:otlp_http:sending_queue:enabled: trueblock_on_overflow: false
Eventually, with enough traffic, every queue fills up. This setting decides whether overload turns into data loss or backpressure:
-
false: New data is dropped once the queue is full. You'll see dropped telemetry in Collector metrics, but the process stays alive and your application continues running. -
true: The Collector stops reading from its receivers and propagates backpressure upstream until space is available. In sidecar or in-process setups, this can block application threads and cause outages.
Unless you fully understand how backpressure propagates through your stack, dropping data is the safer failure mode.
3. Controlling export parallelism (num_consumers)
12345exporters:otlp_http:sending_queue:enabled: truenum_consumers: false
The num_consumers setting controls how many HTTP requests the exporter can
have in flight at the same time (10 by default). Each worker pulls a batch,
sends an HTTP POST, waits for the response, then goes back for the next batch.
If your backend has high latency, consumers spend most of their time waiting on network responses. Throughput drops, the queue fills, and data may start getting dropped even though your CPU is mostly idle. In that case, increasing it can help, as long as you monitor backend limits.
On the other hand, pushing this to a very high number can overwhelm your own CPU or network due to context switching and socket churn. It can also trip rate limits or DDoS protection on the backend, resulting in a flood of HTTP 429 responses.
4. Synchronous vs asynchronous export (wait_for_result)
12345exporters:otlp_http:sending_queue:enabled: truewait_for_result: false
This option flips the exporter’s behavior in a fundamental way. It decides whether exporting telemetry is asynchronous or fully synchronous.
The default value is false so the receiver hands data to the queue and
immediately reports success so that exporting happens in the background. This is
the mode you want almost all the time.
However, if you need end-to-end acknowledgement where some piece of telemetry
must be confirmed to have been exported to the chosen backend, set
wait_for_result to true. In this case, the receiver blocks until the data
has actually been sent to the backend and a response is received.
Keep in mind that turning this on effectively bypasses the value of the queue and makes the Collector act like a synchronous proxy. If the backend returns a 503, times out, or slows down, that failure is reflected straight back to the application sending telemetry.
Enabling exporter-native batching (recommended)
The otlp_http exporter can also batch data inside the sending queue itself,
although this is disabled by default. When enabled, it removes the need for a
separate batch processor
and avoids
the pitfalls of that processor:
12345678910exporters:otlp_http:sending_queue:# Replaces batch processor (recommended)batch:# Send chunks of 1000 items or every 200msmin_size: 8192max_size: 0flush_timeout: 200mssizer: items
min_size: The queue worker will wait to pull data until it sees at least this many items (or bytes) in the queue. This helps to prevent the thundering herd of tiny requests.max_size: If a batch is larger than this value, it gets split into multiple requests. This is a useful knob to avoid hitting payload limits on your backend.flush_timeout: Ifmin_sizeisn't reached by this time, whatever is currently present in the batch is sent regardless of its size.sizer: This is similar tosending_queue.sizer, but for controlling howmin_sizeandmax_sizeare calculated. If this field is not set, it inherits fromsending_queue.sizerbut if that is also not set, it will default toitems.
Surviving restarts and crashes with a persistent queue
The in-memory sending queue protects you from short outages and slow backends. The persistent queue protects you from something more consequential: Collector restarts, node reboots, and hard crashes.
When a persistent queue is enabled, queued batches are written to disk instead of kept in memory. If the Collector is killed while data is still queued, that data is recovered on startup and export resumes where it left off.
Persistence is enabled by pointing the sending_queue at a storage extension.
Once this is set, there is no in-memory queue at all, and everything goes
through disk-backed storage.
File storage is the most common and safest choice for most production setups:
12345678910111213141516171819extensions:# Define the extensionfile_storage:directory: /var/lib/otelcol/storageexporters:otlp_http:sending_queue:enabled: truequeue_size: 5000# Reference the extensionstorage: file_storageservice:extensions: [file_storage] # Enable the extensionpipelines:traces:receivers: [otlp]exporters: [otlp_http]
The queue_size setting still applies, but now it limits how many batches can
be stored on disk rather than in RAM. Since you usually have more storage
available compared to RAM, it could be worth increasing the default number up
from 1000 depending on your environment.
With a persistent queue enabled:
- Incoming batches are written to disk
- Consumers read batches from disk and attempt export
- Successfully exported batches are deleted
- Failed batches follow normal retry rules
If the Collector crashes or is restarted while batches are queued or in flight, those batches remain on disk. On startup, the queue is reconstructed and export continues automatically.
Context propagation caveat (important)
Note that note all context survives persistence. Request-level context, such as client metadata and span context, is preserved when data is written to disk. Context added by authentication extensions, however, is not persisted and will be missing when queued data is later replayed.
In practice, this usually means:
- Static headers configured on the exporter are safe.
- Dynamic per-request auth injected by extensions may not work as expected with persistent queues
So if you rely on auth extensions, verify their behavior carefully before enabling persistence.
Monitoring OTLP HTTP exporter health
When you're running the otlp_http exporter in production, there are three
questions you should always be able to answer:
- Is data flowing?
- Is it backing up?
- Is anything being dropped?
The following internal Collector metrics map cleanly to those questions.
1. Is data flowing?
These metrics tell you whether the exporter is successfully delivering telemetry to the backend:
123otelcol_exporter_sent_spansotelcol_exporter_sent_metric_pointsotelcol_exporter_sent_log_records
Since they are cumulative counters, they should monotonically increase over time. If you notice flat lines (unchanging values), it means nothing is getting out.
To understand flow through the entire pipeline, compare the exporter metrics with receiver and processor metrics:
123456otelcol_receiver_accepted_spansotelcol_receiver_accepted_metric_pointsotelcol_receiver_accepted_log_recordsotelcol_processor_incoming_itemsotelcol_processor_outgoing_items
Processors sit between receivers and exporters and may intentionally drop data through filtering, sampling, or routing, so a reduction between processor incoming and outgoing counts usually reflects expected behavior.
What you want to see is continuity: data is accepted by receivers, reduced or transformed by processors as configured, and then steadily sent by exporters. If receivers and processors show activity but exporter metrics stall, the issue is downstream of the pipeline.
2. Is the queue backing up?
These are the most important health signals for the OTLP HTTP exporter:
12otelcol_exporter_queue_sizeotelcol_exporter_queue_capacity
A queue_size that steadily climbs toward queue_capacity is a clear signal
that the backend cannot keep up with the export rate. Even if no data is being
dropped yet, a queue that remains close to capacity for extended periods should
be treated as a warning.
Short spikes during incidents or brief slowdowns are normal, but sustained growth indicates a structural throughput problem that could eventually result in loss.
3. Is data being dropped?
There are two different places where data can be lost, and they mean very different things operationally.
The first is failure to enqueue, which happens when data is dropped before it ever reaches the sending queue. This shows up in the following metrics:
123otelcol_exporter_enqueue_failed_spansotelcol_exporter_enqueue_failed_metric_pointsotelcol_exporter_enqueue_failed_log_records
When these counters increase, the queue is full and block_on_overflow is set
to false. At that point, the loss is immediate and permanent.
The second is failure to send, which happens after data has been queued and retried but still cannot be delivered. These failures are reported by the following metrics:
123otelcol_exporter_send_failed_spansotelcol_exporter_send_failed_metric_pointsotelcol_exporter_send_failed_log_records
Small, short-lived spikes are common during backend hiccups, but a sustained rise usually points to network problems or an unhealthy backend.
Final thoughts
The OTLP HTTP exporter is the most compatible and straightforward way to ship telemetry data across diverse environments. It works anywhere HTTP can reach, avoids gRPC's connection complexity, and integrates easily with proxies and load balancers.
While it trades some efficiency for compatibility, the exporter includes all the same resilience features as its gRPC counterpart—TLS security, retries, queuing, and persistent buffering. With careful tuning, it can deliver reliable, secure telemetry at scale.
Once the data reaches your backend, the true value begins: transforming raw telemetry into actionable insight. When paired with an OpenTelemetry-native platform like Dash0, the OTLP HTTP exporter helps you maintain full context and observability across your entire stack.
