Last updated:
Compile-Time OpenTelemetry Auto-Instrumentation in Go
Java, Python, .NET, and Node.js developers have had zero-code auto-instrumentation for years. An agent attaches when the application starts and generates telemetry without requiring changes throughout the codebase.
Go has been a harder target because it compiles to a native binary without a virtual machine, bytecode, or classloader that an instrumentation agent can intercept. Until recently, your main options were an eBPF agent with Linux-specific privileges or manual OpenTelemetry instrumentation inside each service.
That changed in July 2026, when the OpenTelemetry
Go Compile-Time Instrumentation SIG
released v1 of otelc. The command-line tool injects traces, metrics, and log
correlation while your application is being compiled, without requiring source
changes or a runtime agent.
In this guide, you'll clone a small Go service, build it with otelc, and
inspect the resulting telemetry data. You'll also learn how the build-time
instrumentation works, which libraries it supports, and how to customize it.
Prerequisites
You'll need the following installed on your machine:
- Go 1.22 or later, as the demo uses
net/httprouting patterns introduced in 1.22. - Docker and Docker Compose to run the OpenTelemetry Collector that receives telemetry from the demo app.
curl(or any HTTP client) to send test requests.
Cloning the demo application (optional)
To demonstrate compile-time instrumentation, you'll use a small Go service that
exercises three libraries supported by otelc: net/http, database/sql, and
log/slog.
The application records visits in an in-memory SQLite database. Its / endpoint
inserts a visit and returns the current count, while /fetch makes an HTTP
request back to /. The second endpoint produces nested HTTP client, HTTP
server, and database operations within one trace.
You can follow the rest of the article without running the demo, but cloning the starter project lets you build the application, generate telemetry, and inspect the resulting traces, metrics, and logs in OTel Desktop Viewer.
Clone the demo project and enter its directory:
git clone https://github.com/dash0-community/otelc-golang-demo && cd otelc-golang-demoThe project contains the following files:
.
├── main.go
├── go.mod
├── go.sum
├── docker-compose.yml
├── otelcol.yaml
├── Makefile
└── README.md-
main.gocontains the HTTP server, SQLite operations, and structured logging. It does not import the OpenTelemetry SDK or an instrumentation package becauseotelcadds the required instrumentation while compiling the application. -
otelcol.yamldefines the local telemetry pipeline. -
docker-compose.ymlruns the Collector and OTel Desktop Viewer.
Running the application without instrumentation
Before using otelc, build and run the application normally to verify that the
starter project and its dependencies work before OpenTelemetry instrumentation
is introduced.
Download the pinned dependencies and compile the application:
go mod download
go build -o otelc-demo .
Start the resulting binary:
./otelc-demoThe service listens on port 8080. From another terminal, send two requests to
confirm that the visit count increases:
curl http://localhost:8080/
curl http://localhost:8080/
The second response should report a higher visits value:
{
  "message": "hello from otelc-demo",
  "visits": 2
}
The /fetch endpoint makes an outbound HTTP request back to /, which will
later let you inspect HTTP client, HTTP server, and database operations within
the same trace:
curl http://localhost:8080/fetchThe response includes the result returned by the internal request:
{
  "proxied": true,
  "upstream": {
    "message": "hello from otelc-demo",
    "visits": 3
  }
}
At this point, the service only writes normal
JSON logs. It doesn't emit traces,
metrics, or
OpenTelemetry log records.
Stop the service with Ctrl+C before proceeding to the next section.
Installing otelc
The next step is installing the build tool that will add OpenTelemetry instrumentation during compilation.
Install the otelc command-line interface with go install:
go install \
  go.opentelemetry.io/otelc/tool/cmd/otelc@latest
go install downloads the otelc source, compiles it, and places the binary in
your configured Go binary directory, which is usually $GOPATH/bin or
$HOME/go/bin.
Verify that the command is available in your PATH:
otelc versionYou should see:
otelc version v1.0.1If your shell cannot find otelc, add the Go binary directory to your PATH
before continuing.
Starting the local telemetry stack
The instrumented application exports telemetry over the OpenTelemetry Protocol (OTLP), so it needs a Collector or observability backend to receive it.
The Collector receives OTLP from the application and sends each signal to two destinations: its debug exporter and OTel Desktop Viewer.
The repository includes the following Collector configuration:
# otelcol.yaml
receivers:
  otlp:
    protocols:
      grpc:
        endpoint: 0.0.0.0:4317
      http:
        endpoint: 0.0.0.0:4318

exporters:
  debug:
    verbosity: detailed

  otlp_grpc/otel-desktop-viewer:
    endpoint: otel-desktop-viewer:4317
    tls:
      insecure: true

service:
  pipelines:
    traces:
      receivers: [otlp]
      exporters: [debug, otlp_grpc/otel-desktop-viewer]

    metrics:
      receivers: [otlp]
      exporters: [debug, otlp_grpc/otel-desktop-viewer]

    logs:
      receivers: [otlp]
      exporters: [debug, otlp_grpc/otel-desktop-viewer]
Each pipeline receives one OpenTelemetry signal and sends it to both exporters.
The debug exporter writes detailed telemetry to the Collector logs, while the
OTLP gRPC exporter sends a
copy to OTel Desktop Viewer for inspection in a browser.
The accompanying Docker Compose configuration runs both services and exposes the necessary ports:
# docker-compose.yml
services:
  collector:
    image: otel/opentelemetry-collector-contrib:0.156.0
    command: [--config=/etc/otelcol/config.yaml]
    volumes:
      - ./otelcol.yaml:/etc/otelcol/config.yaml:ro
    ports:
      - 4317:4317
      - 4318:4318

  otel-desktop-viewer:
    image: ghcr.io/ctrlspice/otel-desktop-viewer:latest
    ports:
      - 8000:8000
The application sends OTLP to the Collector through ports 4317 or 4318, and
the viewer is available at http://localhost:8000. Its OTLP receiver remains
internal to the Docker network because only the Collector needs to reach it.
Start both services in the background:
docker compose up -dThen check that both containers are running:
docker compose psBoth the collector and otel-desktop-viewer services should have a status of
Up.
To watch the Collector receive and export telemetry, follow its logs:
docker compose logs -f collectorYou can also open http://localhost:8000 to inspect the same traces, metrics, and logs in OTel Desktop Viewer. The interface will remain empty until you start the instrumented application and send it some requests.
Building the auto-instrumented Go binary
With the local telemetry stack running, rebuild the application through otelc.
The command wraps the normal Go build process and injects the matching
OpenTelemetry instrumentation before the compiler produces the binary:
otelc go build -o otelc-demo .The first instrumented build is usually more verbose than a normal go build
because otelc must resolve its instrumentation modules and their dependencies:
go: downloading gotest.tools/v3 v3.5.2
...
go: found go.opentelemetry.io/otelc/instrumentation/database/sql in
go.opentelemetry.io/otelc/instrumentation/database/sql
v0.0.0-00010101000000-000000000000
...
go: downloading go.opentelemetry.io/contrib/exporters/autoexport v0.69.0
...
The go: found entries show which instrumentation modules matched packages in
the application's dependency graph. For this demo, otelc detects
instrumentation for:
database/sql- OpenTelemetry SDK initialization
- the standard
logpackage log/slog- the
net/httpclient and server - Go runtime metrics
These messages provide a useful first check when troubleshooting. If an expected module is missing, the application may be using an unsupported library or version, or the relevant package may not be present in the compiled dependency graph.
The injected hooks are compiled and linked with the rest of the application. The result is therefore a normal Go executable rather than a binary that depends on a separate runtime agent.
When the command completes, the otelc-demo binary is ready to run with
OpenTelemetry enabled.
You can also integrate otelc through Go's -toolexec mechanism when changing
every build command is inconvenient. First, prepare the required instrumentation
dependencies:
otelc setupThen configure go build to invoke otelc through GOFLAGS:
export GOFLAGS="${GOFLAGS} '-toolexec=otelc toolexec'"
go build -o otelc-demo .
Both approaches produce an instrumented binary. Prefixing go build with
otelc is clearer for local use, while the GOFLAGS approach can be easier to
apply across an existing build or continuous integration workflow.
Running the instrumented application
The binary now contains the injected OpenTelemetry instrumentation. Start it with the standard OpenTelemetry environment variables that identify the service and point its exporters at the local Collector:
OTEL_SERVICE_NAME=otelc-demo \
OTEL_EXPORTER_OTLP_ENDPOINT=http://localhost:4318 \
OTEL_EXPORTER_OTLP_PROTOCOL=http/protobuf \
./otelc-demo
OTEL_SERVICE_NAME assigns the service name attached to its telemetry,
OTEL_EXPORTER_OTLP_ENDPOINT directs all signals to the Collector's OTLP/HTTP
receiver, while OTEL_EXPORTER_OTLP_PROTOCOL explicitly selects the
http/protobuf transport used on port 4318.
When the application starts, otelc logs the OpenTelemetry components it
initialized before the server begins accepting requests:
{"time":"2026-07-18T11:13:29.601424789+01:00","level":"INFO","msg":"trace provider initialized with auto-export"}
{"time":"2026-07-18T11:13:29.601562593+01:00","level":"INFO","msg":"meter provider initialized with auto-export"}
{"time":"2026-07-18T11:13:29.602471007+01:00","level":"INFO","msg":"logger provider initialized with auto-export"}
{"time":"2026-07-18T11:13:29.602501929+01:00","level":"INFO","msg":"OpenTelemetry initialized","instrumentation_name":"go.opentelemetry.io/otelc","instrumentation_version":"dev"}
{"time":"2026-07-18T11:13:29.602884833+01:00","level":"INFO","msg":"runtime metrics enabled"}
{"time":"2026-07-18T11:13:29.603102925+01:00","level":"INFO","msg":"DB client instrumentation initialized"}
These messages confirm that otelc created providers for traces, metrics, and
logs, configured their exporters, enabled Go runtime metrics, and activated the
database/sql instrumentation detected during the build.
From another terminal, send requests to both endpoints so the application produces HTTP, database, and runtime telemetry:
curl http://localhost:8080/
curl http://localhost:8080/fetch
To watch the Collector receive and forward the telemetry, follow its logs:
docker compose logs -f collectorYou should see trace spans, metric data points, and log records printed by the debug exporter. That same telemetry is forwarded to OTel Desktop Viewer, so you can open http://localhost:8000 in your browser to explore them through its web interface.
What you should see
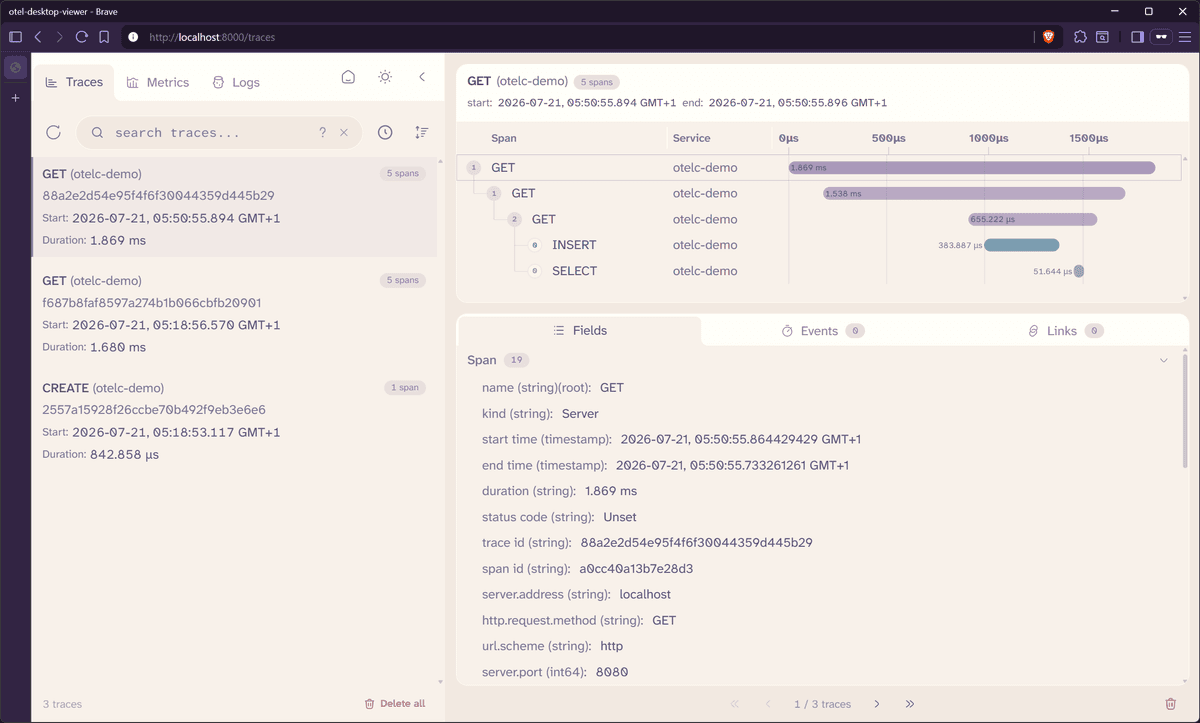
The /fetch trace begins with the incoming request, followed by the outbound
call back to the service and the nested GET / request. The INSERT and
SELECT spans appear beneath that request because the handler passes its
context to ExecContext and QueryRowContext.
Select an HTTP span to inspect attributes defined by the OpenTelemetry HTTP semantic conventions, such as the request method, response status code, server address, and route.
The database spans include attributes describing the database system, operation, and executed statement. The exact attribute names and values can vary with the semantic convention version used by the injected instrumentation.
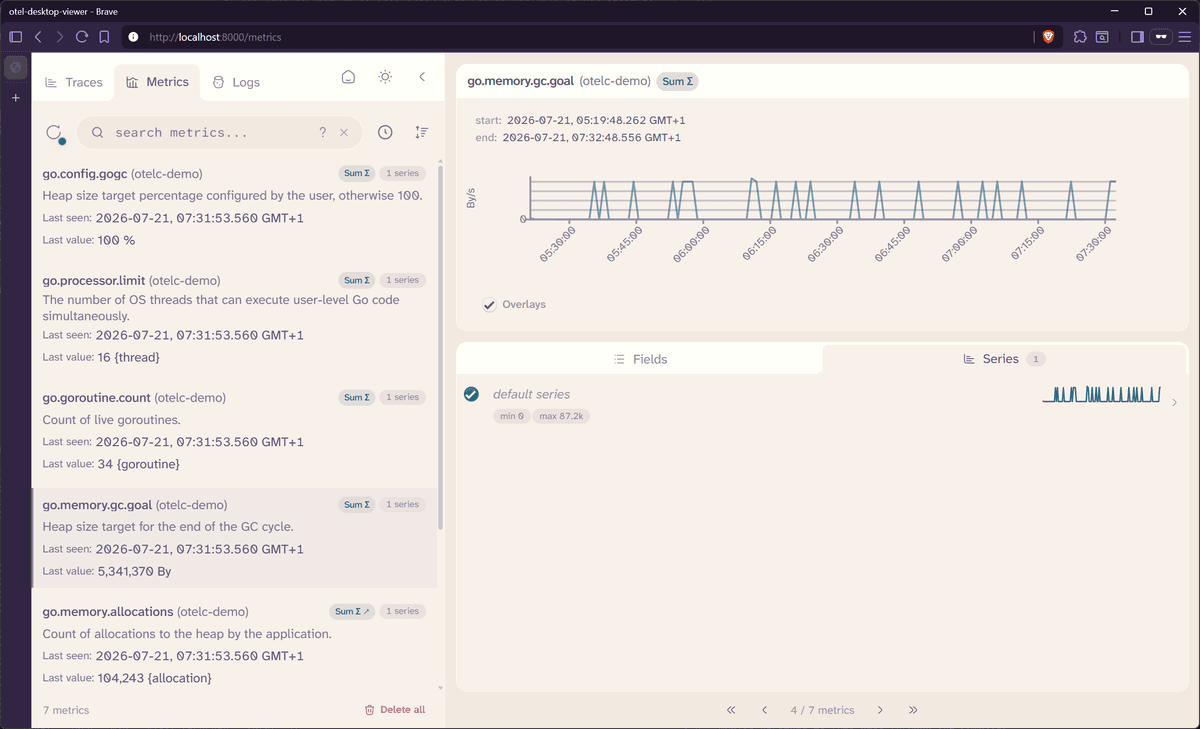
You should also see metrics produced by the HTTP and runtime instrumentations. The HTTP metrics describe request duration and active requests, while the Go runtime metrics expose details such as goroutine counts, memory allocation, and garbage collection activity.
Runtime metrics are emitted periodically, so they may take longer to appear than traces. Send several requests and wait for the next metric export interval before concluding that metrics are missing.
How otelc instruments a Go build
otelc works by joining the standard Go build process rather than attaching an
agent after the application starts.
The Go toolchain provides a
-toolexec
flag that allows an external command to intercept tool invocations during a
build. When you run otelc go build, otelc uses this mechanism to inspect and
modify packages as they pass through the compiler.
The process has two main phases:
-
During preprocessing,
otelcexamines the dependency graph and selects the instrumentation rules that match the compiled packages. -
During instrumentation,
otelcrewrites the matched code and inserts the hooks required to initialize OpenTelemetry, create spans, record metrics, and propagate context.
The injected hooks are compiled and linked with the rest of the application. The
result is therefore a normal Go executable rather than a binary that depends on
a separate runtime agent. The same mechanism also allows otelc to instrument
supported dependencies and parts of the standard library, not just the code in
your own modules.
Note that compile-time instrumentation avoids a separate runtime agent, but it does not eliminate runtime overhead. The injected code still creates spans, records metrics, propagates context, and exports telemetry, all of which consume CPU, memory, and network capacity.
Pinning instrumentation dependencies
The default otelc go build workflow discovers the required instrumentation
modules for that build without permanently adding them to your application's
go.mod or go.sum.
The dependencies are still compiled into the resulting executable, but this means a scanner that only reads the module files may not see every package shipped in the instrumented binary. For release builds, inspect the binary directly:
go version -m ./otelc-demoYou can also generate a software bill of materials from the built artifact rather than relying only on the source module files.
To make the selected instrumentation modules explicit, run:
otelc pinThis creates or updates otel.instrumentation.go, which uses blank imports to
record the instrumentation packages selected for the module. Go can then track
their versions and checksums in go.mod and go.sum.
Because the file has a tools build constraint, it is not included in a normal
application build. It acts as a persistent instrumentation manifest that you can
review and commit when reproducible dependency tracking is required.
Note that the OpenTelemetry project currently describes committed otelc pin
output as a workflow that is still under development.
Security considerations
Because otelc modifies the build process and injects code into the executable,
treat it as part of your trusted toolchain.
Pin the version used in production instead of installing latest:
go install \
  go.opentelemetry.io/otelc/tool/cmd/otelc@v1.0.1
For sensitive builds, enable debug output and retain the working directory:
otelc --debug --work-dir .otelc-build \
  go build -o otelc-demo .
These files help you review the matched rules, generated sources, and build
diagnostics, although they are not a substitute for reviewing otelc and its
instrumentation packages.
Reproducible builds also require more than pinned application dependencies. Pin
the Go toolchain, otelc, instrumentation packages, and build flags, then build
in a clean environment and compare the hashes of artifacts produced by
equivalent builds.
Supported libraries for compile-time auto-instrumentation
otelc includes instrumentation rules for a focused set of standard-library and
widely used Go dependencies. Support is version-specific, so a library may be
supported only for particular releases, and the available instrumentation will
continue to change as the project adds rules and extends existing version
ranges.
Before adopting otelc for a service, check the official supported-libraries page for the current libraries, instrumented operations, and compatible versions. It is the source of truth for built-in instrumentation support.
During a build, otelc only applies rules that match packages in the
application's compiled dependency graph and fall within the supported version
range. Use debug output to confirm which instrumentation modules were selected:
otelc --debug go build -o myapp .Configuring the compile-time instrumentation
You can configure compile-time instrumentation at two different stages. Build
options control how otelc modifies the application, while runtime environment
variables control the telemetry produced by the resulting binary.
Configuring the build
otelc accepts its own flags before the go subcommand. The most useful
options are:
-
--debugor-denables diagnostic logging for the instrumentation process. You can also enable it by settingOTELC_DEBUG=1. -
--rules <file>loads additional instrumentation rules from a YAML file. Each rule identifies a target package, optionally narrows the match to a function or receiver, and specifies whatotelcshould inject. -
--work-dir <path>or-w <path>changes whereotelcstores its temporary build files. You can set the same value throughOTELC_WORK_DIR.
The other primary commands are:
| Command | Purpose |
|---|---|
otelc go ... | Run a Go command with instrumentation applied |
otelc setup | Prepare the environment for the GOFLAGS workflow |
otelc cleanup | Remove artifacts created during setup and builds |
otelc version | Print the installed otelc version |
Configuring OpenTelemetry instrumentation at runtime
Runtime behavior is controlled through the standard OpenTelemetry SDK environment variables, so that service identity, exporter, and resource settings can change without rebuilding the application.
The other thing to configure are what instrumentation modules are active at
runtime. Use OTEL_GO_ENABLED_INSTRUMENTATIONS as an allowlist when you only
want specific modules to run:
export OTEL_GO_ENABLED_INSTRUMENTATIONS=nethttp,database_sqlAnd use OTEL_GO_DISABLED_INSTRUMENTATIONS to turn off selected modules while
leaving the rest active:
export OTEL_GO_DISABLED_INSTRUMENTATIONS=runtimemetricsAll supported instrumentation modules are active by default so these two variables are your only fine-tuning lever.
Troubleshooting compile-time instrumentation
If no telemetry appears, confirm that you built the application with otelc
rather than a normal go build command:
otelc --debug go build -o otelc-demo .Then verify that the Collector is running and reachable at the endpoint
configured in OTEL_EXPORTER_OTLP_ENDPOINT:
docker compose ps
docker compose logs collector
You can also enable OpenTelemetry SDK diagnostics when starting the application as this can reveal connection, protocol, and export errors.
OTEL_LOG_LEVEL=debug ./otelc-demoIf an expected instrumentation is missing, confirm that the application imports a supported library at a compatible version. The supported libraries page lists the current version ranges.
Also check whether the instrumentation was disabled through
OTEL_GO_ENABLED_INSTRUMENTATIONS or OTEL_GO_DISABLED_INSTRUMENTATIONS.
If you updated otelc, changed dependencies, or switched branches, remove old
build artifacts before compiling again:
otelc cleanup
otelc go build -o otelc-demo .
Report bugs through the project's
GitHub issues,
ask usage questions in
GitHub Discussions,
or join the #otel-go-compile-instrumentation channel in
CNCF Slack.
Taking your telemetry into production
OTel Desktop Viewer is useful for confirming that your instrumentation is producing the expected data, but production environments need durable storage, search, dashboards, alerting, and context from the rest of your environment.
Because otelc exports standard OTLP, you can send the same telemetry to any
OTLP-compatible backend
without replacing the instrumentation added during the build.
Dash0 is
OpenTelemetry-native
and supports metrics, traces, logs, and resources through the shared OTLP data
model without translation.
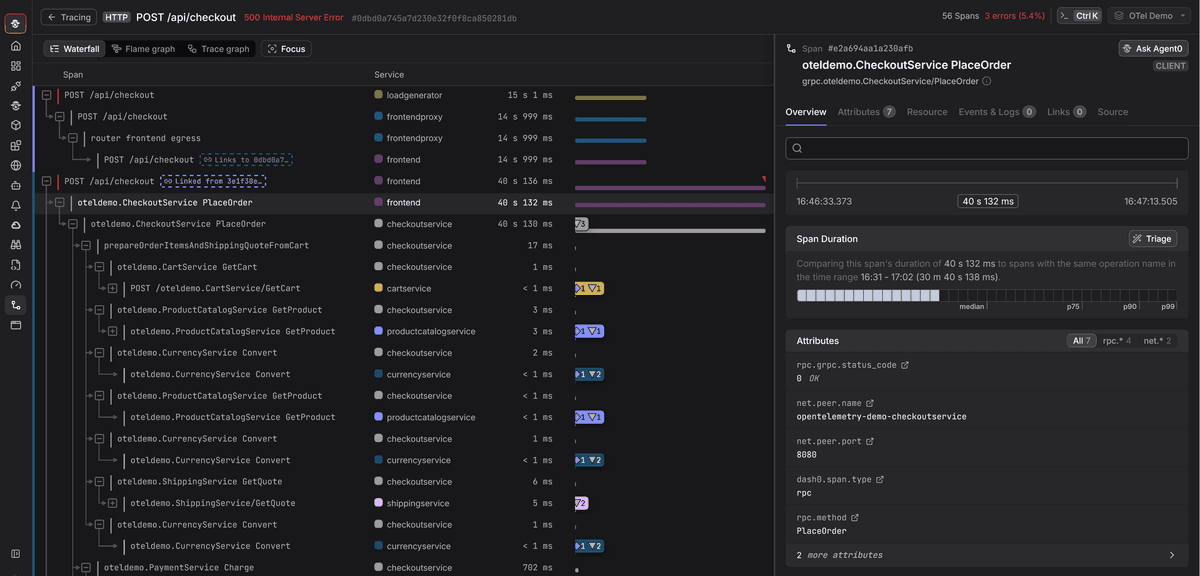
You can export directly to an OTLP endpoint or configure an existing OpenTelemetry Collector to forward the telemetry. This lets you retain the Collector pipeline used in the demo while replacing the debug exporter and local inspector with a production destination.
Once the data arrives, you can investigate a slow endpoint through its traces,
inspect the database spans generated by otelc, and compare those findings with
service and runtime metrics in the same platform. The OpenTelemetry resource
attributes and semantic conventions emitted by the application remain part of
that workflow rather than serving only as an ingestion format.
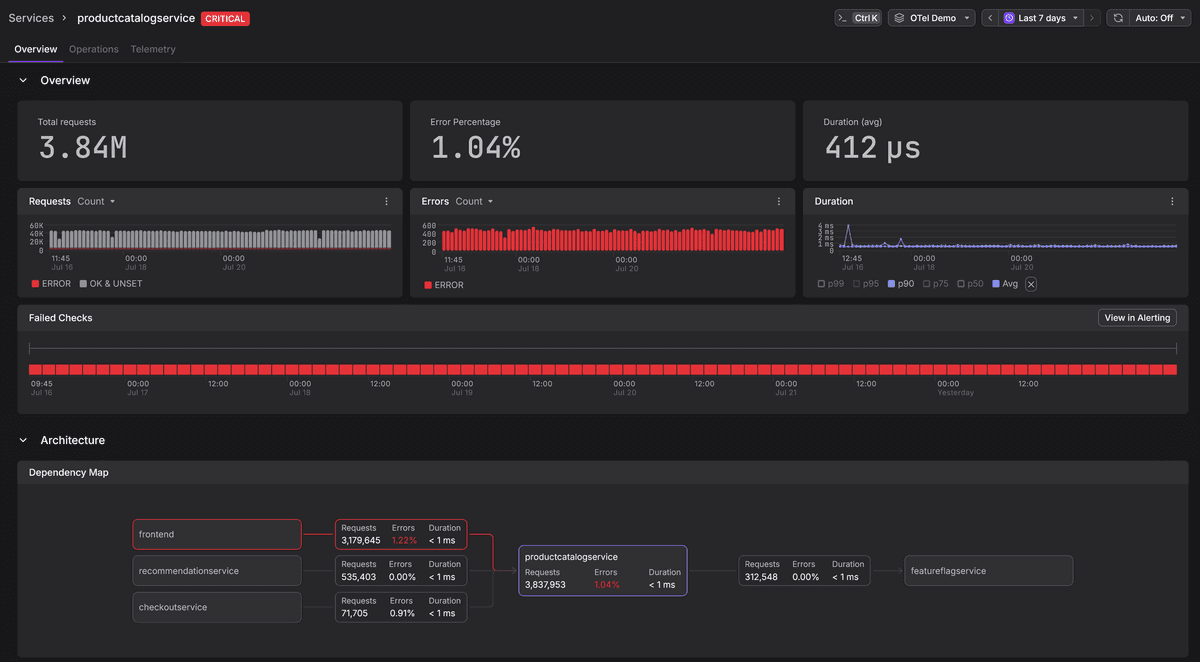
For Kubernetes deployments, the Dash0 Operator can help install and manage an OpenTelemetry Collector in the cluster and send its telemetry to Dash0.
To see all this in action, sign up for a free Dash0 trial with 14 days of unlimited access.
Final thoughts
otelc removes much of the boilerplate required to add baseline OpenTelemetry
instrumentation to supported Go libraries. By changing the compiler command used
for release builds, you can generate traces, metrics, and correlated logs
without modifying each supported integration manually.
It doesn't eliminate the need for manual instrumentation, and you'll still need custom spans and attributes for application-specific operations. The resulting telemetry remains subject to the usual OpenTelemetry configuration, sampling, and data-quality considerations.
If you're evaluating this for your team, start with a single service that uses
one of the supported instrumentations. Build it with otelc, point it at your
Collector, and see what shows up.
Once you've validated otelc against a representative service, you can
integrate the same build command into your release process. Treat the
instrumented compiler and rule versions as pinned build dependencies, and verify
the resulting artifact before rolling the change out more broadly.
For more details, see the official documentation, the v1 announcement, and the project's GitHub repository.